Crop Breeding and Applied Biotechnology 4:325-329, 2004 Brazilian Society of Plant Breeding. Printed in Brazil
Repeatability and number of harvests required for
selection in robusta coffee
Aymbiré Francisco Almeida da Fonseca
1*, Tocio Sediyama
2, Cosme Damião Cruz
3, Ney Sussumu Sakiyama
2, Romário
Gava Ferrão
4, Maria Amélia Gava Ferrão
1, and Scheilla Marina Bragança
5Received 2 March 2004 Accepted 7 July 2004
ABSTRACT - This study aimed to estimate the repeatability coefficient of the grain yield in Coffea canephora by three
methods: to quantify the precision of the measurements; to predict the real value of an individual based on n evaluations; and to determine the number of phenotypic measures required in each plant to obtain an adequate precision level for an efficient discrimination of the genotypes. The coefficients of repeatability and determination were estimated based on four harvests of 80 genotypes. Highest estimates of the repeatability coefficient were obtained by the method of the principal components derived from the matrix of covariances, which expresses the correlation between each measurement pair. The prediction precision of the real individual value ranged from 65.32 to 81.59%, and remained practically unchanged from the sixth harvest on.
Key words: Coffea canephora, repeatability, genetic improvement, robusta coffee.
1Instituto Capixaba de Pesquisa, Assistência Técnica e Extensão Rural (INCAPER), CRDR, Centro Serrano, Rodovia BR 262, Km 94, Fazenda do Estado, 29375-000, Venda Nova do Imigrante, ES, Brasil. *E-mail: [email protected]
2Departamento de Fitotecnia, Universidade Federal de Viçosa (UFV), 36570-000, Viçosa, MG, Brasil 3Departamento de Biologia Geral, BIOAGRO, UFV
4INCAPER, Rua Afonso Sarlo, 29, 29052-010, Vitória, ES, Brasil 5INCAPER, CRDR, 29900-190, Linhares, ES, Brasil
INTRODUCTION
In studies into genetic improvement, particularly those that involve perennial species, selected individuals are expected to maintain their performance throughout their entire life cycle. The soundness of this expectation can be verified by the repeatability coefficient of the studied trait, which can be estimated when the measurement of a trait is realized with a same individual repeatedly in time or space. The correlation between the mentioned repeated measures is called repeatability (Lerner 1977, Cruz and Regazzi 1994).
When several measures of a trait are realized with a given individual, the phenotypic variance can be split in variance within individuals and variance among individuals. This separation serves to indicate how much can be gained by the repetition of the measures and enlighten the nature of the variation caused by the environment. The component within the individuals reflects the variations between successive performances of an individual, only caused by temporary differences in the environment, while the component among individuals is partly caused by the environment and partly by genetic differences. In this case,
the environmental share is predominantly a consequence of factors that affect individuals permanently. In this analysis, the variance owing to temporary environmental circumstances is therefore separated from the rest and can be estimated (Falconer 1981, Cruz and Regazzi 1994).
The phenotypic value of a given trait concerning a certain individual in a particular time or space is function of the general mean, of the genotypic effect on the trait of the referred individual, of the permanent effect of the environment on the study trait, and of the temporary or localized environmental effect on that individual. The repeatability expresses the proportion of the total variance, which is explained by the variations caused by the genotypes and permanent alterations attributed to the common environment. Repeatability thus represents the highest value that broad-sense heritability can attain. When the variance brought forth by the permanent environmental effects is mimimized, the repeatability approaches the heritability (Cruz and Regazzi 1994). Repeatability varies according to the nature of the trait, the genetic population properties, and the environmental conditions under which the individuals are maintained (Falconer 1981, Hansche 1983). Different methods are available for an estimation of the repeatability coefficient, among which the variance analysis and principal component methods can be cited.
When p genotypes are evaluated in n repeated measures, the repeatability coefficient can be estimated by the intraclass correlation obtained from the variance analysis according to adequate statistic models. This method is useful, according to Cruz and Regazzi (1994), when models with one or two variation factors are adopted. The first with one variation factor is used when the number of repeated measures differs for each genotype and, or when the measures are not carried out under equal conditions for all studied genotypes. In this case, the temporary environment effects mingle with the variation within the genotypes, leading to an underestimation of the repeatability coefficient. In the model with two variation factors, however, it is possible to remove the temporary environment effects, offering a more precise estimate of the repeatability coefficient.
According to Abeywardena (1972), the repeatability coefficient can be estimated more efficiently by means of the technique of the principal components, based on the matrix of correlations as well as on the matrix of covariances, especially in situations where the evaluated genotypes present a cyclic performance in relation to the trait studied (Cornacchia et al. 1995). Since this effect can vary in manner/ mode and intensity among the genotypes, the variance analysis used for the estimate of the usual repeatability coefficient may not eliminate the additional to the experimental error and consequently understate the estimate of this coefficient. Objective of this study was to estimate the repeatability coefficient of the grain yield in Coffea canephora by three
different methods to allow for a quantification of the precision of the evaluated measures, a prediction of the real value of an individual based on n evaluations, and the determination of the number of phenotypic measures needed from each individual to obtain an adequate precision level for an efficient selection or discrimination of genotypes under the aspect of time, labor, and cost efficiency.
MATERIAL AND METHODS
The repeatability coefficient (r) and determination (R2) for grain yield were estimated based on the first four harvests (after 24, 36, 48, and 60 planting months) of an experiment, which investigated the performance of 80 Coffea canephora genotypes, variety conilon. Eighty clones and three sexually propagated control materials were used, arranged in randomized complete block design in four replications, conducted in Marilândia, State of Espírito Santo, Brazil, in March 1986. The experimental plots were composed of six healthy plants, grown in a spacing of 3 x 1.5 m, amounting to 27 m2.
The estimate of the repeatability coefficient was obtained by the variance analysis and principal component methods. The latter was based on the correlations as well as on the phenotypic variances and covariance matrix.
Repeatability coefficient based on the method of variance analysis
The following statistical model was adopted with two variation factors (Method 1):
= where
= observation concerning the ith genotype in the jth environment
= general mean
= random effect of the ith genotype under the influence of the permanent environment (i = 1, 2, 3,..., p; p = 80)
= fixed effect of the temporary environment in the jth year (j = 1, 2, 3,..., n; n = 4)
= experimental error established by the temporary effects of the environment in the jth year and the ith genotype
When considering and , as different measures realized in a same individual in different years, the repeatability coefficient is given, according to its concept, by
R e p e a t a b i l i t y c o e f f i c i e n t b a s e d o n t h e p r i n c i p a l components method
Based on the matrix of correlations or on the matrix of covariances among genotypes obtained in each pair of measures, the eigenvalues and normalized eigenvectors were determined. The eigenvector, whose elements present the same signals and similar magnitudes is the one that expresses the tendency of the genotypes to maintain their relative positions in the various time periods, and the proportion of the eigenvalue associated to the same is the estimator of the repeatability coefficient (Cruz and Regazzi 1994).
According to the aforementioned authors, the estimated repeatability coefficient based on the matrix of correlations (Method 2), including the correction proposed by Rutledge (1974) to eliminate the influence of the number of measures on
, is given by:
where
n = number of evaluated years
= eigenvalue associated to the eigenvector whose elements have the same signal and similar magnitudes
The repeatability coefficient, estimated by the matrix of covariances (Method 3), in turn, satisfies:
where
Besides the repeatability coefficient, the estimate of the determination coefficient (R2), and of the number of necessary measures for the prediction of the real value of an individual in function of the desired precision ( ) was calculated, applying, respectively, the following expressions
( )
(
1 R)
r r 1 R n 2 2 o − − = where= number of measures required
R2 = determination or precision of the procedure r = repeatability coefficient
RESULTS AND DISCUSSION
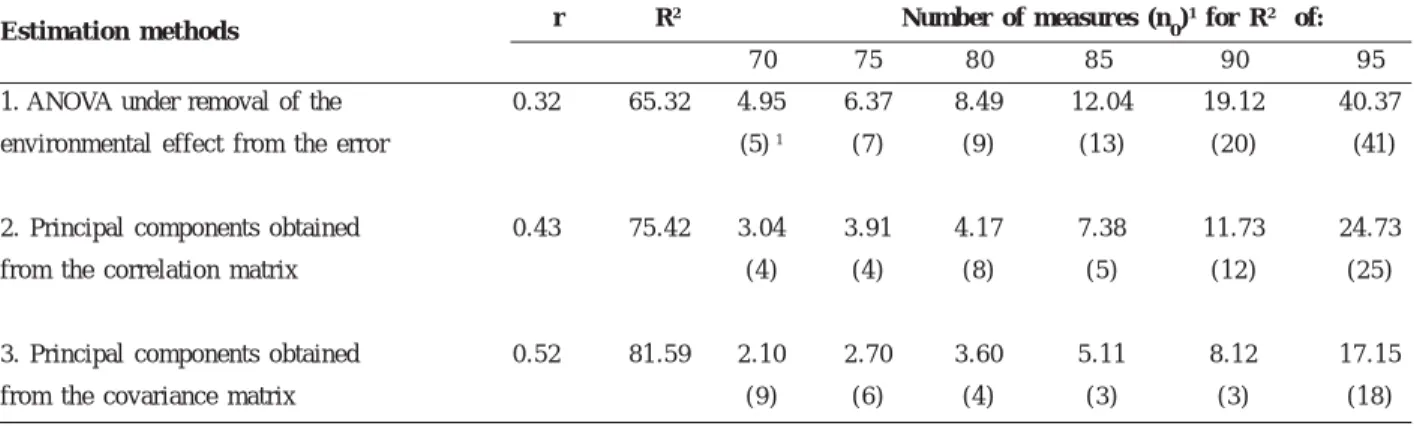
The repeatability (r) and determination coefficients (R2) for grain yield were estimated by the mean of four harvests, based on the methods of variance analysis, where the effect of the environment was removed from the error (method 1) and of the principal components obtained by the matrix of correlations (method 2) and of covariances (method 3) (Table 1). The three applied methods lead to different estimates of the repeatability coefficient. They characterize the importance of a definition of the most appropriate method of calculating the referred estimates in function of the species and studied trait, in order to obtain more precise intervals. Within these, the probability to find the real value of the parameter in question is greater, since each of the various analysis methods available considers particularities related to the manifestation of the different phenomena.
Table 1. Coefficients of repeatability (r) and determination (R2) and estimates of the number of measures (n
0) required to obtain
different R2 by the three estimation methods
r R2 Number of measures (n
0)
1 for R2 of:
7 0 7 5 8 0 8 5 9 0 9 5
1. ANOVA under removal of the 0.32 65.32 4.95 6.37 8.49 12.04 19.12 40.37
environmental effect from the error (5) 1 (7) (9) (13) (20) (41)
2. Principal components obtained 0.43 75.42 3.04 3.91 4.17 7.38 11.73 24.73
from the correlation matrix (4) (4) (8) (5) (12) (25)
3. Principal components obtained 0.52 81.59 2.10 2.70 3.60 5.11 8.12 17.15
from the covariance matrix (9) (6) (4) (3) (3) (18)
1 Values in brackets represent the approximated number of harvests required to obtain different R2 values
The lowest r value (0.32) was attained by the variance analysis method (method 1). The highest value (0.52) was reached by the method of the principal components obtained by the matrix of covariances (method 3).
The estimation methods by means of the technique of the principal components - methods 2 and 3 - took, respectively, the matrixes of correlations and of covariances estimated for each measure pair into consideration. They are therefore esteemed to be the most suitable for the study of the traits with cyclic performance (Abeywardena 1972). This fact indicates that for species like coffee, with a biennial yield cycle, the mentioned methodologies can estimate the repeatability coefficient more competently. In such species, high yields in a given year are frequently followed by lower ones in the subsequent year. This effect is variable in form and intensity among the evaluated genotypes. For the study of repeatability, yields should therefore be considered pairwise (year of high and year of low yield).
The greatest values observed for the estimates of the repeatability coefficient through the methods of the principal components indicate expressive performance differences in the studied genotypes with respect to the biennial nature of the trait in question. According to Cruz and Regazzi (1994), the method of the variance analysis may not eliminate this additional component of the experimental error and thus result in an underestimated repeatability estimate. Similarly, Cornacchia et al. (1995) verified this fact when they estimated the repeatability of the trait wood volume in two pine species. However, Dias and Kageyama (1998) studied the repeatability of several traits in cacao and stated that there are no noticeable differences between the variance analysis and the principal components method, a fact which, according to the authors, indicates a great regularity in the expression of these traits in that species.
Despite the relatively low magnitude of the r values, the precision in predicting the real value of individuals, estimated by the determination coefficient (R2), varies from 65.30 to 81.58%. This is the reliability attained when four harvests are taken into consideration to predict the performance of different genotypes of the species under focus. When the number of measures is established, it is of fundamental importance that the time required and the invested costs be considered to attain a determined level of reliability. Figure 1 shows that when the number of harvests is increased from 4 to 6, the obtained precision rises to values between 73.84 and 86.92%, depending on the applied method. From the sixth harvest on, however, this increase becomes inexpressive and its use unnecessary.
In the simulation of the number of necessary harvests (n0) to obtain the different determination coefficients, it is observed that an increased n did not expressively increase the precision of the real value prediction (Table 1). A meaningful increase in the number of harvests would be necessary to obtain a relative small increase in precision.
CONCLUSIONS
1. The differences in the estimates of the repeatability coefficient obtained through the applied methods indicate the adequacy of use of the various methods available. These are able to obtain a more precise interval, within which the probability to find the real value for this parameter is greater. 2. The highest values for estimates of the repeatability coefficient obtained by the methods of the principal c o m p o n e n t s , d i s p l a y e x p r e s s i v e d i f f e r e n c e s i n t h e performance of the different genotypes regarding the biennial effect of the studied trait.
3. As a biennial trait, the principal component method is the most appropriate for the analysis of the repeatability of the trait grain yield in robusta coffee.
4. Four successive harvests are sufficient for the selection of robusta coffee genotypes in relation to grain yield, with an accuracy of over 80% in the prediction of the real genotype values.
The increment obtained for the genotype selection precision when using more than four harvests is of low magnitude and becomes insignificant from the sixth harvest on.
Figure 1. Estimates of the determination coefficient (R2) in function of the number of harvests, obtained by different repeatability estimation methods
R2 %
Repetibilidade e número de colheitas necessárias à seleção
em café robusta
RESUMO - Este trabalho objetivou estimar o coeficiente de repetibilidade da produção de grãos em Coffea canephora, por
três métodos, visando quantificar a precisão das medidas, predizer o valor real do indivíduo com base em n avaliações e determinar o número de medidas fenotípicas que devem ser tomadas em cada indivíduo para que se obtenha o nível de precisão adequado na discriminação eficiente de genótipos. Os coeficientes de repetibilidade e de determinação foram estimados com base em quatro colheitas de 80 genótipos. As maiores estimativas do coeficiente de repetibilidade foram obtidas pelo método dos componentes principais obtidos da matriz de covariâncias, que considera a correlação entre cada par de medições. A precisão na predição do valor real dos indivíduos variou de 65,32 a 81,59%, e tornou- se praticamente inalterada a partir da sexta colheita.
Palavras-chave: Coffea canephora, repetibilidade, melhoramento genético, café robusta.
REFERENCES
Abeywardena V (1972) An application of principal component analysis in genetics. Journal Genetics 61: 27-51. Cornacchia G, Cruz CD and Pires IE (1995) Estimativas do
coeficiente de repetibilidade para características fenotípicas de procedências de Pinus tecunumanii (Schw.) Eguiluz & Perry e Pinus caribaea var. hondurensis Barret & Golfari. Revista
Árvore 19: 333-345.
C r u z C D a n d R e g a z z i A J ( 1 9 9 4 ) M o d e l o s b i o m é t r i c o s
a p l i c a d o s a o m e l h o r a m e n t o g e n é t i c o . E d i t o r a U F V,
Viçosa, 390p.
Dias LAS and Kageyama PY (1998) Repeatability and minimum harvest period of cacao (Theobroma cacao L.) in Southern Bahia. Euphytica 102: 29-35.
Falconer DS (1981) Introduction to quantitative genetics. Longman, London, 340p.
Hansche PE (1983) Response to selection. In: Moore JN and Janick J (eds). Methods in fruit breeding. Purdue University Press, West Lafayette, p. 154-171.
Lerner IM (1977) The genetic basis of selection. John Wiley & Sons, New York, 298p.
Rutledge JJ (1974) A scaling which removes bias of Abeywardena’s estimator of repeatability. Journal Genetics 61: 247-254.