HAL Id: hal-02143827
https://hal-amu.archives-ouvertes.fr/hal-02143827
Submitted on 19 Jun 2019
HAL is a multi-disciplinary open access archive for the deposit and dissemination of sci-entific research documents, whether they are pub-lished or not. The documents may come from
L’archive ouverte pluridisciplinaire HAL, est destinée au dépôt et à la diffusion de documents scientifiques de niveau recherche, publiés ou non, émanant des établissements d’enseignement et de
Laboratory-scale experimental and modelling
investigations of 222Rn profiles in chemically
heterogeneous LNAPL contaminated vadose zones
Grégory J.V. Cohen, Isabelle Bernachot, Danyang Su, Patrick Höhener, K.
Ulrich Mayer, Olivier Atteia
To cite this version:
Grégory J.V. Cohen, Isabelle Bernachot, Danyang Su, Patrick Höhener, K. Ulrich Mayer, et al.. Laboratory-scale experimental and modelling investigations of 222Rn profiles in chemically hetero-geneous LNAPL contaminated vadose zones. Science of the Total Environment, Elsevier, 2019, 681, pp.456-466. �10.1016/j.scitotenv.2019.05.023�. �hal-02143827�
HAL Id: hal-02143827
https://hal-amu.archives-ouvertes.fr/hal-02143827
Submitted on 19 Jun 2019
HAL is a multi-disciplinary open access archive for the deposit and dissemination of sci-entific research documents, whether they are pub-lished or not. The documents may come from teaching and research institutions in France or abroad, or from public or private research centers.
L’archive ouverte pluridisciplinaire HAL, est destinée au dépôt et à la diffusion de documents scientifiques de niveau recherche, publiés ou non, émanant des établissements d’enseignement et de recherche français ou étrangers, des laboratoires publics ou privés.
Laboratory-scale experimental and modelling
investigations of 222Rn profiles in chemically
heterogeneous LNAPL contaminated vadose zones
Grégory J.V. Cohen, Isabelle Bernachot, Danyang Su, Patrick Höhener, K.
Ulrich Mayer, Olivier Atteia
To cite this version:
Grégory J.V. Cohen, Isabelle Bernachot, Danyang Su, Patrick Höhener, K. Ulrich Mayer, et al.. Laboratory-scale experimental and modelling investigations of 222Rn profiles in chemically hetero-geneous LNAPL contaminated vadose zones. Science of the Total Environment, Elsevier, 2019, 681, pp.456-466. �10.1016/j.scitotenv.2019.05.023�. �hal-02143827�
Laboratory-scale experimental and modelling investigations of
222Rn profiles in
chemically heterogeneous LNAPL contaminated vadose zones
Grégory Cohen1*, Isabelle Bernachot1, Danyang Su3, Patrick Höhener2, Klaus Ulrich Mayer3, Olivier Atteia1
1 EA 4592 G&E, Bordeaux INP - Université Bordeaux Montaigne - Carnot ISIFoR, 1 allée F. Daguin, 33607 Pessac, France
2 Aix-Marseille Université - CNRS, Laboratoire Chimie Environnement UMR 7376, 3 place Victor Hugo, 13331 Marseille,
France
3 University of British Columbia, Department of Earth, Ocean and Atmospheric Sciences, Vancouver, British Columbia, Canada
*corresponding author: gregory.cohen@ipb.fr
Abstract
The potential of LNAPL delineation by 222Rn soil-gas monitoring in a chemically heterogeneous vadose zone was investigated in this study based on laboratory (batch and columns) experiments and numerical modeling. An enhanced version of the MIN3P reactive transport code was used to simulate Rn transport in both uncontaminated and NAPL-contaminated vadose zones and results were validated against analytical solutions and laboratory experiments. Results show that 222Rn activity profiles are mainly controlled by porous media 222Rn production, vadose zone fluid saturations and especially the type and distribution of NAPL in contaminated areas. The results also show that decreases in 222Rn activity and variations in activity gradients provide evidence for the presence and saturation of NAPL. This study demonstrates that LNAPL delineation via 222Rn gas surveys at contaminated sites works best, if gas measurements extend as deep as possible and include regions where 222Rn activity decreases due to elevated NAPL. In addition, collection and analysis of depth-discrete gas samples allows the characterization of vertical NAPL distribution based on the 222Rn activity gradient. The determination of 222Rn production in the unsaturated zone, as well as water capillary pressure curves are of key importance in enabling the discrimination of an uncontaminated
1. Introduction
Contamination of soils and groundwater by Light and/or Dense Non-Aqueous Phases Liquids (L- and D-NAPLs) such as petroleum products or chlorinated solvents is a widespread environmental problem. To develop improved remediation design for contaminated sites, quantification of NAPLs and source zone delineation in the subsurface is crucial. Sampling techniques such as soil cores, bore holes and trenches are commonly used but present considerable difficulties and are expensive (Feenstra et al., 1991; Hunkeler et al., 1997). Less intrusive techniques like soil gas surveys including monitoring of Volatile Organic Compounds (VOCs) provide valuable information on the extent of NAPL source zones in the unsaturated zone, and are usually used as a screening method because of their convenience and low cost (Wilson, 1997). Direct detection of VOCs is; however, only possible when dealing with volatile NAPLs and is thus of no use in the case of contamination with diesel fuel, kerosene or engine oil, for example (Schubert et al., 2005). In addition, direct detection of VOCs does not enable NAPL quantification in the source zone (Hohener and Surbeck, 2004). In recent years, partitioning and interfacial tracers have been assessed to evaluate their capability to estimate both the location and the amount and distribution of NAPLs in the vadose zone (Brusseau et al., 2003; Deeds et al., 1999; Jin et al., 1995; Mariner et al., 1999; Werner, 2002; Werner and Höhener, 2002). However, this method requires the injection of synthetic chemicals as tracers, often associated with high costs and additional environmental concerns.
The use of naturally occurring soil gas which partitions into NAPLs deserves to be evaluated as an alternative option. Over the past two decades, naturally occurring radon-222 (222Rn) gas has been considered as a possible indicator for NAPL localization and quantification in both the vadose zone (Schubert et al., 2007b, 2001) and the saturated zone (Davis et al., 2005; Hunkeler et al., 1997; Semprini et al., 2000). 222Rn is undergoing radioactive decay with a half-life of 3.82 days and is produced by disintegration of radium-226 (Schery et al., 1984). Radium-bearing minerals release 222Rn into the surrounding pore space occupied by gas and/or water. While migrating through soils, 222Rn dissolves into NAPLs, despite being otherwise chemically inert (Hoehn and Von Gunten, 1989; Kimiko Horiuchi et al., 1981; Nazaroff, 1992; Sakoda et al., 2011; Surbeck, 1993; Wong et al., 1992).
The migration of 222Rn in vadose zone can be driven by advection, diffusion or a combination of both (Kristensen et al., 2010; Minkin, 2002; Minkin and Shapovalov, 2016; Richon et al., 2011; Schaefer et al., 1997; Schubert and Schulz, 2002; Wang et al., 2019; Yakovleva and Parovik, 2010). However, unless a significant source of gas (eg. air sparging, soil venting…), advection is a small contributor to gas transport (Molins et al., 2010). Barometric pressure fluctuations can also induce gas advection but over long time intervals, the effect cancels out and this effect is only significant for deep vadose zones and low water content (Atteia and Höhener, 2010; Massmann and Farrier, 1992). Gas advection could also be related to moisture content changes due to precipitation and/or water table fluctuations. However, the timescale of water content changes is slow in relation to the time sale of gas transport, so if there is no entrapment of gas, the effects will be short lived and transport will remain predominately diffusive. Thus, for long term 222Rn migration through unsaturated zone, 222Rn transport is mainly diffusion driven. In homogeneous vadose zones with a uniform radium-226 distribution and decay rates, 222Rn activities measured in soil-gas are then expected to show local decreases in the vicinity of NAPL source areas in comparison with profiles at uncontaminated sites nearby. A 222Rn deficit in soil-gas could therefore be used to localize NAPL contamination as part of a soil gas survey.
Schubert et al. (2007a, 2001) measured 222Rn partitioning coefficients between air, water and NAPL in closed systems; they observed a distinct negative correlation between 222Rn activities in soil gas and NAPL saturation in laboratory column experiments containing NAPL-contaminated sand, demonstrating the applicability of radon gas as an indicator for the quantitative evaluation of the presence and abundance of NAPL in the vadose zone. For different field cases at former gas stations (Barbosa et al., 2014; García-González et al., 2008; Schubert et al., 2007b, 2001), the 222Rn method has been shown effective for delineation of NAPL-contaminated source zones.
However, 222Rn activities in soil gas depend on various parameters including radium content and radon emanation from the soil, soil porosity, moisture content and groundwater level (Mosley et al., 1996; Van Der Spoel et al., 1999). At a contaminated site, 222Rn activities may therefore vary from one location to
chemical soil heterogeneity (Hohener and Surbeck, 2004). Unlike previous contributions, Cohen et al. (2016) did not observe any correlation between LNAPL abundance and 222Rn activities in soil gas due to vadose zone heterogeneities. Höhener and Surbeck (2004) conducted a lysimeter experiment and analytical modelling to assess the applicability of the 222Rn method in heterogeneous soils. These authors concluded that 222Rn constitutes an effective NAPL indicator in the vadose zone, but only at heavily polluted sites with uniform spatial radon production. Höhener and Surbeck (2004) also found that the depth of the NAPL layer has great influence on the 222Rn activity profile and concluded that the utility of the analytical model presented in their study was limited because its applicability is restricted to one-dimensional problems. In addition, analytical models face more challenges for heterogeneous cases. As a result, the development of a numerical model was crucial to help interpret 222Rn behavior in heterogeneous vadose zones.
The aim of the present study is to delineate the limits of the 222Rn gas method to identify LNAPL sources in chemically heterogeneous unsaturated media and to determine the relevant parameters affecting field application of this method, especially in cases with heterogeneous 222Rn production and/or NAPL distribution in the vadose zone. To reach this goal, the MIN3P reactive transport code (Mayer et al., 2002) was enhanced taking into account 222Rn production, phase partitioning and Rn-decay in the gas phase. The model was first verified against analytical solutions and then used to interpret laboratory experiments. Batch experiments were carried out to determine different porous media 222Rn production rates and 222Rn partitioning between gas, water and NAPL (colza oil) phases. Column experiments were conducted to assess 222Rn profiles in uncontaminated and NAPL-contaminated heterogeneous vadose zones. These experimental results were compared to numerical simulation results obtained with the enhanced version of MIN3P, which was also used to investigate the effect of differing NAPL distributions.
2. Material & Methods
2.1 General equations
The transport equation for 222Rn in soil is based on equations for diffusive tracer transport affected by the presence of NAPL and water (Simon and Brusseau, 2007; Werner et al., 2009; Werner and Höhener, 2002).
These equations have been modified to take into account 222Rn in-growth from minerals as well as radioactive decay. Assuming soil gas, soil water and NAPL to be immobile and neglecting adsorption on the solid phase (Nazaroff, 1992; Van Der Spoel et al., 1999), the mass balance for 222Rn for a 1D representative volume in the vadose zone is:
Eq. (1) 𝜕
𝜕𝑡(𝜃𝑔𝐴𝑔+ 𝜃𝑤𝐴𝑤+ 𝜃𝑛𝐴𝑛) = 𝜕2
𝜕𝑥2(𝐷𝑔𝜃𝑔𝐴𝑔+ 𝐷𝑤𝜃𝑤𝐴𝑤+𝐷𝑛𝜃𝑛𝐴𝑛) + 𝑄
where subscripts g, w and n denote for gas, water and NAPL phases, respectively. Ai is the 222Rn activity
(Bq m-3) in phase i and Di is the effective diffusion (m2 s-1) coefficient in phase i: 𝐷𝑖 = 𝜏𝑖𝐷𝑖∗, with τi the
tortuosity (-) and 𝐷𝑖∗ the molecular diffusion coefficient (m2 s-1) in phase i. Q corresponds to the sources and sinks (Bq m-3 s-1) of 222Rn, i.e. in-growth and decay. The remaining terms on the right side of Eq. (1) represent the diffusive fluxes of 222Rn in the gas, water and NAPL phases. The latter term can be ignored, since diffusion in NAPL is very small in comparison with diffusion in the aqueous or gas phases (𝐷𝑤∗, =1.1×10⁻⁹ m2 s-1 and 𝐷
𝑔∗=1.1×10⁻⁵ m2 s-1, (Silker and Kalkwarf, 1983)) due to higher dynamic fluid viscosity and high molecular weight (Grathwohl, 2012).
If decay is described by a single first-order rate constant λ (2.1×10⁻⁶ s-1), Q can be expressed as follows: Eq. (2) 𝑄 = 𝐸𝐶𝑅𝑎𝜆𝜌𝑠(1 − 𝜃𝑡) − 𝜆(𝜃𝑔𝐴𝑔+ 𝜃𝑤𝐴𝑤+ 𝜃𝑛𝐴𝑛)
with E the dimensionless 222Rn emanation coefficient (-), CRa the solid 226Ra content (Bq kg−1), ρs the solid
phase density (kg m-3) and θ
t the total soil porosity (-).
Assuming instantaneous linear equilibrium between gas, water and NAPL phases, the partitioning of radon can be described using the gas-water partitioning coefficient KH (Henry coefficient, Eq. (3)), the
NAPL-gas coefficient (Kn, Eq. (4)) and the NAPL-water partitioning coefficient (Kn-w, Eq. (5)).
Eq. (3) 𝐾𝐻 = 𝐴𝑔 𝐴𝑤 Eq. (4) 𝐾𝑛= 𝐴𝑛 𝐴𝑔
Alternatively, the governing equation for 222Rn diffusive transport in unsaturated soils (Eq. (1)) can be rewritten in terms of 222Rn activity in the gas-filled pores, a quantity that is easily measured:
Eq. (6) 𝜕𝐴𝑔 𝜕𝑡 (1 + 𝜃𝑤 𝐾𝐻𝜃𝑔+ 𝐾𝑛𝜃𝑛 𝜃𝑔 ) = 𝜕2𝐴𝑔 𝜕𝑥2 (𝜏𝑔𝐷𝑔∗+ 𝜏𝑤𝐷𝑤∗ 𝜃𝑤 𝐾𝐻𝜃𝑔) + 𝑆 − (1 + 𝜃𝑤 𝐾𝐻𝜃𝑔+ 𝐾𝑛𝜃𝑛 𝜃𝑔 ) 𝜆𝐴𝑔
where S is the release rate of radon into the gas-filled pore space (kBq m-3 s-1), due to radium decay:
Eq. (7) 𝑆 =𝐸𝐶𝑅𝑎𝜆𝜌𝑠(1−𝜃𝑡) 𝜃𝑔
2.2 Porous media properties
In order to assess the effect of chemical heterogeneity on 222Rn activity profiles in soils, two types of sand were used. These two sands were chosen for their similar transport characteristics (grain-size distribution, porosity) and their theoretically different 222Rn production. Indeed, the first material (MP1) is a purified industrial sand (99% quartz, Gedimat, France) with a 300-600 µm grain size (mean grain size diameter = 466 µm (σ=1.3)), and the second material (MP2) is an alluvial sand from the Aquitaine basin (France) sieved to obtain a 250-710 µm grain size (mean grain size diameter = 392 µm (σ=1.4)).
The water retention characteristics of both sands were measured by observing changes in pore water content in small columns filled with each sand during very slow water level increases. In these experiments, the studied initially dry sand was placed in a cylinder of 8 cm diameter and 85 cm height equipped with four SM-100 Waterscout capacitive probes (Spectrum Technologies, USA) installed at different elevations (20, 24, 26 and 28 cm). The bottom of the cylinder was covered with a cloth filter so that only water can freely enter or leave the sand column. The cylinder was then inserted vertically in a larger column which was progressively filled with water. The sand moisture content measured by the probes was recorded automatically every hour by a Watchdog 1000 station (Spectrum Technologies, USA) while the water level was monitored and successively increased (cm by cm) after equilibration of the measured water contents was reached (3-4 days). These measurements give water contents at different elevations above the water table, allowing the van Genuchten (VG) parameters to be determined using the VG equation (Eq. (8), Van Genuchten (1980)) and the least squares method.
Eq. (8) 𝜃𝑤(ℎ) = 𝜃𝑤𝑟+ (𝜃𝑤𝑠− 𝜃𝑤𝑟)[1 + (𝛼|ℎ|)𝑛]−𝑚
where θwr and θws correspond to the residual and the saturated water contents, respectively; α (m-1), n and
m (unitless) are the soil hydraulic retention parameters with 𝑚 = 1 − 1/𝑛. |ℎ| (m) is the pressure head, equal to the elevation above the steady state groundwater level, i.e. under no-flow conditions.
2.3 Batch experiments
In order to determine porous media 222Rn production (ECRa) and to assess 222Rn gas-NAPL (Kn)
partitioning, batch experiments were performed. A first set of batch experiments was dedicated to the measurements of the 222Rn production of the porous media used in this study. The effect of water content on apparent 222Rn production was also investigated during these experiments. A second set of experiments was dedicated to determine the 222Rn gas-NAPL partitioning coefficient for the NAPL (colza oil) used in this study.
All these experiments were performed using glass bottles sealed with gas-tight pre-perforated rubber stoppers. The gas-tightness of the containers was previously validated with tests conducted to ensure that an overpressure or vacuum of 100 mbar could be maintained for 6 weeks (maximal batch experiment duration). The validation was successful with a variation of less than 2 mbar in both cases. Besides, the gas-tightness of every batch experiment was individually and systematically checked by lowering the pressure using a vacuum pump. The pressure was monitored during 5 minutes to detect any leakage. After leak checking, a syringe needle was inserted in the rubber stopper to restore atmospheric pressure and then removed to allow the batch reactor to re-equilibrate.
Sample of mass ms of dry porous media was first moistened to a desired volumetric water content adding a
mass mw of water and (eventually) contaminated with a mass mn of NAPL before being homogenized and
placed into glass bottles, followed by sealing the bottles with gas-tight pre-perforated rubber stoppers. For the experiments with NAPL, colza oil was chosen because of its non-toxicity, relatively high viscosity and low volatility.
The batch reactors were then left for 25-30 days in the laboratory to reach radioactive equilibrium (defined by steady state conditions between 222Rn production and 222Rn decay in the container) before 222Rn activity measurement. Note that 222Rn radioactive equilibrium can be expected after about 5 half-live times (19 days) in the absence of NAPL, and somewhat earlier in the presence of NAPL (Hunkeler et al., 1997). Once this equilibrium is reached, in the absence of leakage and if diffusion in the sample can be ignored, the 222Rn activity in the free gas volume is homogeneous and equal to (Girault and Perrier, 2012a, 2012b):
Eq. (9) 𝐴 = 1 (1+ 𝜃𝑤 𝐾𝐻𝜃𝑔+ 𝐾𝑛𝜃𝑛 𝜃𝑔 ) 𝑚𝑠 𝑉𝑔𝐸𝐶𝑅𝑎
with Vg the total gas volume (m3) present in the container:
Eq. (10) 𝑉𝑔= 𝑉0− 𝑚𝑠⁄𝜌𝑠− 𝑚𝑤⁄𝜌𝑤− 𝑚𝑛⁄𝜌𝑛
where V0 is the glass bottle volume, ms, mw and mn are solid, water and NAPL mass, respectively, and ρs,
ρw and ρn are the solid, water and NAPL density, respectively.
2.4 Column experiments 2.4.1 Column design
In order to assess 222Rn profiles in uncontaminated and NAPL-contaminated heterogeneous vadose zones, several column experiments were conducted. The experimental column consists of a 2.0 m tall stainless steel pipe with an internal diameter of 0.17 m. Nine stainless steel capillary tubes connected to valves and spaced 20 cm apart were inserted along the column length to sample the soil gas near the column axis. The spacing between the sampling ports was chosen based on the gas volume extracted for measurement (125 mL) and the pore volume affected by gas sampling. The total extracted gas volume is considered negligible in comparison with the total pore gas volume in the column (less than 10% considering an averaged gas content of 0.3). Flexible tubing was connected to the bottom of the column to control the water table.
2.4.2 Experimental configurations
A schematic representation of the column experiments is presented in Figure 1. For the first experiment, without NAPL contamination, the column was filled from 0 m (bottom) to 0.12 m with MP2 sand completely saturated with water. Above 0.12 m, MP2 sand prepared with a volumetric water content of 0.05 was added, up to an elevation of 0.90 m. The remaining space (0.90 to 1.90 m) was packed with MP1 sand, also moistened to a volumetric water content of 0.05. The top of the column was left open to the atmosphere.
For the second experiment with the presence of NAPL, the same colza oil as in the batch experiments was mixed with MP2 prior to the filling process at a volumetric NAPL content of 0.2, while retaining a water content of 0.05. The NAPL-containing sand was then emplaced between 0.30 m and 0.90 m elevation with an otherwise identical porous medium configuration as described before.
For both experiments, the column was packed gradually with layers of 10-15 cm to obtain near-homogeneous packing (porosity after packing was about 0.38±0.02). After column packing, redistribution of liquids occurred within the column, leading to water flow through the tube at the bottom of the column during a few days. This drainage event had a weak influence on both experiments since (i) the water table was fixed by the tube height for the first experiment (without NAPL) and (ii) the distribution of liquid contents were measured after completion of the experiment with NAPL (cf. below).
Vertical profiles of 222Rn activity in the soil gas were measured after an equilibration period of 3-4 weeks, starting with the upper valve and continuing until reaching the deepest valve at the base of the column.
Figure 1: Schematic presentation of the experimental columns (MP1: industrial sand; MP2: alluvial sand, fully saturated with water at the base of the column up to 12 cm height) without (left) and with (right) NAPL (colza oil).
2.4.3 Column deconstruction: Measurement of water and NAPL contents
After termination of the experiment with NAPL, the column was placed in horizontal position and 100 g sand samples were recovered in 0.10 m long sections using a 5 cm diameter corer, starting from the bottom of the column. Water and NAPL content were determined using the loss on ignition method (Rodier et al., 2009). About 30 g of soil samples were first dried at 105°C during 24 h to determine water content, and then heated to 525°C during 4 h to determine NAPL content. After each heating step, the sample mass was measured after cooling down to room temperature. Weighing was performed in a desiccator containing activated silica gel to avoid sample re-humidification.
2.5 222Rn activity determination
The soil-gas was extracted in 125 cm3 scintillation flasks (Algade, France) under vacuum using a steel needle linked to a valve. Upon completion of sampling, the flask was immediately inserted in the counter
chamber of a portable alpha counter (CAPP2, Algade, France) and kept in the dark for about 3 h, the necessary time for the radon to reach radioactive equilibrium with its decay products (Girault and Perrier, 2012a). After radioactive equilibrium was reached, 222Rn activity in each flask was determined three times with counting times of 20 min. Blank values previously measured on the same flask under the same counting conditions were subtracted, and the radon activity expressed in Bq m-3 was obtained using a previously established calibration. To eliminate systematic errors introduced by using different flasks, the individual properties of each flask were taken into account, based on the background values measured before analysis. For batch experiments results, 222Rn activity were readjusted taking account of pressure modification due to gas extraction from a closed system.
2.6 Modelling
Modeling of 222Rn activity profiles in the column experiments was conducted with MIN3P, a general purpose flow and reactive transport code for variably saturated media (Mayer et al., 2002; Molins and Mayer, 2007). For the current work, the code was enhanced to take into account radon production, dissolution of radon into NAPL, and radon decay in the gas and NAPL phases. The verification of the code enhancements against analytical solutions is presented in the SI. Figure 2 presents the water, NAPL and gas phase distributions in a vadose zone system, and its conceptualization in the MIN3P code. Since MIN3P is not a multiphase flow code, NAPL is treated similar to a solid immobile phase, leading to a decrease in porosity in the presence of NAPL. In the model, total porosity consists only of water and gas-filled porosity. In the absence of advective transport processes, this simplification does not introduce any errors, and adequately accounts for NAPL, water and fluid contents in the medium with appropriate water saturation modification. The absence of NAPL-gas contact is also not important, since all partitioning is assumed at equilibrium. The mass conservation for radon in the vadose zone is expressed according to Eq. (1), as described above. 222Rn production by minerals and decay in gas, water and NAPL phases are treated as kinetically-controlled reactions.
Figure 2: Phase distribution in experiment (left) and MIN3P conceptualization with Rn partitioning between the different phases (right) in the presence of a NAPL (approximated as an immobile solid phase). 222Rn
w is produced from radium decay represented
by the Rns solid subject to zero order kinetics. The partitioning of radon is described using the gas-water partitioning coefficient
KH (Henry coefficient, Eq. (3)), and the NAPL-water partitioning coefficient (Kn-w, Eq. (5))
The vadose zone was described using a 1D-model accounting for the different porous media layers, as in the column experiments. The van Genuchten parameters (α, m and n) were taken from previous experiments conducted in this study for characterization of water retention. In the NAPL zone, the porosity and water residual saturation were specified according to loss on ignition results. Care was taken to represent the contents of the gas, water and NAPL phases to ensure that diffusive transport and phase partitioning was described adequately. The Millington and Quirk (1961) formulation was used to estimate tortuosity and effective diffusion coefficients both for the aqueous (Eq. (11)) and gas (Eq. (12)) phases.
Eq. (11) 𝜏𝑤 = 𝜃𝑤 10/3 𝜃𝑡2 ⁄ Eq. (12) 𝜏𝑔= 𝜃𝑔 10/3 𝜃𝑡2 ⁄
Concerning boundary conditions, all sides of the column were treated as impermeable boundaries except the top side which was considered open to an atmosphere with constant concentrations for gases, leading to a first type boundary condition (Dirichlet). From this boundary layer, gases are allowed to diffuse into the soil or out of the soil (in the gas phase).
3. Results and discussion
3.1 Porous media characteristics 3.1.1 Van Genuchten parameters
The capillary pressure curves of the porous media are presented in Figure 3 showing experimental as well as simulated results for MP1 and MP2. The best fitting VG parameters are α = 50 m-1, n = 3.1 and m = 0.7 and α = 80 m-1, n = 2.7 and m = 0.6, for MP1 and MP2, respectively. It can be seen on Figure 3 that these water retention curves are very similar for both porous media, which can be explained by their similar grain size distributions. The VG parameters obtained here appear to be in the range of the van Genuchten parameters obtained by others for sands (Atteia and Höhener, 2010; Zeng et al., 2012).
Figure 3: Experimental (symbols) and simulated (lines) capillary pressure curves for MP1 and MP2 sands.
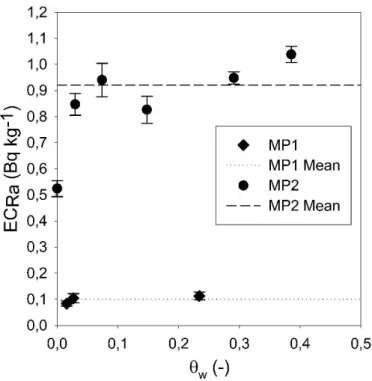
3.1.2 Porous media 222Rn production
The results of the batch experiments dedicated to the measurement of 222Rn production (ECRa) for MP1 and
0.85 ± 0.06 Bq kg-1 when only a small amount of water was added (θ
w=0.03). The ECRa of MP2 remains
then relatively stable for larger water contents, with an average production of 0.92 ± 0.08 Bq kg-1. Concerning MP1, ECRa stabilizes at 0.10 ± 0.01 Bq kg-1 with less variations than MP2. Because of its lower
production and the low 222Rn device sensitivity, an ECRa increase as a function of water content was not
detected for MP1. The lower ECRa of MP1 can be explained by the composition of the sand which consists
of 99% quartz, whereas the alluvial sand is composed of different mineral fractions including radium-bearing minerals.
The mechanism for how water content affects the radon emanation is only partly understood and has been reviewed by Tanner (1980). It can be stated that in a dry porous medium a fraction of radon atoms that escape from a grain due to recoil enters in another grain. Since the recoil range in water is much smaller than in air (0.1 and 63 µm, respectively), addition of water into the pore space inhibits this mechanism (Nazaroff, 1992). This process is likely responsible for the measured increase of the ECRa between the dry
sand and the sand at water content of 0.03. At larger water content, the effective radium concentration appears to be relatively constant, with only little variations. Mosley et al. (1996) and Van Der Spoel et al. (1999) also observed small variations of their emanation coefficient with water content but were unable to explain them. Girault and Perrier (2012) obtained relatively stable ECRa and concluded that the effect of
water saturation will not be a concern in most applications. Indeed, for environmental applications, ECRa is
stable enough in the relevant range of moisture contents. These results permitted to calculate with 𝑆 =
𝐸𝐶𝑅𝑎𝜆𝜌𝑠(1−𝜃𝑡)
𝜃𝑔 Eq. (7) the
222Rn production rate for a porosity of 0.38 to 3.2×10⁻⁴ Bq m-3 s-1 and 3.2×10⁻³ Bq m -3 s-1, for MP1 and MP2, respectively.
Figure 4: 222Rn production (EC
Ra) for MP1 and MP2 depending on porous media water content. The lines correspond to
averaged ECRa (excluding dry value for MP2).
3.1.3 NAPL-gas partition coefficient (Kn) determination
The results of the 222Rn activity measurements from batch experiments with various NAPL contents are presented in Figure 5. Because of (i) MP1 222Rn lower production, (ii) the low 222Rn device sensitivity and (iii) the presence of NAPL contamination exclusively in MP2, these experiments were only conducted with MP2. As for 222Rn production, Figure 5 presents results relative to volumetric fluid contents, in this case NAPL. For the uncontaminated sand (θn=0), a 222Rn activity of 1625 ± 14 Bq m-3 was measured which is
slightly below what was expected (1652 Bq m-3) considering batch experiment design and ECRa provided
by 222Rn production experiments. Increasing the volumetric NAPL content θn caused 222Rn activity to
significantly decrease, until a value of 800 ± 44 Bq m-3 was obtained for the highest NAPL content (θn=0.25). Figure 5 also presents theoretical 222Rn activities calculated for different NAPL contents with
Eq. (9) and a Kn value of 5.17 obtained with a least squares method to fit experimental data. The obtained
Kn value allows to calculate a NAPL-water partitioning coefficient Kn-w=22.7 according to the relation given
fitting curve. The obtained value is in good accordance with partitioning coefficients found in the literature for colza oil (Clever, 1979).
Figure 5: Experimental (symbols) and simulated (line) 222Rn activity in batch experiments for the alluvial sand MP2 (θ
w=0.05)
as a function of volumetric NAPL content (θn). Simulated 222Rn activities were calculated using Eq. (9) with ECRa=0.92 Bq kg
-1 and K
n=5.17. Dotted lines represent errors of 15% in the gas-NAPL partitioning coefficient
3.2 Column experiments 3.2.1 Without NAPL
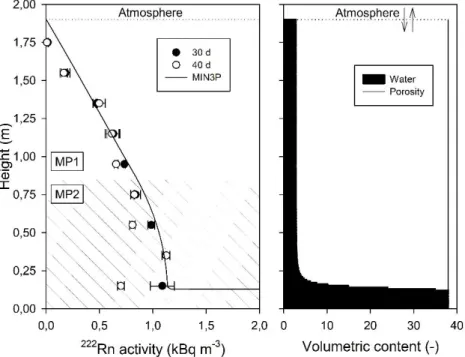
Figure 6 presents the measured pore gas 222Rn activities and water content as a function of elevation. Filled and open symbols correspond to measurements made after 30 and 40 days, respectively. The black line corresponds to MIN3P results and the horizontal dashed line corresponds to the porous medium-atmosphere interface. 222Rn measurements from different sampling times are similar, especially in the upper part of the column, and vary between 0.02 and 1.13 kBq m-3. Different 222Rn activity values were obtained at 0.15 m and 0.50 m at 30 and 40 days. These variations may be due to the presence of water in greater quantity, especially at the lowest sampling port, which may have affected gas sampling. The highest 222Rn activities are measured at the base of the column, below 0.4 m height (222Rn =1.13 ± 0.17 kBq m-3). These high 222Rn activities are observed in the alluvial sand MP2 which is characterized, according to results from the batch
experiments, by a relatively high ECRa (≈0.92 Bq kg-1) in comparison to the industrial sand MP1
(≈0.10 Bq kg-1). The measured 222Rn activity profile show a progressive decrease with increasing elevation due to diffusive gas diffusive transport towards the top of the column, which was left open to atmosphere.
Figure 6: Experimental (symbols) and modelling (lines) results of 222Rn activities (left) and water content (right) in the column
experiment without NAPL. From 0 to 0.90 m elevation, the column was filled with alluvial sand (MP2) and from 0.90 to 1.9 m with purified industrial sand (MP1).
The MIN3P model (model parameters in SI) was set up to reproduce the results from the column experiments as closely as possible, while honoring literature and experimental data, including porous media thickness, water level, and porous media 222Rn production.
It can be seen on Figure 6 that experimental and modelling results are in very good agreement, providing confidence in the conceptual model for the uncontaminated configuration. The sample collected from the uppermost sampling port (1.75 m) may have entrained ambient air free of Rn because of its low burial thickness and could explain the model overestimation of 222Rn activity at the top of the column. The mismatch could also be linked to a lower water content near the porous media-atmosphere interface due to
top of the column looked dryer than the rest of the porous medium during column deconstruction. Water content was not measured in situ for this experiment, and some minor water remobilization may have occurred in the column because of an initial moisture value slightly higher than the residual water content of the sands. Indeed, the water level in the flexible tube connected to the base of the column increased after column filling, probably due to gravity-induced drainage and/or compaction of the column content during filling. However, the water level was stabilized at 0.12 ± 0.01 m at least two weeks before gas sampling.
3.2.2 With NAPL
Figure 7 presents the measured soil-gas 222Rn activities and measured liquid contents as a function of elevation. Grey and black symbols correspond to 222Rn gas measurements made after 20 and 30 days, respectively. The continuous and dotted black lines correspond to NAPL-contaminated and uncontaminated MIN3P simulations results, respectively, and the horizontal dashed line corresponds to the porous medium-atmosphere interface. 222Rn activity values are similar for samples collected after 20 days and 30 days of the experiment. Gas sampling was not possible below 0.50 m elevation because of the presence of substantial oil contents, preventing proper gas sampling. The 222Rn activity profile significantly differs from the measured profile without the NAPL contaminated sand layer indicating the effect of 222Rn partitioning into NAPL. Indeed, at 0.55 m height, averaged experimental 222Rn activity decreases from 0.90 to 0.79 kBq m-3 for the uncontaminated and the NAPL contaminated case; respectively, with more pronounced decreases from 0.62 to 0.37 kBq m-3 at 1.15 m height.
Figure 7 also shows that a significant fluid redistribution has occurred during the time period between the setup of the column and its dismantling, especially for NAPL. Indeed, the colza oil was added to the MP2 sand to reach an initial θn of 0.20, which corresponds to a value greater than the value at which a NAPL
phase can be considered as immobile in soils (Mercer and Cohen, 1990). Thus, MIN3P modelling was conducted using water and NAPL contents measured after column deconstruction (Model parameters in SI), representing equilibrium phase contents.
conceptual model for the contaminated configuration. Both experimental and modelling results clearly show the influence of the NAPL layer on 222Rn activity profile. In the NAPL layer with the highest saturations (<0.5 m height), simulated 222Rn gas activity is much lower (up to 34 %) than in the uncontaminated case due to 222Rn partitioning into NAPL. When NAPL saturation decreases (0.5-0.90 m height), simulated 222Rn activities in MP2 are still lower (by about 33-42 %) than for the uncontaminated case. Just above the interface between the two different sands (h=0.95 m), simulated 222Rn activity remains about 42% lower than for uncontaminated case, decreasing from 0.81 kBq m-3 to 0.47 kBq m-3. The consistently lower 222Rn activities along the entire column is related to the fact that 222Rn is mainly produced in the MP2 porous medium, where it is retained in the NAPL. This in turn induces lower 222Rn activities in the MP1 layer and a lower 222Rn activity gradient.
Figure 7: Experimental (symbols) and modelling (lines) results of 222Rn activities (left) and measured liquid contents (right) in
NAPL present between 0.05 and 0.90 m. The upper section of the column from 0.90 to 1.90 m was filled with uncontaminated industrial sand (MP1).
3.3 Influence of NAPL distribution on 222Rn activity profile
In order to investigate the influence of NAPL distribution on 222Rn profiles, numerical simulations were conducted with four different NAPL distribution configurations presented in Figure 8. For these different NAPL distributions, the same design as for the column experiments (2 similar sands with different 222Rn production rates) was used and the same total amount of NAPL was used in all configurations. The first configuration (Case 1) consists of a homogeneous NAPL layer occupying the entire water-free porosity (n=0.37) over a thickness of 50 cm. The second realization (Case 2) is closer to the experimental
configuration of the NAPL-contaminated column, containing a NAPL content of 0.25 over a thickness of 74 cm. The third (Case 3) and fourth (Case 4) realizations contain a residual NAPL content (n=0.12) across
15 and 52 cm sections of the columns, respectively, located above a fully NAPL saturated NAPL layer (45 and 33 cm in thickness, respectively). In order to observe 222Rn decreases representative of field conditions, a partitioning coefficient for Diesel fuel-water (Kn-w=60) was used for these simulations (Baskaran, 2016;
Figure 8: Configuration of NAPL distribution for scenario analysis. Case 1: a 50 cm thick NAPL layer filling the water-free porosity layer (n=0.37); Case 2: a 74 cm thick NAPL layer (n=0.25) with a gas phase present over the same depth interval
(g=0.12); Case 3: a 15 cm thick residual NAPL layer (n=0.12) above a 45 cm thick NAPL layer filling the water-free porosity
(n=0.37); Case 4: a 52 cm thick residual NAPL layer (n=0.12) above a 33 cm thick NAPL layer filling the water-free porosity
(n=0.37).
Results of the influence of NAPL distribution on 222Rn profiles for heterogeneous aquifers are presented in Figure 9. This figure reveals that the 222Rn activity profile varies strongly depending on NAPL distribution. The lowest decrease in 222Rn activities can be observed for configurations with the NAPL layer filling the water-free porosity completely (case 1 and 3) while the most pronounced decrease in 222Rn activities can be observed for cases with co-existing gas and NAPL phases (cases 2 and 4). These simulations indicate that NAPL distribution has a substantial influence on the 222Rn activity profile, with more substantial activity decreases for unsaturated conditions, i.e. in the presence of a gas phase that reaches into the contaminated region. Indeed, the presence of residual NAPL (cases 2 and 4) induces a lower 222Rn activity gradient than under fully saturated conditions (cases 1 and 3). These results suggest that the presence of
thickness, which is in accordance with conclusions by Höhener and Surbeck (2004). The identification of a NAPL layer via a gas survey is; however, more difficult if the NAPL layer fills the entire water-free pore space (case 1). Indeed, in comparison to the uncontaminated case, the 222Rn activity at 50 cm depth is lowered by 40% for the case with a discrete NAPL layer filling all water-free pore space (case 1), while it is reduced by 49%, 65% and 67% in presence of a layer that contains both gas and NAPL of 15, 52 and 74 cm thickness (Case 3, 4 and 2), respectively.
Figure 9: Results for 222Rn activity profiles for different NAPL distributions in porous media with heterogeneous 222Rn
production.
In order to determine if these findings translate to situations with 222Rn production in homogeneous aquifers, the same numerical simulations were conducted with a homogeneous aquifer configuration, based on the properties of the sand with the highest 222Rn production (MP2). The results of these simulations are presented in Figure 10. Simulation results confirm that the same conclusions are obtained as for 222Rn production in heterogeneous porous media. However, because the 222Rn production is high throughout the entire unsaturated zone, the activity decrease of 222Rn at 50 cm depth relative to an uncontaminated case is
more difficult to observe than for 222Rn production under heterogeneous conditions (MP2 below MP1). Under homogeneous conditions, activities decrease by 19, 36, 28 and 40% for cases 1, 2, 3 and 4, respectively. For example, at 1 m depth, the activity decrease is of 26, 49, 39 and 56% for cases 1, 2, 3 and 4, respectively. This comparison analysis illustrates the importance of collecting gas samples as deep as possible to facilitate the detection of NAPL.
Figure 10: Results for 222Rn activity profiles for different NAPL distributions in porous media with homogeneous 222Rn
4. Conclusion
This study demonstrates that NAPL delineation by 222Rn soils gas monitoring in chemically heterogeneous unsaturated media is possible. Results show that the activity profile of 222Rn is mainly controlled by the rate of 222Rn production of the porous media, by vadose zone fluid saturations and especially the type of NAPL and its distribution in the contaminated regions. The relative decrease of 222Rn activity and the gradient of 222Rn activity towards the ground surface can provide valuable information on the presence of NAPL and its saturations. Soil-gas measurements should be performed as deep as possible and gas analyses should be conducted at several depths at a contaminated site to allow a more straightforward detection of the 222Rn activity decrease and a better characterization of NAPL distributions and saturations. The use of a suitable numerical model to delineate a NAPL contaminated area as well as the vertical NAPL distribution at a field site can be a great advantage for the interpretation of soil-gas 222Rn data, if the most relevant site parameters (rate of 222Rn production, porosities, capillary pressure curves and NAPL contaminant properties) are known or are experimentally determined. The results of this study also build confidence in the conceptual model of 222Rn fate and transport at pristine and contaminated sites and verified the accuracy and utility of the enhanced MIN3P reactive transport code.. Future studies should be carried out to evaluate the potential of this modeling method to aid in the interpretation of 222Rn soil vapor intrusion.
References
Atteia, O., Höhener, P., 2010. Semianalytical model predicting transfer of volatile pollutants from groundwater to the soil surface. Environ. Sci. Technol. 44, 6228–6232.
Barbosa, E.Q., Galhardi, J.A., Bonotto, D.M., 2014. The use of radon (Rn-222) and volatile organic compounds in monitoring soil gas to localize NAPL contamination at a gas station in Rio Claro, São Paulo State, Brazil. Radiat. Meas. 66, 1–4.
Baskaran, M., 2016. Radon: A Tracer for Geological, Geophysical and Geochemical Studies. Springer. https://doi.org/10.1007/978-3-319-21329-3
Brusseau, M.L., Nelson, N.T., Costanza-Robinson, M.S., 2003. Partitioning tracer tests for characterizing immiscible-fluid saturations and interfacial areas in the vadose zone. Vadose Zo. J. 2, 138–147. Clever, H.L., 1979. Krypton, Xenon and Radon, Solubility Data Series.
Cohen, G.J. V, Jousse, F., Luze, N., Höhener, P., Atteia, O., 2016. LNAPL source zone delineation using soil gases in a heterogeneous silty-sand aquifer. J. Contam. Hydrol. 192, 20–34.
Davis, B.M., Istok, J.D., Semprini, L., 2005. Numerical simulations of radon as an in situ partitioning tracer for quantifying NAPL contamination using push-pull tests. J. Contam. Hydrol. 78, 87–103. https://doi.org/10.1016/j.jconhyd.2005.03.003
Deeds, N.E., Pope, G.A., McKinney, D.C., 1999. Vadose zone characterization at a contaminated field site using partitioning interwell tracer technology. Environ. Sci. Technol. 33, 2745–2751.
Feenstra, S., Mackay, D.M., Cherry, J.A., 1991. A method for assessing residual NAPL based on organic chemical concentrations in soil samples. Groundw. Monit. Remediat. 11, 128–136.
García-González, J.E., Ortega, M.F., Chacón, E., Mazadiego, L.F., Miguel, E. De, 2008. Field validation of radon monitoring as a screening methodology for NAPL-contaminated sites. Appl. Geochemistry
Girault, F., Perrier, F., 2012a. Measuring effective radium concentration with large numbers of samples. Part I - experimental method and uncertainties. J. Environ. Radioact. 113, 177–188. https://doi.org/10.1016/j.jenvrad.2012.06.006
Girault, F., Perrier, F., 2012b. Measuring effective radium concentration with large numbers of samples. Part II--general properties and representativity. J. Environ. Radioact. 113, 189–202.
Grathwohl, P., 2012. Diffusion in natural porous media: contaminant transport, sorption/desorption and dissolution kinetics. Springer Science & Business Media.
Hoehn, E., Von Gunten, H.R., 1989. Radon in groundwater: A tool to assess infiltration from surface waters to aquifers. Water Resour. Res. 25, 1795–1803. https://doi.org/10.1029/WR025i008p01795
Hohener, P., Surbeck, H., 2004. Radon-222 as a tracer for nonaqueous phase liquid in the vadose zone: Experiments and analytical model. Vadose Zo. J. 3, 1276–1285. https://doi.org/10.2136/vzj2004.1276 Hunkeler, D., Hoehn, E., Hohener, P., Zeyer, J., 1997. Rn-222 as a partitioning tracer to detest diesel fuel contamination in aquifers: Laboratory study and field observations. Environ. Sci. Technol. 31, 3180– 3187. https://doi.org/DOI 10.1021/es970163w
Jin, M., Delshad, M., Dwarakanath, V., McKinney, D.C., Pope, G.A., Sepehrnoori, K., Tilburg, C.E., Jackson, R.E., 1995. Partitioning tracer test for detection, estimation, and remediation performance assessment of subsurface nonaqueous phase liquids. Water Resour. Res. 31, 1201–1211.
Kimiko Horiuchi, Yukio Murakami, Horiuchi, K., Murakami, Y., 1981. A new procedure for the determination of radium in water by extraction of radon and application of integral counting with a liquid scintillation counter. Int. J. Appl. Radiat. Isot. 32, 291–294. https://doi.org/10.1016/0020-708X(81)90088-0
Kristensen, A.H., Thorbjørn, A., Jensen, M.P., Pedersen, M., Moldrup, P., 2010. Gas-phase diffusivity and tortuosity of structured soils. J. Contam. Hydrol. 115, 26–33.
test for nonaqueous phase liquid and water residual. Environ. Sci. Technol. 33, 2825–2828.
Massmann, J., Farrier, D.F., 1992. Effects of atmospheric pressures on gas transport in the vadose zone. Water Resour. Res. 28, 777–791.
Mayer, K.U., Frind, E.O., Blowes, D.W., 2002. Multicomponent reactive transport modeling in variably saturated porous media using a generalized formulation for kinetically controlled reactions. Water Resour. Res. 38, 13-1-13–21. https://doi.org/10.1029/2001WR000862
Mercer, J.W., Cohen, R.M., 1990. A review of immiscible fluids in the subsurface: properties, models, characterization and remediation. J. Contam. Hydrol. 6, 107–163.
Millington, R.J., Quirk, J.P., 1961. Permeability of porous solids. Trans. Faraday Soc. 57, 1200–1207. Minkin, L., 2002. Is diffusion, thermodiffusion, or advection a primary mechanism of indoor radon entry?
Radiat. Prot. Dosimetry 102, 153–161.
Minkin, L., Shapovalov, A.S., 2016. Thermo-diffusional radon waves in soils. Sci. Total Environ. 565, 1– 7.
Molins, S., Mayer, K.U., 2007. Coupling between geochemical reactions and multicomponent gas and solute transport in unsaturated media: A reactive transport modeling study. Water Resour. Res. 43. Molins, S., Mayer, K.U., Amos, R.T., Bekins, B.A., 2010. Vadose zone attenuation of organic compounds
at a crude oil spill site - interactions between biogeochemical reactions and multicomponent gas transport. J. Contam. Hydrol. 112, 15–29.
Mosley, R.B., Menetrez, M.Y., Snoddy, R., Brubaker, S.A., Brubaker Jr, S.A., 1996. The influences of diffusion and advective flow on the distribution of radon activity within USEPA’s soil chamber. Environ. Int. 22, 521–533. https://doi.org/10.1016/S0160-4120(96)00154-7
Richon, P., Perrier, F., Koirala, B.P., Girault, F., Bhattarai, M., Sapkota, S.N., 2011. Temporal signatures of advective versus diffusive radon transport at a geothermal zone in Central Nepal. J. Environ. Radioact. 102, 88–102.
Rodier, J., Legube, B., Merlet, N., Brunet, R., 2009. L’analyse de l’eau-9e éd.: Eaux naturelles, eaux résiduaires, eau de mer. Dunod.
Sakoda, A., Ishimori, Y., Yamaoka, K., 2011. A comprehensive review of radon emanation measurements for mineral, rock, soil, mill tailing and fly ash. Appl. Radiat. Isot. 69, 1422–1435. https://doi.org/10.1016/j.apradiso.2011.06.009
Schaefer, C.E., Arands, R.R., der Sloot, H.A., Kosson, D.S., 1997. Modeling of the gaseous diffusion coefficient through unsaturated soil systems. J. Contam. Hydrol. 29, 1–21.
Schery, S.D., Gaeddert, D.H., Wilkening, M.H., 1984. Factors affecting exhalation of radon from a gravelly sandy loam. J. Geophys. Res. 89, 7299. https://doi.org/10.1029/JD089iD05p07299
Schubert, M., Freyer, K., Treutler, H.C., Weiß, H., 2001. Using the soil gas radon as an indicator for ground contamination by non-aqueous phase-liquids. J. Soils Sediments 1, 217–222. https://doi.org/10.1007/BF02987728
Schubert, M., Lehmann, K., Paschke, A., 2007a. Determination of radon partition coefficients between water and organic liquids and their utilization for the assessment of subsurface NAPL contamination. Sci. Total Environ. 376, 306–316. https://doi.org/10.1016/j.scitotenv.2006.12.050
Schubert, M., Paschke, A., Lau, S., Geyer, W., Knöller, K., 2007b. Radon as a naturally occurring tracer for the assessment of residual NAPL contamination of aquifers. Environ. Pollut. 145, 920–927. https://doi.org/10.1016/j.envpol.2006.04.029
Schubert, M., Pena, P., Balcazar, M., Meissner, R., Lopez, A., Flores, J.H., 2005. Determination of radon distribution patterns in the upper soil as a tool for the localization of subsurface NAPL contamination. Radiat. Meas. 40, 633–637.
Schubert, M., Schulz, H., 2002. Diurnal radon variations in the upper soil layers and at the soil-air interface related to meteorological parameters. Health Phys. 83, 91–96.
Semprini, L., Hopkins, O.S., Tasker, B.R., 2000. Laboratory , Field and Modeling Studies of Radon-222 as a Natural Tracer for Monitoring NAPL Contamination. Transp. Porous Media 38, 223–240.
Silker, W.B., Kalkwarf, D.R., 1983. Radon diffusion in candidate soils for covering uranium mill tailings. Simon, M.A., Brusseau, M.L., 2007. Analysis of a gas-phase partitioning tracer test conducted in an
unsaturated fractured-clay formation. J. Contam. Hydrol. 90, 146–158. https://doi.org/10.1016/j.jconhyd.2006.09.010
Surbeck, H., 1993. Radon monitoring in soils and water. Nucl. Tracks Radiat. Meas. 22, 463–468.
Tanner, A.B., 1980. Radon migration in the ground: a supplementary review. Nat. Radiat. Environ. III 1, 5–56.
Van Der Spoel, W.H., Van Der Graaf, E.R., De Meijer, R.J., 1999. Diffusive transport of radon in a column of moisturized sand. Health Phys. 77, 163–177. https://doi.org/10.1097/00004032-199908000-00006 Van Genuchten, M.T., 1980. A closed-form equation for predicting the hydraulic conductivity of
unsaturated soils 1. Soil Sci. Soc. Am. J. 44, 892–898.
Wang, Y., Luo, W., Zeng, G., Wang, Y., Yang, H., Wang, M., Zhang, L., Cai, X., Chen, J., Cheng, A., others, 2019. High 222Rn concentrations and dynamics in Shawan Cave, southwest China. J. Environ. Radioact. 199, 16–24.
Werner, D., 2002. Gaseous tracer diffusion from a point source as a site investigation method. Fac. Environ. Nat. Archit. construit.
Werner, D., Höhener, P., 2002. Diffusive partitioning tracer test for nonaqueous phase liquid (NAPL) detection in the vadose zone. Environ. Sci. Technol. 36, 1592–1599.
of nonaqueous phase liquid (NAPL) in the vadose zone: Performance evaluation for heterogeneous NAPL distribution. J. Contam. Hydrol. 108, 54–63. https://doi.org/10.1016/j.jconhyd.2009.05.005 Wilson, D.J., 1997. Soil gas volatile organic compound concentration contours for locating vadose zone
nonaqueous phase liquid contamination. Environ. Monit. Assess. 48, 73–100.
Wong, C.S., Chin, Y.P., Gschwend, P.M., 1992. Sorption of Rn-222 to Natural Sediments. Geochim. Cosmochim. Acta 56, 3923–3932.
Yakovleva, V.S., Parovik, R.I., 2010. Solution of diffusion-advection equation of radon transport in many-layered geological media. Nukleonika 55, 601–606.
Zeng, C., Wang, Q., Zhang, F., 2012. Evaluation of Hydraulic Parameters Obtained by Different Measurement Methods for Heterogeneous Gravel Soil. Terr. Atmos. Ocean. Sci. 23.
Acknowledgments:
The authors would like to thank the Carnot ISIFoR which funded this study and the anonymous reviewers who helped to improve the clarity of this article.