DETERMINATION OF SHEAR WAVE VELOCITIES IN "SLOW" FORMATIONS
byC.H. Cheng and Y.NanToksoz Earth Resources Laboratory ,
Department ofEarthand Planetary Sciences Yassachusetts Institute of Technology
Cambridge. YA 02139
ABSTRACT
Direct determination of formation shear wave travel time is impossible in "slow" formations where the shear wave velocity is lower than the borehole fluid (mud) velocity. However, the Stoneley waves in these formations are very sensitive to changes in formation shear wave properties and can be used to indirectly determine the formation shear velocity, In addition, the P wave packet is highly dependent on the Poisson's ratio and thus can be used to estimate the shear velocity once the P wave velocity is known. These phenomena are demonstrated with both numerical and field examples.
INTRODUCTION
Full waveform acoustic logs have rapidly become a very important set of borehole measurements. In addition to increasing the radius of investigation by having a larger source-receiver offset than the conventional sonic log, full waveform acoustic logs can' provide measurements of formation shear wave velocity and attenuation (Paillet, 1980: Cheng and Toksoz, 1981; Ingram et al.,
1981; Willis and Toksoz. 1982). Direct determination of shear wave travel times is possible only in "fast" or "hard" formations where the shear wave velocities are higher than the mud or borehole fluid velocity. It is impossible to obtain shear wave travel times directly from the full 'waveform acoustic logs in "slow" or "soft" formations, where the shear wave velocities are lower than the mud velocity, because there are no refracted shear wave arrivals. The characteristics of the full waveform acoustic log microseismograms in "slow" or "soft" formations are distinctly different from those in "fast" formations. Specifically, the P wave train appears to be of longer duration, the pseudo-Rayleigh (or normal mode) waves no longer eXist, and the Stoneley waves are more dispersive and are shifted to lower frequencies. In addition, there exists a direct mud arrival under these conditions. This mud arrival can be qulte prominent in situations where the mud attenuation is low (QJ is high) and can easily be misidentified either as a shear wave arrival or the Stoneley wave arrival. At well logging frequencies, the Stoneley wave velocity in a "slow" formation is significantly lower than the well known tube wave velocity, Unlike the case of a "fast" formation, the Stoneley wave velocity in a "slow" fOJ:mation is very sensitive to changes in formation shear wave velocity. Thus, to measure the shear wave velocity in a "slow" formation, one can first obtain the velocity of the Stoneley wave, and then invert for the shear wave velocity using the
dispersion characteristics of the Stoneley wave, This inversion can be done numerically by computer or graphically using a velocity cross-plot, In cases where the Stoneley waves are hard to identify, such as areas of high shear attenuation, or where the frequency response of the tool is insufficiently low, the amplitude and duration of the P wave train will provide an estimate of the Poisson's ratio and, accordingly, the formation shear,wave velocity,
The propagation characteristics of the Stoneley wave in "slow" formations will first be discussed, Velocity cross-plots of Stoneley wave velocity versus formation shear velocity will be presented, as well as the dispersion equation from which the formation shear wave velocity can be solved for a given Stoneley wave velocity, Finally the effects of different formation parameters on full waveform acoustic log microseismograms in "slow" formations will be investigated using both synthetic examples and field data,
PROPAGATION CHARACTERISTICS OF STONEI.EYWAVES
The propagation of Stone ley (or tube) waves in a borehole is a well studied problem Until recently, however, the interest has been in "fast" formations where the shear veiocities are higher than the borehole fiuid velocity, In a "fast" formation, the Stoneley wave is not very dispersive (Biot, 1952; White, 1962; Cheng and Toksi:iz, 1981) and it propagates with a velocity roughiy 0,9 times the borehole fiuid or mud velocity (Cheng and Toksi:iz, 1981), This velocity is generally known as the tube wave velocity (White, 1962), The propagation and dispersion of Stoneley waves have a minimal dependence on formation properties (Cheng and Toksi:iz, 1981), This is most readily seen on a variable density display (or variable area display, or bit plot) of full waveform acoustic log microseismograms as a function of depth, The Stoneley wave in a "fast" formation is a very coherent arrival whereas the P and S wave arrivals may show significant variations with lithology, An example of this from a sandstone/shale sequence is shown in Figure 1.
In a "slow" formation on the other hand, the Stoneley wave is much more dispersive, At well logging frequencies both its phase and group velocities are significantly lower than the tube wave velocity and they are very sensitive to the formation shear wave velocity (Cheng
et
a.l" 1982), In addition, most of the energy of the Stoneley wave is concentrated at lower frequencies, On a variable density display of microseismograms versus depth, the Stoneley wave in a "slow" formation will appear as a broader band than the P wave and will"wiggle" as the lithology changes (Figure 2),
(
(
(
(
Dispersion Equation
The equation for the dispersion of Stoneley waves in a "slow" formation is given by (Biot, 1952: Cheng et al.. 1982):
where c2 1 1 m =k(l--)*=o;( - - -)*. ~2 c2 ~2 ' c2 1 1
f
=k(l--)*=0;(-- -)*: ex.2 c2 ex.2 f t2~2lm
If 1 2/>2Ko(mR)~_
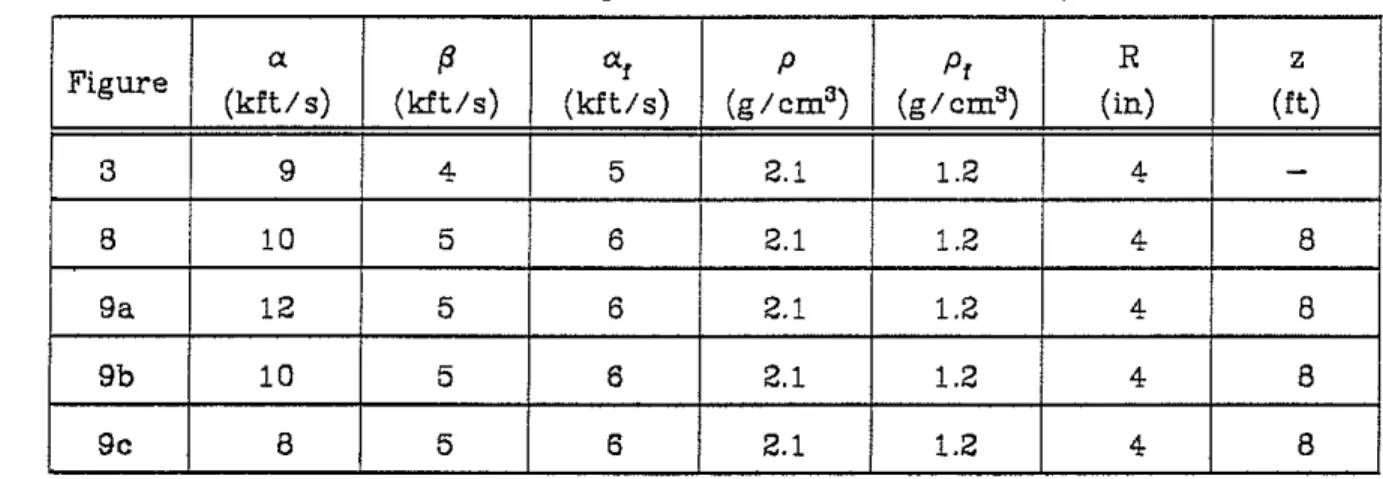
=-...,:.:.:.:. - -+.!::.I:::- _ 0 0;2 mR c2 Kj(mR) (1)0; is the angular frequency: c is the phase velocity of the Stoneley wave: k = 0;/c is the axial wave number; a.~, andat are the P and S wave velocity in the formation and the borehole fluid velocity respectively; R is the borehole radius; p andPf are the formation and fluid density; and I; andK; are the modified Bessel functions of the ith. order. Figure 3 is a plot of the phase and group velocity of Stoneley waves in a "slow" formation as a function of frequency. The parameters used are given in Table 1.
The inverse problem of determining the formation shear wave velocity from observed Stoneley wave velocities can be done easily with equation (1), given the formation and borehole fluid compressional wave velocities and densities, as well as borehole radius. if the Stoneley wave phase veloCity c and the frequency of the Stoneley wave are determined from the full waveform acoustic logs, the formation shear wave velocity can be obtained from equation (1) by using a simple root finder.
Velocity Cross-plots
A more graphic method of examining the dependence of the Stoneley wave velocity on different formation and borehole parameters is through velocity cross-plots (Figures 4-7). The Stoneley wave phase velocity c is plotted agalnst the formation shear wave velocity {3 (both normalized to the borehole fluid velocity af) for eight different values of formation to fluid density ratio at frequencies of 2 kHz (Figure 4a) and 10 kHz (Figure 4b). The radius of the hole is R
=
4 inches. The formation Poisson's ratio (j is constant at 0.25. and theborehole fluid velocity is af
=
5 kft/s. The density ratios are plotted fromp/ Pt=
1.4 to 2.8 at 0.2 intervals. Figure 4 shows that for a given formation shear wave velocity, the Stoneiey wave phase velocity decreases with decreasing density ratio. The decrease is more rapid at the lower frequency (Figure 4a). It is clear from Figure 4 (and subsequent figures) that the Stoneley wave phase velocity is a strong function of formation shear wave velocity. There is aimost a one to one relationship between the two velocities. Cheng et al. (1982) showed that the normalized partial derivative (partition coefficient) of the Stoneleywave phase velocity with respect to the formation shear wave velocity in a "slow" formation is approximately 0.8.
Figure 5 shows the effect of frequency on the Stoneley wave-formation shear wave velocity cross-plot. Results for five different frequencies are plotted: 2 kHz, 5 kHz, 10 kHz, 15 kHz and the high frequency asymptotic limit. The density ratio is taken to be piP, = 2.0. Other parameters are the same as those in Figure 4. For a given formation shear wave velocity, the Stoneley wave phase velocity decreases as a function of increasing frequency. Beyond 10 kHz, there is very little frequency dependence. However, at lower frequencies the Stoneley wave phase velocities show a significant frequency dependence. Since the Stoneley wave in a "slow" formation tends to travel at a lower frequency than the body (P and S) waves (e.g., Figure 2), this frequency dependence must be taken into account when solving for the formation shear wave velocity from the Stoneley wave phase velocity.
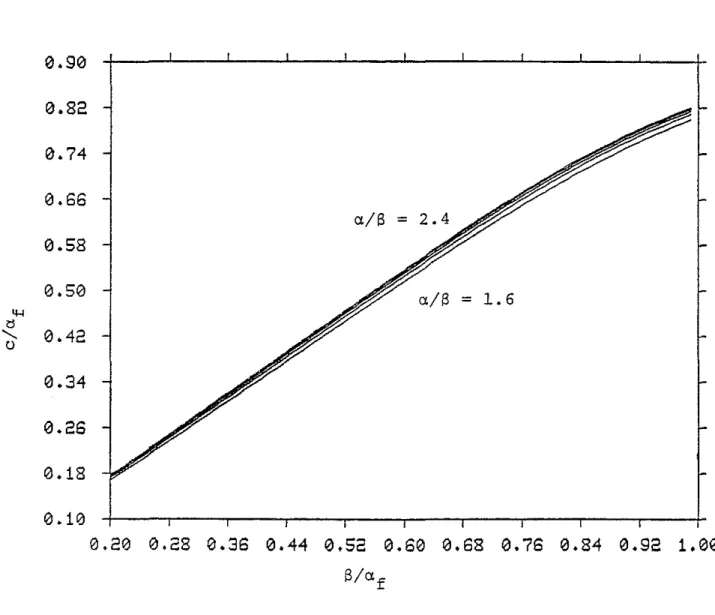
The effect of the formation P to S wave velocity ratio (al(3, roughly proportional to the square root of the Poisson's ratio) on the Stoneley wave-formation shear wave velocity cross-plot is shown in Figure 6. Five values of al{3 are plotted, from al{3
=
1.6 to 2.4 in 0.2 intervals, corresponding to Poisson's ratio (j '" 0.18; 0.28, 0.33, 0.37 and 0.40. The density ratio piP, is 2.0and the frequency is 5 kHz. All other parameters are the same as those in Figure 4. It can be seen from Figure 6 that the Stoneley wave phase velocity has only a weak dependence. on the P to S wave velocity ratio of the formation. Thus, to a first approximation. the effect of the formation P wave velocity can be ignored when estimating the formation shear wave velocity from the Stoneley wave phase velocity.
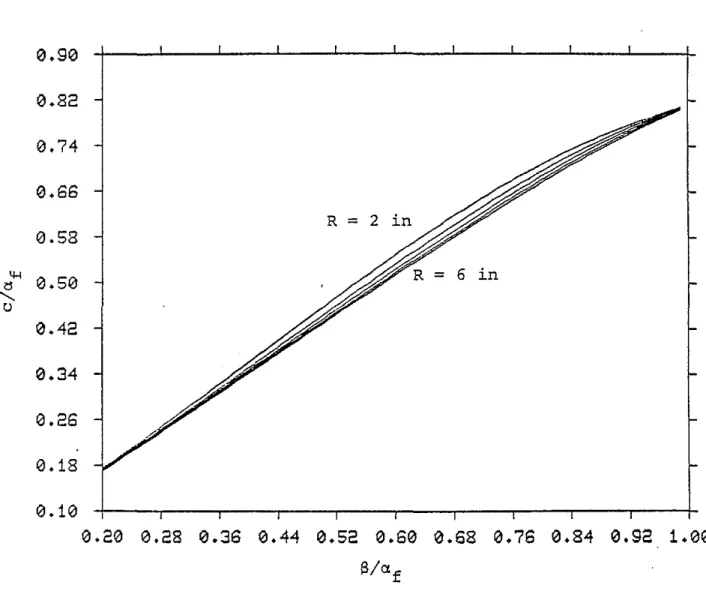
Finally, the effect of borehole radius on the Stone ley wave-formation shear wave velocity cross-plot is shown in Figure 7. The Poisson's ratio is taken to be
(j
=
0.25, with the density ratio piP,=
2.0, and the frequency at 5 kHz. Theother parameters are the same as those in Figure 4. Five values of the borehole radius are plotted, from R
=
2 inches to R=
6 inches, at 1 inch intervals. For a radius of 4 inches or greater, the dependence of the Stoneley wave velocity on the formation shear wave velocity is very weak. Therefore we only need to make a radius correction in the formation shear wave velocity obtained from the Stoneley wave phase velocity if the borehole radius is significantly smaller than 4 inches. Normal variations in borehole radius will not significantly affect the Stoneley wave phase velocity.NUMERICAL AND FIELD EXAMPLES
In this section the effects of in situ attenuation and formation Poisson's ratio on the full waveform acoustic log microseismograms in "slow" formations are demonstrated using synthetic microseismograms generated by the discrete wavenumber summation technique (Bouchon and Aki, 1977; Cheng and Toksoz, 1981; Cheng et al., 1982). A Kelly type source (Kelly et al., 1976) is used, with a center frequency of about 11 kHz. A FIR (finite instantaneous response) bandpass filter with a passband of 5 to 15 kHz is used to simulate the receiver response. A comparison between the synthetic and actual field microseismograrns is presented. ( ( ( ( ( { "
Attenuation
In. situ attenuation has significant infiuence on the observed waveforms of microseismograms. In general, attenuation affects the relative amplitudes of the body and the gUided waves (Cheng and Toksoz, 1981), and reduces the amplitudes of the high frequency components relative to those of the lower frequency components. The synthetic microseismogram in a "slow" formation without attenuation is presented in Figure 8. The formation P wave arrival is easily identified, along with the Stoneley wave arrival. The P wave packet is large in amplitude, relatively monochromatic, and of long duration. The Stoneley wave packet is much lower in frequency and pulse-like. In addition, there is an easily identifiable direct fluid or mud arrival. It is this mud arrival that is easily misidentified as a formation shear arrival, especially in situations where the mud attenuation is low. The proper identification of the low frequency Stoneley wave together with a good measurement of the fluid or mud velocity will make the identification of this mud arrival unambiguous.
Figure 8b shows the synthetic microseismogram in the same formation with attenuation (Qa
=
100, Qp=
50, QJ=
25). As can be expected, the higher frequency P wave packet is reduced in amplitude when compared with the Stoneley wave packet. The direct mud arrival is also significantly reduced in amplitude, although it can still be identified.Poisson's Ratio
In the cases where the Stoneley waves are hard to identify, such as in areas of high shear wave and/or mud attenuation, or where the frequency response of the tool is not low enough, the amplitude and duration of the P wave train will provide an estimate of the Poisson's ratio and hence the formation shear wave velocity. The P wave train consists of P leaky modes that are very dispersive and are bound by the formation and fluid P wave velocities (Paillet, personal communication). The amplitude of the P wave train is roughiy . proportional to the Poisson's ratio of the formation. In Figure 9 synthetic microseismograms of three "slow" formations with difl'erent Poisson's ratios are plotted. All parameters except the formation P wave velocity are held constant. The Stoneley waves do not change significantly in amplitude or arrival time. This is -consistent with the results from the soiution of the period equation previously shown (Figure 6). The P wave train, however, shows significant decrease in both amplitude and duration going from a high Poisson's ratio formation (a/,B
=
2.4, 0'=
0.395, Figure 9a), through an intermediate Poisson'sratio formation (a/,B
=
2.0, 0'=
0.333, Figure 9b), to a low Poisson's ratioformation (a/,B
=
1.6,0'=
0.18, Figure 9c). The same phenomenon was observed by Tsang and Rader (1979) and Cheng and Toksoz (1981) in "fast" formations, though the effect is less dramatic since the P wave packets in "fast" formations are usually much smaller than the gulded (pseudo-Rayleigh and Stoneley) wave packets. At present, the exact analytical relationship between the amplitude of the P wave leaky mode and the formation Poisson's ratio has not been determlned. Nevertheless, from the analysis of synthetic microseismograms, the P wave train is a very good qualitative indicator of the Poisson's ratio of the formation.Field Example
A field example of a full waveform acoustic log micro seismogram in a "slow" formation is shown in Figure lOa. This is the x-y plot of one of the traces shown on the variable density plot· of Figure 2. The formation P wave velocity is approximately 8.7 kft/s, and the formation S wave velocity is apprOXimately 3.5 kft/s, as determined from the Stoneley wave phase velocity. The general waveform shape of the micro seismogram is quite similar to the shapes of the synthetic microseismograms shown earlier. The Stoneley wave is of very low frequency. (~ 2 kHz) and is quite pulse-like. The direct P wave and leaky mode packet is very monochromatic, with a center frequency of approximately 6 kHz. The amplitude of the P wave packet is large compared with the Stoneley wave, the former about 4 to 5 times the latter. There appears to be a recognizable direct fiuid or mud arrival after the P wave packet. On the whole, the character of the micro seismogram is consistent with the prediction from theory.
The synthetiC micro seismogram generated using the formation parameters measured from the field example discussed above is presented in Figure lOb. The source used was a narrow band Tsang and Rader (1979) type source, with a center frequency of 6 kHz. A FIR bandpass filter with a passband of 2 to 10 kHz was also applied to the time series. The synthetic microseismogram shows a good qualitative agreement with the actual field microseismogram, despite the uncertainties in the source and receiver response, and in in situ attenuation.
DISCUSSIONS AND CONCLUSIONS
It is possible to determine the formation shear wave velocity from full waveform acoustic logs in a "slow" or "soft" formation. One method is to determine the formation shear wave velocity from the measured Stoneley wave phase velocity. Given the formation and borehole fiuid compressional wave velocities and densities, as well as borehole radius, the formation shear wave velocity can be obtained from the Stoneley wave phase velocity and frequency by solving the period equation (1). All the necessary parameters, except for the mud velocity0./, are readily obtainable from conventional sonic, ga=a density and caliper logs. Measurement of a/ can be done in the mud pit, although an accurate in situ measurement of a/ in the borehole as a function of depth is preferable.
The Stoneley wave velocity is very sensitive to formation shear wave velocity in a "slow" formation at well logging frequencies. There is almost a one to one correspondence between the formation shear wave and Stoneley wave velocities. Thus, the shear velocity can be determined by either measuring the group velocity of the Stoneley wave from a single trace (e.g. using the Burg algorithm) or by measuring the phase velocity using the moveout between two or more traces. Measuring the moveout eliminates the high uncertainty in the determination of arrival times of low frequency signals and, since the Stoneley wave packet is distinctive and non reverberating, cycle skipping is also minimal in phase velocity determination.
(
(
(
(
The P wave and leaky mode packet is found to be very sensitive to changes in the Poisson's ratio of the formation. The amplitude of the P wave packet relative to the Stoneley wave packet increases with increasing Poisson's ratio. Since the formation P wave velocity is easily determined, the formation S wave velocity can be estimated from the amplitude of the P wave packet.
ACKNOWLEDGEMENTS
This research is supported by the Full Waveform Acoustic Logging Consortium at M.l.T.
TABLE 1-Model parameters used in this study
a (j af P
P
f R z Figure (kft/s) (kft/s) (kftls) (g/cm3) (g/cm3) (in) (ft) 3 9 4 5 2.1 1.2 4 -8 10 5 6 2.1 1.2 4 8 9a 12 5 6 2.1 1.2 4 8 9b 10 5 6 2.1 1.2 4 8 90 8 5 6 2.1 1.2 4 8REFERENCES
Biot, M. A., 1952, Propagation of elastic waves in a cylindrical bore containing a fluid: Jour. of Appl. Phys., v.23, p.977-1005.
Bouchon, M. and Aki, K.. 1977, Discrete wave-number representation of seismic-source wave fields: Bull. Seism. Soc. Am.,v.67, p.259-277.
Cheng, C.H. and Toksoz, M.N., 1981, Elastic wave propagation in a fluid-filled borehole and synthetic acoustic logs: Geophysics,v.46, p.1042-1053.
Cheng, C.H., Toksoz, M.N., and Willis, M.E., 1982, Determination of in situ attenuation from full waveform acoustic logs: J. Geophys. Res., v.87, p.5477-5484.
Ingram, J.D., Morris, C.F., MacKnight, E.E., and Parks, T.W., 1981, Shear velocity logs using direct phase determination: Presented at 51st Annual International Meeting of the Society of Exploration Geophysicists, October 11-15, Los Angeles, CA.
Kelly, K.R .. Ward, RoW., Treitel, S., and Alford, RoM.. 1976, Synthetic seismograms: a finite-difference approach: Geophysics, v.41, p.2-27.
Palllet, F.,. 1980, Acoustic propagation in the vicinity of fractures which· intersect a fluid-fliled borehole: Trans. of 21st Ann. Logging Symp. of Soc. of Prot. Well Log Analysts, Juiy 8-11.
Tsang, L. and Rader, D., 1979, Numerical evaluation of transient acoustic waveform due to a point source in a flUid-filled borehole: Geophysics, v.44,
p.1706-1720.
White, J.E.. 1962, Elastic waves along a cylindrical bore: Geophysics, v.27, p.327-333.
Willis, M.E and Toksoz, M.N., 1982, Automatic P and S velocity determination from full waveform digital acoustic logs: Submitted to Geophysics.
( ( ( ( ( ( (
p
S
Stoneley
:::c
l-e.
w
c
TIME (msec)
Figure 1: Bit plot of full waveform acoustic log micro seismograms from a twenty-foot section of a sandstoneIshale sequence. Note the coherency of the Stoneley wave.
::I:
l-e.
w
c
o
TIME (msec)
5
10
( lFigure 2: Variabie density piot of full waveform acoustic iog micro seismograms in a "siow" formation. Note the disappearance of the S wave arrivai and the variation of the Stoneley wave arrival with lithology.
SOFT SEDIMENT
10
8
STONELEY
Phase
4
6
FREQUENCY (kHz)
2
\
\
\
\
"
"-'-...
"'--...---...Group
- - _
-0.78
>-
0.76
I-()0
-l0.74
u.J>
00.72
u.J N -l <l;0.70
~a:
0
0.68
z
0.66
0
Figure 3: Dispersion characteristics of the Stoneley wave in a "slow" formation. The velocities are normalized to al' .The shear wave velocity in this example is 0.8 x al'
0.90 0.82 0.74 0.66 0.58
...
0.50"
"-u 0.42 0.34 0.26 0.18 0.10 0.20 0.28 0.36 0.44 0.52 0.60 0.68 0.76 0.84 0.92 1.00 ( ( 0.90 0.B2 0.74 0.66 0.58 0.50...
0.42"
"-u 0.34 0.26 0.10 0.20 0.28 0.36 0.44 0.52 0.60 0.68 0.76 0.84 0.92 1.00 a/afFigure 4: Cross-plot between formation shear wave velocity(3 and Stoneley wave phase velocity c as a function of the formation to mud density ratio (piPI)' at
(a) 2 kHz and (b) 10 kHz. The velocities are normaiized to the mud veiocity fJ./.
(
13.913
13.82
13.74
13.66
13.58
...
13.513
<l FREQUENCY LIMIT"-
Cl13.42
13.34
13.26
13.18
13.113
13.213 13.28 13.36 13.44 13.52 13.613 13.68 0.76 13.84 13 •92
1.
ee
S/CL
fFigure 5: Stoneley wave-formation shear wave velocity cross-plot for frequen-cies of 2, 5, 10, 15 kHz and the high frequency asymptotic limit.
( ( (
0.74
0.82
0.90
0.66
0.58
0.10
l0.20
0.28
0.36
0.44
0.52
0.60
0.68
0.76
0.84
0.92
L 00
S/af0.50
....
~"-
()0.42
0.34
0.26
0.18
(Figure 6: Stoneley wave-formation shear wave velocity cross-plot for formation P to S veiocity ratios (a./ (:J) of 1.6 to 2.4 at 0.2 intervals.
0.90
0.82
0.74
0.66
0.58
4-l0.50
<J "-u0.42
0.34
0.26
0.18
0.10
0.200.280.360.440.520.600.680.760.840.921.00
S/Cl
fFigure 7: Stoneley wave-formation shear wave velocity cross-plot for borehole radii R of 2 to 6 inches at 1 inch intervals.
(
1.00
,
,
,
,
,,
,
0.80
- (a) >-pFluid
0.60 -
~0.40
-
f\
Stoneley ~~
0.20
-
~ (0.
>--0.20
-
f--0.40
V
f--0.60
f- (-0.80
~-1.00
•
,
,
0.50 0.75 1.00 1.a5 1.50 1.75 2.00 2.25 2.50 a.75 3.00
( ( StoneleyFluid
p (b)1.00
0.80
0.60
0.40
0.20
-0.20
-0.40
-0.60
-0.80
-1.00
0.50 0.75 1.00 1.25 1.50
1. 75 2.00 a.25 a.50 a.75 3.00
TIME (msec)Figure 8: Synthetic microseismograms in a "slow" formation with (a) no
6 . 0 0 0 1 - - - ' - - - ' - - - - ' - - - ' - - - 1 . - - - 1 - - ' - - - ' - - - ' - - - - + 4.80 (a) 3.60 2.40 1.20 0. 0.75 1.00 1.25 1.50 1.75 2.00 2.25 2.50 2.75 3.00 (b) -1.20 -2.40 -3.S0 -4.80 -S.00el--~--r---r---,---,--.,.--.,._-.,._-.,._-+ 0.50 0.75 1.00 1.25 1.50 1.75 2.00 2.25 2.50 2.75 3.00 0.75 1.00 1.25 1.50 1.75 2.00 2.25 2.50 2.75 3.00 TIME (msec)
Figure 9: Synthetic microseismograms in a "siow" formation with Poisson's ratio r;
=
(a) 0.395, (b) 0.333, and (c) 0.18.(a) ( ( ( ( (
1.50
2.70
3.90
5.10
(b)7.50
(1.50
2.70
3.90
5.10
8.30
7.50
TIME (msec)Figure 10: Comparison between (a) fieid data, and (b) synthetic