HAL Id: hal-01193997
https://hal.archives-ouvertes.fr/hal-01193997
Submitted on 27 May 2020
HAL is a multi-disciplinary open access archive for the deposit and dissemination of sci-entific research documents, whether they are pub-lished or not. The documents may come from teaching and research institutions in France or abroad, or from public or private research centers.
L’archive ouverte pluridisciplinaire HAL, est destinée au dépôt et à la diffusion de documents scientifiques de niveau recherche, publiés ou non, émanant des établissements d’enseignement et de recherche français ou étrangers, des laboratoires publics ou privés.
Bone Growth by Thyroid Hormone
Clémence Desjardin, Cyril Charles, Catherine Benoist-Lasselin, Julie Riviere,
Maïlys Gilles, Olivier Chassande, Caroline Morgenthaler, Denis Laloë, Jerôme
Lecardonnel, Frederic Flamant, et al.
To cite this version:
Clémence Desjardin, Cyril Charles, Catherine Benoist-Lasselin, Julie Riviere, Maïlys Gilles, et al.. Chondrocytes Play a Major Role in the Stimulation of Bone Growth by Thyroid Hormone. En-docrinology, Endocrine Society, 2014, 155 (8), pp.3123-3135. �10.1210/en.2014-1109�. �hal-01193997�
Chondrocytes Play a Major Role in the Stimulation of
Bone Growth by Thyroid Hormone
Clémence Desjardin, Cyril Charles, Catherine Benoist-Lasselin, Julie Riviere, Mailys Gilles, Olivier Chassande, Caroline Morgenthaler, Denis Laloé, Jérôme Lecardonnel, Frédéric Flamant, Laurence Legeai-Mallet, and Laurent Schibler
Institut National de la Recherche Agronomique (INRA) (C.D., J.R., M.G., C.M., D.L., J.L., L.S.), UMR1313, Biologie Intégrative et Génétique Animale, Jouy-en-Josas, France; Centre National de la Recherche Scientifique (CNRS) UMR 5242 (C.C.), ENS Lyon, Institut de Génomique Fonctionnelle, Université de Lyon, Lyon, France; Institut Imagine (C.B.-L., L.L.-G.) Institut National de la Sante´ et de la Recherche Medicale, U1163, Université Paris Descartes, 75015 Paris, France; University of Bordeaux (O.C.), U1026, Bioingénierie Tissulaire, Bordeaux, France; and Institut de Génomique Fonctionnelle de Lyon (F.F.), Université de Lyon, CNRS, INRA, École Normale Supérieure de Lyon, 69364 Lyon Cedex 07, France
Thyroid hormone (T3) is required for postnatal skeletal growth. It exerts its effect by binding to
nuclear receptors, TRs including TR␣1 and TR1, which are present in most cell types. These cell types include chondrocytes and osteoblasts, the interactions of which are known to regulate endochondral bone formation. In order to analyze the respective functions of T3stimulation in
chondrocytes and osteoblasts during postnatal growth, we use Cre/loxP recombination to express a dominant-negative TR␣1L400Rmutant receptor in a cell-specific manner. Phenotype analysis
revealed that inhibiting T3response in chondrocytes is sufficient to reproduce the defects observed
in hypothyroid mice, not only for cartilage maturation, but also for ossification and mineralization. TR␣1L400Rin chondrocytes also results in skull deformation. In the meantime, TR␣1L400Rexpression
in mature osteoblasts has no visible effect. Transcriptome analysis identifies a number of changes in gene expression induced by TR␣1L400Rin cartilage. These changes suggest that T
3normally cross
talks with several other signaling pathways to promote chondrocytes proliferation, differentia-tion, and skeletal growth. (Endocrinology 155: 3123–3135, 2014)
T
he skeleton is made up of bones developing through 2 distinct processes, intramembranous and endochon-dral ossification. Intramembranous ossification, which occurs in the calvarial bones and distal clavicles, involves direct differentiation of mesenchymal cells into osteo-blasts. In contrast, endochondral ossification, which oc-curs in the remainder of the skeleton, involves differenti-ation of mesenchymal cells into chondrocytes that form a cartilage template for future bone. During endochondral ossification, chondrocytes undergo hypertrophic differen-tiation, characterized by sequential changes in cell mor-phology and matrix synthesis, and the cartilage isulti-mately replaced by bone tissue following vascular invasion. This process progression is tightly regulated by numerous circulating hormones, cytokines, and growth factors (1, 2) including thyroid hormone T3 (the active
derivative of T4).
Childhood hypothyroidism results in short stature, bone age delay, skeletal dysplasia, and delayed dental de-velopment, with abnormally thin growth plates and im-paired chondrocyte hypertrophy (3). Hypothyroid rats display a disorganized growth plate with a decreased hy-pertrophic zone (4). Conversely, childhood thyrotoxicosis accelerates growth and advances bone age. It also induces
ISSN Print 0013-7227 ISSN Online 1945-7170 Printed in U.S.A.
Copyright © 2014 by the Endocrine Society Received February 6, 2014. Accepted June 3, 2014. First Published Online June 10, 2014
For News & Views see page 2747
Abbreviations: Thyroid hormone (TH), TR␣1, thyroid hormone receptor ␣ 1; CT, micro-CT; BMD, bone mineral density; BV/TV, bone volume fraction; ECM, extracellular matrix; 3D, 3-dimensional.
short stature due to premature fusion of the growth plates (5). T3is thus a positive regulator of cartilage maturation,
stimulating the clonal expansion of resting chondrocytes and their subsequent hypertrophic differentiation. This correlates with changes in glycosaminoglycan secretion and the induction of collagen X expression (6 – 8).
These actions are either direct or mediated through in-teractions with other signaling pathways. In particular, T3
has been shown to control or interact with pathways in-volved in the pace of chondrocyte proliferation and dif-ferentiation, including the Ihh–PTHrP, GH, IGF1, Wnt, BMPs, and fibroblast growth factors (FGFs) (9). Likewise, T3 has been shown to stimulate osteoblast biosynthetic activity and differentiation through key pathways includ-ing IGF1, FGF receptor 1, and RANKL (9).
T3 exerts its effect by binding to nuclear receptors
(TRs). In mice, the 2 main receptors, TR␣1 and TR1 are encoded by the Thra and Thrb genes, which are both ex-pressed in chondrocytes, osteoblasts, and osteoclasts. Un-liganded TRs repress target gene transcription by recruit-ing corepressors. Upon T3 binding, they change their conformation, dissociating from the corepressor complex and recruiting transcription coactivators. This results in transactivation of neighboring genes.
In humans, germline mutations of either THRA (10, 11) or THRB (12) have multiple detrimental conse-quences, which comprise delayed bone growth and short stature. In mice, the knock-out and knock-in mutations of
Thra and Thrb also have a visible effect on skeletal growth.
Because Thrb mutations result in increased circulating levels of TSH and T3due to disruption of the hypotha-lamic-pituitary-thyroid axis, the bone phenotype of the corresponding mutant mice resembles skeletal hyperthy-roidism, with advanced ossification and increased miner-alization. Their bone phenotype does not reflect the ab-sence of TR1-mediated response of bone cells, but rather the excess of circulating T3acting via TR␣1 (13–17). By contrast, Thra mutations do not markedly alter the serum level of T3 and lead to a delayed ossification and bone growth that resembles hypothyroidism. Therefore the lo-cal function of TR␣1 seems to be predominant in bone growth, consistent with the 10-fold higher mRNA levels of TR␣ than TR1 in the skeleton (16). However, in one of the Thra knock-in models, growth is only delayed and adult mice reach normal size (18).
In order to investigate the specific and direct roles of TR␣1 in cartilage maturation and bone ossification, we used Cre-mediated recombination in mice to generate tis-sue-specific Thra mutations from a floxed allele called
TR␣AMI(for AF2-mutation, inducible). The allele design is such that Cre recombination leads to the expression of a mutant receptor, TR␣1L400R, unable to interact with
histone acetyl transferase coactivators. The expression of the nonreceptor isoforms encoded by Thra (19) remains unchanged. TR␣1L400Rexerts a dominant-negative activ-ity, preventing T3 response of heterozygous cells. Al-though in vitro experiments suggest that the dominant-negative activity can also affect TR1, in vivo studies suggest that TR1 functions are preserved (20). In the present study, we crossed mice carrying the TR␣AMIallele with transgenic mice expressing Cre either in chondro-cytes and their progenitors (Col2Cre) or in mature osteo-blasts (Col1Cre). Phenotype analysis and molecular stud-ies revealed that, during early phases of skeletal development, the main function of TR␣1 is to stimulate chondrocyte differentiation. Thus, alterations of bone structure observed in hypothyroidism are likely to result, at least in part, from a primary defect in cartilage maturation.
Materials and Methods
Animals
The TR␣AMI
construction has been extensively studied pre-viously (20 –23). Col1Cre mice (24) and were obtained from the Mutant Mouse Regional Resource Center (MMRRC) at the Uni-versity of California, Davis. Col2Cre mice have also been fully characterized (25), and we verified that transgene expression per se does not alter bone growth or adult size. Tissue specificity of
Cre expression was further confirmed by PCR in a panel of 8
tissues (data not shown). TR␣AMI/AMI
males (129/Sv) were crossed with Col2Cretg/wt
or Col1Cretg/wt
females (C57bl6 back-ground) to produce control mice (TR␣AMI/wtCol2Crewt/wtand
TR␣AMI/wt
Col1Crewt/wt
) and mutant mice expressing the dom-inant-negative TR␣1L400R
protein in cartilage or bone (TR␣L400R/wtCol2Cretg/wtand TR␣L400R/wtCol1Cretg/wt, there-after called TR␣L400R
/C2 and TR␣L400R
/C1;Supplemental Fig-ure 1). At least 3 pairs of mice (males and/or females) were gen-erated for subsequent analysis at postnatal days 7, 14, 21, 28, and 35 (P7, P14, P21, P28, P35). The experimental protocol number 12/033 was reviewed and approved by the Animal Care Committee of INRA and AgroParisTech (COMETHEA, France), which abides by the requirements of Directive 86/609 of the European Community Council. Blood samples were col-lected from P14, P21, and P28 to estimate T3/T4circulating levels using Roche T3and T4ECLIA Electrochemiluminescence assay. We verified a posteriori that the phenotypes of male and female bone were not statistically different for all measured parameters.
Histomorphometry and in situ hybridization
TR␣L400R
/C2 femurs from P1, P14, and P28 mice were fixed
for 24 hours in paraformaldehyde and decalcified in 0.5M EDTA buffer for 1–3 weeks. Paraffin-embedded 5-m longitudinal sec-tions were stained with hematoxylin-eosin or alcian blue-alizarin red. In situ hybridizations were performed using type II and type X collagen probes to identify resting (RZ), proliferative (PZ), and hypertrophic zones (HZ) of the growth plate. Image J soft-ware was used to calculate mean values for the epiphysis and
ossification center area as well as growth plate thickness and RZ, PZ, and HZ heights in femur sections. Four to 6 animals per genotype were examined at each time point. At least 2 different levels of section were examined for each sample by taking at least 5 separate measurements across each section examined.
For histomorphometry analyses of TR␣L400R/C1, long bones were fixed, dehydrated at 4°C, and embedded in methyl-meth-acrylate (26). For each right femur or tibia, 7-m thick longitu-dinal sections, parallel to the sagittal plane, were analyzed. His-tomorphometric analysis was performed using the NIS-Elements AR software (Nikon). The measured trabecular area encom-passed the secondary spongiosa. trabecular bone perimeter, and single- and double-labeled perimeters, and interlabeled widths were measured. These were used to calculate MS/BS ([double labeled perimeters⫹ single labeled perimeters/2]/trabecular pe-rimeters), mineral apposition rate ([interlabeled widths/interval time]), bone formation rate ([double labeled perimeters⫹ single labeled perimeters/2]⫻ interlabeled widths/interval time/trabec-ular perimeters). All statistical comparisons were done using Stu-dent’s t test.
X-Ray and X-ray microcomputed tomography (CT) analysis
The skeletons of the TR␣L400R/C2 mice and their control littermates were radiographed on Kodak oncology film using Cabinet X-ray System Faxitron series-Hewlett Packard (15 sec-onds, 35 kV, and 3 mA). Mouse femurs were stored in 70% ethanol at 4°C beforeCT analysis. Scans were performed using 5m voxel for femurs and 14–17 m for heads (Phoenix nano-tom, GE measurement and control). The scanner used a tungsten source X-ray tube operating at 100 kV and 70A. Images were reconstructed using Phoenix datos x 2 CT software. The Mi-croview software was used for measurements, and the calibra-tion for mineral density in the scans was performed with use of a phantom (hydroxyapatite). For each sample, 2 regions of in-terest were designed manually and scanned, corresponding to the trabecular subchondral bone area (2-mm region below the car-tilage) and to the cortical bone area (measured 5 mm under the cartilage area). The morphometric parameters examined were bone mineral density (BMD), bone mineral content (BMC), tis-sue mineral content (TMC), tistis-sue mineral density (TMD), bone volume fraction (BV/TV), relative bone surface (BS/BV), ular thickness (Tb.Th), trabecular number (Tb.N), and trabec-ular separation (Tb.Sp). For cortical bone, the parameters mea-sured were BMD, inner and outer perimeters, marrow and cortical areas, and total area.
For the femurs of 14-week-old TR␣L400R/C1 mice, 3-dimen-sional (3D) microarchitecture of the distal femur was evaluated using a high-resolution (8m) microtomographic imaging sys-tem (eXplore Locus, General Electric). A 3D region within the secondary spongiosa in the proximal metaphysis of the tibia or femur was reconstructed, beginning 500 m proximal to the growth plate and extending to 1.5 mm. Trabecular bone volume fraction (BV/TV, %) was determined using the Advanced Bone Analysis (ABA) software (General Electric). Skulls scans of P14 to P35 TR␣L400R
/C2 were performed using 14 –17m voxel.
Geometric morphometric analyses were performed using Amira 5.3 and MorphoJ softwares with 36 3D landmarks defined on skulls and mandibles. Specimen size was normalized, and
land-marks from different specimens were superimposed using the Procrustes method.
Transcriptome analysis
Three pairs of male mutant and control littermates, as well as 3 pairs of female mutant and control littermates were analyzed using Agilent SurePrint G3 Mouse Gene Expression microar-rays. The 2 femoral heads were collected and immediately frozen in liquid nitrogen. Samples were crushed frozen using a mortar and pestle, and RNA extraction was performed using QIAGEN RNeasy Mini kit. RNA amplification and labeling were per-formed using the one-color Low Input Quick Amp Labeling kit (Agilent Technologies). Each RNA sample (50 ng) was amplified and cyanin 3 (Cy3) labeled. Subsequently, cRNA (600 ng) was fragmented and used for hybridization on Agilent sureprint G3 Mouse GE 8⫻ 60K Microarrays (design ID: 028005). Scans (G2505CA; Agilent Technologies) were at a resolution of 3m and a dynamic range of 20 bits. The resulting images were an-alyzed using the Feature Extraction software version 7.10.3.1 (Agilent Technologies). Statistical analyses were done in the Bio-Conductor version 2.10 (27) and R version 2.15.0 environments. To identify genes that were differentially expressed, we applied the empirical Bayes on normalized data, moderated t-statistics implemented in the BioConductor package LIMMA (version 3.12.0) (28). P values were adjusted for multiple testing using the Benjamini and Hochberg method.
Results
Expression of TR␣1L400Rin mature osteoblasts has no visible effect on postnatal growth and long bones ossification
To clarify the respective contribution of mature osteo-blasts and chondrocytes to the promotion of bone growth by T3, we generated 2 transgenic mouse models expressing
the TR␣1L400Rmutant receptor in one of these 2 cell types
(TR␣L400R/C1 and TR␣L400R/C2, respectively). In both
cases, mice were born in the expected Mendelian ratios, and their global health was not visibly affected. We first observed the phenotype of TR␣L400R/C1 mice, expressing
the mutation in mature osteoblasts. No macroscopic de-fect was visible in these mice. We used X-rayCT to an-alyze ossification at P14 and did not find any difference between mutant mice and control littermates in BMD, bone volume, trabecular volume, or other morphologic parameters (Supplemental Table 1). We also analyzed bone structure at adult stage (14 weeks) within the sec-ondary spongiosa in the proximal metaphysis of the tibia or femur and performed 3D reconstruction. Calcein la-beling (2 days before analysis) was used to assess bone remodeling dynamic parameters, and staining for tartrate-resistant alkaline phosphatase activity was used to evalu-ate osteoclast activity. None of these investigations re-vealed any obvious influence of the mutation on bone structure and development (data not shown). This led us
to conclude that altering of T3/TR␣1 signaling in mature osteoblasts is not sufficient to alter bone growth, and that another cell type, most likely chondrocyte, must play a major role in the T3stimulation of bone growth.
Expression of TR␣1L400R
in chondrocytes results in postnatal growth retardation and delayed
ossification
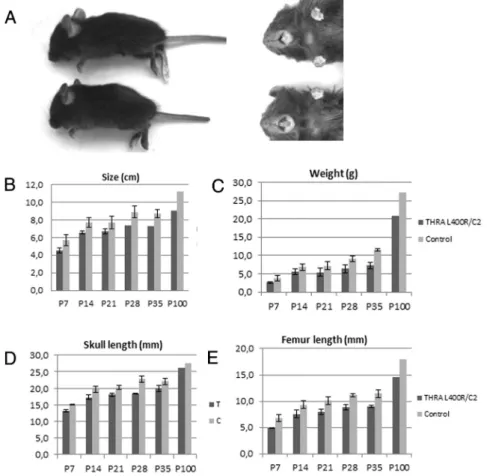
Based on morphometric and bone length comparative analyses, TR␣L400R/C2 mice had important and persistent
postnatal growth retardation. TR␣L400R/C2 mice were
20% smaller and 25% lighter compared with the control at all postnatal ages examined (Figure 1 and Supplemental Table 2). Mutant femurs, tibias, humeri, and ulnas as well as paws were 20% shorter than bones from control ani-mals at all examined stages. However, the TR␣L400R/C2
mice phenotype remained harmonious.
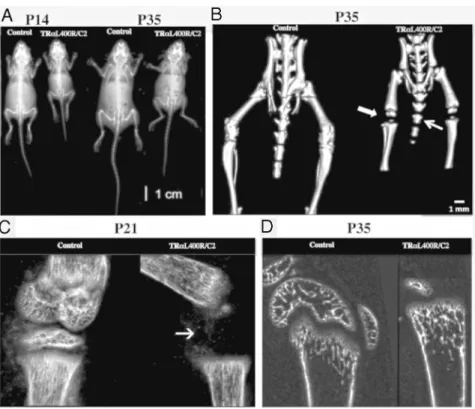
X-ray imaging andCT analysis revealed delayed os-sification in TR␣L400R/C2 mice (Figure 2A). This was
con-firmed by alcian blue/alizarin red skeletal preparations, showing a greater proportion of blue-stained cartilage in the mutant appendicular and axial skeleton (humerus,
tibia, vertebrae, and ribs) at P14, P21 and P28 (data not shown). Vertebrae of mutant mice were shorter and un-dermineralized (Figure 2B). More strikingly, epiphyses were not visible in the tibias and femurs of mutant mice both at P14 (Figure 2C) and P35 (Figure 2, B and D). Altogether, our results show that TR␣L400R/C2 mice
dis-play growth retardation by 2–3 weeks associated with a delayed ossification. As expected, T3and T4
circulat-ing levels showed no systemic alteration (Supplemental Table 3), confirming that the observed effects are cell-autonomous consequences of TR␣1L400Rexpression in
chondrocytes.
Expression of TR␣1L400R
in chondrocytes leads to skull abnormalities due to impaired endochondral ossification
TR␣L400R/C2 mice showed a macroscopic abnormal
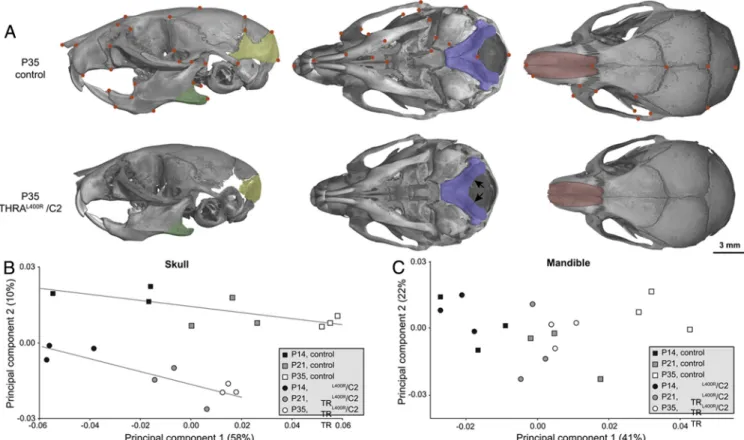
skull conformation with a shorter snout and minor incisor malocclusion (Figure 1A). A 10% significant difference in length and width of skull between control and mutant mice was observed (Supplemental Table 2). DetailedCT analysis of the skull further revealed important modifica-tions, including an incomplete min-eralization of supraoccipital bone at 5 weeks of age (Figure 3A). There
was an occipital gap in the
TR␣L400R/C2 skulls. This phenotype
is indicative of a delayed develop-ment of the occipital bones. Interest-ingly, the affected parts correspond to a structure of cartilaginous origin, which is not yet mineralized after birth (29). There was a normal per-sistence of cartilage at spheno-occip-ital and intraoccipspheno-occip-ital synchondrosis in TR␣L400R/C2 mice compared
with controls. There was no prema-ture fusion of the suprema-tures in mutant mice.
A morphometric analysis per-formed on skulls of P14, P21, and P35 mice allowed analysis of allo-metric growth by performing princi-pal component analysis (PCA). For the skull, the first PCA axis, which is highly correlated with age (P ⬍ .0001), corresponded to a progressive elongation of the skull, especially for the snout (Figure 3B). Segregation of control and TR␣L400R/C2 growth
lines on the analysis clearly indicates that the skull shape is modified in
Figure 1. TR␣1L400Rmutation in chondrocytes result in permanent size reduction: (A)
Mutant mice exhibit an important and persistent postnatal growth retardation and minor incisor malocclusion (upper panel). B–E, Statistical analysis (Student t-tests) of indicated parameters reveal a significant reduction (20%) in global size, femur and skull length, and weight in TR␣L400R/C2 mice which is maintained in adults.
mutants from early stages. Coordinates of mutant speci-mens along PCA axis 1 indicate a retarded growth, with an important delay at P35, in TR␣L400R/C2 mice. The second
PCA axis appeared to be uncorrelated with age (P⫽ .65) and represented shape modification of the lower distal part of the skull. The apparent shift of growth lines along this second axis suggested a reduction of the supraoccip-ital area of the neurocranium. In contrast, study of man-dibular shape revealed only minor differences between mutants and controls (Figure 3C), corresponding to a re-duction in size of the angular process. Because the abnor-mal skull morphology apparently results from defects in cartilage-derived bone growth, we conclude that it is due to impaired endochondral, but not intramembranous, ossification.
Expression of TR␣1L400Rin chondrocytes impairs
cartilage maturation and alters trabecular bone structure
Comparison of the growth plate organization for
TR␣L400R/C2 and control mice at P7, P15, P21, and P28
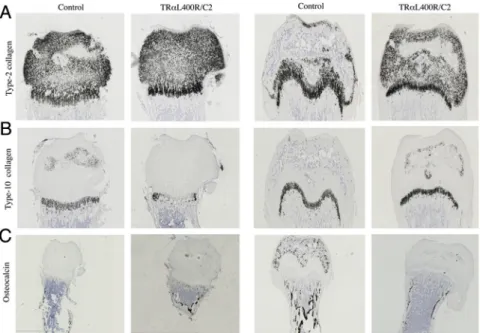
was based on histology (Figure 4) and in situ hybridization of mRNA encoding type-II collagen, type X collagen, os-teocalcin, and osteopontin (Figure 5). This confirmed a 2-to 3-week delay for the formation of a secondary ossifi-cation center in the epiphysis of TR␣L400R/C2 mice. By
contrast, no difference was observed at any of these
de-velopmental stages for VEGF ex-pression, a gene encoding a growth factor known to play a major part in coupling angiogenesis and osteogen-esis in mineralized cartilage and bony trabeculas (data not shown).
In good agreement with these observations, histomorphometry showed a dramatic change in the os-sification center area in mutant
TR␣L400R/C2 long bones (OC/GPO
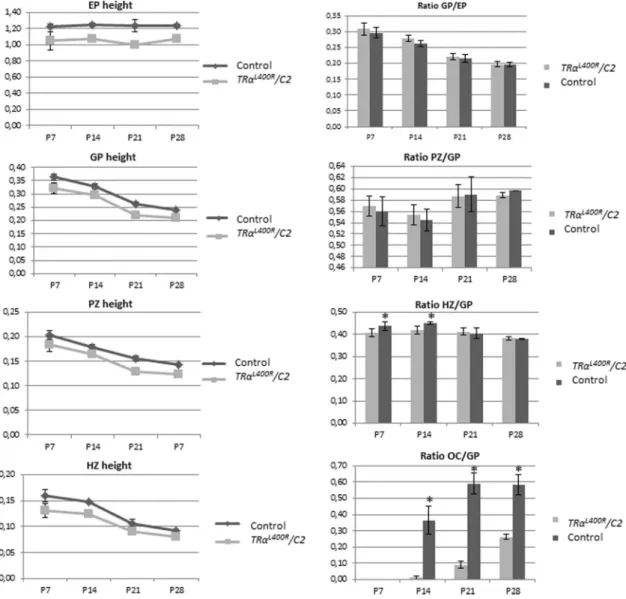
ratio in Figure 6). In addition, we ob-served a 20% lower femur epiphysis height (Supplemental Table 4). Growth plate (GP) as well as prolif-erative zone and hypertrophic zone height were measured, showing a 10%–15% lower GP height due to a narrowing of both PZ (⫺10%) and HZ (⫺15%) (Figure 6). During growth, control and mutant GP seemed to evolve in a similar way, except that the HZ, which declines with age, appeared to be slower for mutant mice between 2 and 4 weeks. Noteworthy, lower GP height ap-peared to be proportionate to the smaller size of the femur epiphysis.
The rate of chondrocyte proliferation, decreased over time in both controls and TR␣L400R/C2 PZ. The decrease
was accelerated in mutant mice, resulting in a significant reduction in bromodeoxyuridine incorporation in mutant chondrocytes at P7 and P14, but not at P21, compared with controls (Figure 7 and Supplemental Table 5). How-ever, immunohistochemistry for cell cycle markers, using antibodies directed against Cyclin D1, p21, and p57, did not reveal any difference between mutants and controls at these development stages (data not shown).
As seen above (Figure 5C), osteocalcin expression was lost in the epiphysis area and in trabeculas of subchondral bone, suggesting an impairment in the bone mineraliza-tion process. To more directly address this point,CT was used to analyze subchondral and cortical bone properties (Figure 8 and Supplemental Table 6). Lower BMD and trabecular thickness were observed in femoral subchon-dral bone of TR␣L400R/C2 mice. In addition, an increase
in trabecular number was observed at P14. The lower BMD was the result of a decreased tissue mineral density, and not of bone volume fraction, suggesting that the quity, but not the volume, of the mineralized bone was al-tered in mutant mice. Noteworthy, subchondral bone pa-rameters of P35 TR␣L400R/C2 mice appeared similar to Figure 2. 3D and Xray imaging indicates dwarfism and bone age delay in TR␣1L400R/C2 mice.
(A)- X-ray at P14 and P35 (B)- 3D imaging confirmed the delay of ossification (arrows) at P35. C, -High magnification at the level of the knee confirming the ossification delay in TR␣L400R/C2 mice
the ones of P21 controls, as illustrated by PCA analysis (Supplemental Figure 2), confirming that the overall pro-cess of bone mineralization is greatly delayed. In cortical bone, the reduced cortical area in mutants suggested a possible imbalance between bone formation by osteo-blasts of periosteum and endosteum and bone resorption by osteoclasts in the endosteum.
Gene deregulation alterations induced by TR␣1L400Rexpression in chondrocytes
To investigate the molecular mechanisms underlying the TR␣L400R/C2 phenotype defects, and to identify the
immediate consequences of expressing TR␣1L400R in chondrocytes, we performed cartilage transcriptome anal-ysis at P14. DNA from 6 pairs of TR␣L400R/C2 mutant and Figure 3. Morphological modifications in skulls and mandibles caused by the expression of TR␣1L400Rin chondrocytes. A. Comparison of
TR␣L400R/C2 and control mice at P35. Arrows indicate the unfused intra-occipital suture in TR␣L400R/C2 mice. B-C Plot of principal components 1
and 2 based on Procrustes analysis of skull (B) and mandibular (C) 3D landmark coordinates of TR␣L400R/C2 and control mice at P14, P21 and P35.
Figure 4. Delay of ossification in TR␣L400R/C2 femurs. A, Light green-Safranin O staining of control and TR␣L400R/C2 femurs showing a delay of
the formation of the epiphyseal ossification center (OC) in the mutant at P14 and P21. B, Histological analyses of the growth plate showing a reduction of the size of the growth plate from P7 to P21.
control littermates (3 pairs of males and 3 pairs of females) were analyzed using Agilent SurePrint G3 Mouse Gene Expression microarrays. This analysis highlighted 95 down-regulated and 361 up-regulated genes in mutant mice (fold change superior to 1.5, adjusted P valueⱕ 0.05) (Supplemental Table 7). We used quantitative PCR to con-firm some of these observations (Supplemental Table 8). Gene Ontology (GO) analysis indicated that these genes are mainly involved in development (including 47 genes involved in skeletal development) cellular organi-zation, cell communication, metabolic processes (includ-ing nucleic acid and protein metabolism as well as pro-teoglycan biosynthesis and bone mineralization), cell adhesion, vesicle-mediated transport, cell cycle, and apo-ptosis (Supplemental Table 9).
These modulated genes are associated with several skel-etal phenotypes such as abnormal birth body size (MP: 0009701) and skeleton morphology (MP:0005508), as well as abnormal bone ossification (MP:0008271). Sta-tistically enriched biological processes include cell differ-entiation (GO:0030154), regulation of biosynthetic pro-cess (GO:0009889), regulation of primary metabolic process (GO:0080090), especially regulation of RNA metabolic process (GO:0051252) and regulation of nitro-gen compound metabolic process (GO:0051171), as well as cell adhesion (GO:0007155) and cilium morphogenesis (GO:0060271) (Supplemental Table 7).
Noteworthy, increased expres-sion of Igf1r (⫻1.9) and Igf2r (⫻1.7) was observed, whereas no change in
Ghr and Fgfr3 expression could be
detected.
Discussion
The generation of somatic mutations by Cre/loxP recombination reveals that TR␣1 in cartilage plays a pre-dominant role in the promotion of bone growth by T3. In agreement with previous study (17) this leaves little room for the controversial hy-pothesis that proposed an indirect influence of TSH (30). Although our data suggest that T3 only acts on
chondrocytes, and not in osteo-blasts, it should be stressed that in the TR␣L400R/C1 mice, TR␣1L400R
is only expressed at a late stage of osteoblast differentiation. There-fore, the possibility remains that the T3/TR␣1 pathway is also required at early steps of their
differentiation. Similarly, we did not explore a possible bone homeostasis alteration linked to aging in our models. However, our genetic evidence confirms previous hypoth-eses based on in vitro studies (31) and phenotype analysis of mice carrying germ line mutations (32, 33) that attri-bute to chondrocytes a pivotal role in the promotion of bone growth and ossification by T3. This developmental
function appears to be mediated mainly by TR␣1. Comparison with other Thra knock-in mouse models
The bone phenotype has been reported for mice ex-pressing mutations similar to TR␣1L400R. The TR␣1PV mutation (34) also alters the C-terminal helix required for the ligand-dependent recruitment of coactivators, whereas the TR␣1R384Cmutation reduces ligand affinity (18). The bone phenotype of TR␣1PV/⫹and TR␣1R384C/⫹
mice is also marked by a major delay in endochondral ossification (32, 35). In both cases, a proportional nar-rowing of PZ and HZ was observed, reflecting impaired entry of progenitor cells into the PZ, together with im-paired hypertrophic chondrocyte differentiation. In our study we found, however, that the PZ evolves similarly in mutants and controls up to P30, whereas the HZ declines at a slower rate in mutants between P15 and P30. This rather suggests a differential effect of TR␣1L400R
expres-Figure 5. Expression of TR␣1L400R
in chondrocytes alter both chondrocytes and osteoblasts populations in femurs (A) In situ hybridization of Col2a1, encoding type II collagen showing a specific expression restricted to the cartilage. B, In situ hybridization of Col10a1, encoding type X collagen does not indicate any significant change in the hypertrophic zone in TR␣L400R
/C2 mice. C, In situ hybridization of Bglab encoding osteocalcin in osteoblasts, shows a specific expression in the mineralized tissues and confirms a delay of bone maturation.
sion on proliferative and hypertrophic chondrocytes dur-ing growth.
Another discrepancy is that TR␣1PV/⫹ and
TR␣1R384C/⫹ mice display delayed intramembranous os-sification of the skull (delayed fontanel closure and suture fusion), without apparent change in skull dimension, whereas we observed a modification in skull shape con-sistent with impaired endochondral ossification without alteration in intramembranous ossification. The observed defect in TR␣L400R/C2 snout elongation also leads to
in-cisor malocclusion, which is likely to modify forces duced by masseter muscles attached to the angular pro-cess. Because angular process development is partly dependent on such forces (36), it is tempting to speculate that the primary defect of supraoccipital bone may cause small changes in mandible shape, whereas disruption of
the Meckel cartilage may alter both size and shape of the mandible.
One likely explanation for these differences is that the TR␣1PV and TR␣1R384Care expressed in all cell types. Therefore delayed intramembranous ossification, as ob-served in these mice, is unlikely to be a cell-autonomous consequence of mutant receptor expression in chondro-cytes. It is possible, however, that the dissimilarities be-tween the mouse models result from differences in recep-tor conformations. Three human mutations in the THRA gene have been reported recently, altering the C-termi-nal helix of the receptor like the mouse PV and L400R mutations (10, 11, 37, 38). The patients with these mu-tations share a number of phenotypic alterations, in-cluding short stature, macrocephaly, and bone age de-lay but also dispde-lay marked differences: For example,
Figure 6. Expression of TR␣1L400R
in chondrocytes delays endochondral ossification. Histomorphometric analysis of the growth plate showing that the heights of epiphysis (EP), growth plate (GP), proliferative zone (PZ) and hypertrophic zone (HZ) were reduced In THR␣L400R
/C2 mice compared to control littermates. Ratio calculations indicate a proportionate reduction of GP height compared to femur size, and a relative reduction in the size of EP, PZ and HZ. The ratio OC/GP confirmed a delay in endochondral ossification.
dysgenesis and fragmentation of the femoral epiphysis were reported in 2 of 4 cases only (10). It seems therefore that different THRA mutations may produce variable phe-notypes. A similar situation has been reported for THRB mutations, for which extensive in vitro studies showed that similar changes in receptor structures can have different out-comes (39).
Role of TR␣1 in cartilage
T3seems to act in cartilage at several levels. It stimulates
the clonal expansion of resting chondrocytes and inhibits chondrocyte proliferation. It also stimulates hypertrophic chondrocyte differentiation, as shown by induction of col-lagen X expression, changes in heparan sulfate proteogly-can secretion, and alkaline phosphatase activity upon T3
stimulation (40, 41). Likewise, T3is involved in terminal differentiation and capillary invasion by stimulating the degradation of proteoglycans, as illustrated by the
aggre-can breakdown induced by T3enhancement of
aggreca-nase-2/ADAM-TS5 activity (42).
The respective functions of TR␣1 and TR1 in these processes are still unclear. In primary culture of rib chon-drocytes, T3treatment decreases cell proliferation. This in vitro effect is mediated by TR1, not TR␣1 (31), and is linked to a stimulation of BMP signaling (43). This is in apparent contradiction to the phenotype of mice with the
Thrb mutation, which have advanced bone age. However,
these mice have impaired pituitary-thyroid axis and ele-vated T3level, and their bone phenotype mainly reflects excessive TR␣1 stimulation by T3(16, 32). In our study,
a 5%-15% decrease in chondrocyte proliferation rate was found in TR␣L400R/C2 mice, suggesting that TR␣1 may be
involved in mediating a positive effect of T3on
chondro-cyte proliferation, as observed in other cell types (44 – 46). However, our study does not arrive at a firm conclusion concerning the respective contribution of TR␣1 and
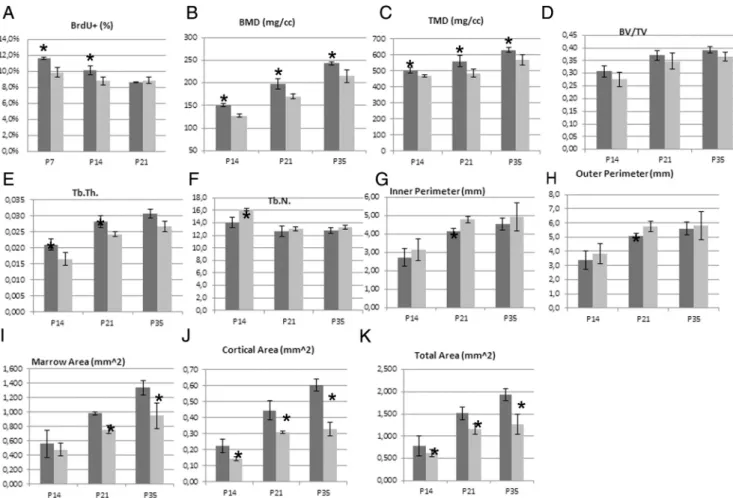
Figure 7. Expression of TR␣1L400Rin chondrocytes decreases chondrocytes proliferation and alters bone structure. A) BrdU labeling reveals a
significant lower rate of chondrocyte proliferation in the femur growth plate at P7 and P14 in mutants. B-L)Microcomputed tomography (CT) analysis of femurs in TR␣L400R/C2mice. Subchondral trabecular bone display a lower BMD and TMD (B and C) at P14, P21 and P35. The BV/TV ratio
(D) is not significantly altered. The trabecular thickness is also lower in mutant mice and the number of trabeculae is lower at P14 (E and F). Taken together, these results suggest that the lower BMD results from a delay of mineralization in mutant mice but that the volume of the mineralized bone is not altered. There are significant differences between the cortical bone of control and mutant mice for the inner and the outer perimeters (G,H) and for the cortical and marrow areas (I,J). These data suggest an impaired balance between bone formation by osteoblasts of the periosteum and endosteum and bone resorption by osteoclasts in the endosteum.
TR1. The reason is that we cannot rule out that the TR␣1L400Rmutated receptor exerts its dominant-negative activity on both TR␣1 and TR1. However, a systematic analysis of mice expressing TR␣1L400Rin all tissues indi-cates that most known Thrb functions are preserved (20). Extracellular matrix (ECM) alterations and cross talks with other signaling pathways
We expected that our transcriptome analysis would clarify the functions of T3in cartilage maturation. One limitation is that changes in mRNA levels may not reflect the direct influence of TR1L400R on gene expression in
chondrocytes but instead changes in the cellular compo-sition of the cartilage at P14. These changes in cellular composition are illustrated by our in situ hybridization results, which indicate a strong reduction in the number of cells containing Bglab mRNA, which encodes osteocalcin. This decrease is unlikely to reflect down-regulation of
Bglab expression but most likely relates to the reduced
number of osteoblasts located in the femoral head, due to the delayed secondary ossification process. The cellular heterogeneity of the studied sample also explains why we did not capture the changes in gene expression associated with the reduced proliferation, because we would expect that only a small fraction of proliferating chondrocytes would display differential expression for cell-cycle genes. The only observed changes for this gene category were for
Ccnh encoding cyclin H (⫻1.6 in TR␣L400R/C2 mice) and Cdc26 (⫻1.8).
Despite these limitations, some of the changes revealed by transcriptome analysis should correspond to direct TR target genes and are likely to play a causative role in the
observed phenotype, whereas others are secondary con-sequences of altered cell differentiation status. We tried to recognize some of the direct target genes by comparing our dataset with similar transcriptome analysis performed in other tissues (47– 49) and by using the genome-wide TR occupancy data recently performed in a neural cell line (50). We expected that at least some of the target genes would be shared by different cell types. This was not the case. It seems therefore that, as previously reported for other nuclear receptors, the repertoire of TR target genes differs widely between different cell types.
One striking outcome of our transcriptome analysis is the observation of major changes in expression for genes involved in ECM biosynthesis, structure, and dynamics. Only a few of these genes (Bcan [2.2]) and Gpc3 [⫻1.9]) encode structural components of ECM. Changes in gene expression were more frequently related to biosynthesis and catabolism of ECM. For example, down-regulation of
Mmp10 (2.8) may impair proteoglycan degradation.
Like-wise, up-regulation of Csgalnact1 (⫻2.3) and Chst13 (⫻1.7), which are involved in chondroitin sulfate synthe-sis and sulfation, and Hyal2 (⫻1.8), which is essential for the breakdown of hyaluronan, may lead to a disruption of ECM biomechanical properties. In good agreement with a previous study (41), up-regulation of Hs6st2 (⫻1.7) was also observed, suggesting changes in heparin sulfate sul-fation pattern that may alter its biological functions. Among these functions are the stabilization of aggrecans and the sequestration and diffusion of several growth factors such as FGFs and Indian Hedgehog. These changes in ECM may thus impact numerous signaling
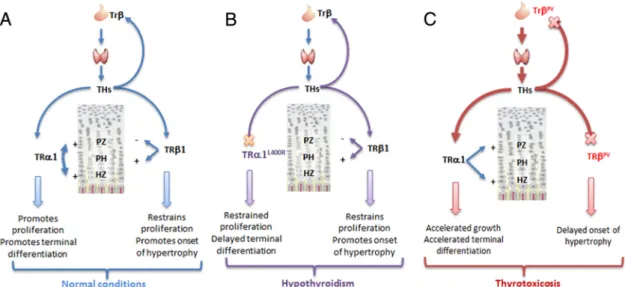
Figure 8. A unifying model for the role of TR␣ in cartilage and bone development. TR mutations alter bone growth mainly in an indirect manner, by altering the feedback regulation of the circulating T3level and creating a status of thyrotoxicosis. TR␣1 mutations produce a
phenotype similar to hypothyroidism, by preventing chondrocytes of the hypertrophic and proliferation zone to respond to T3stimulation.
pathways known to influence chondrocyte prolifera-tion and differentiaprolifera-tion.
Our data also suggest cross talks between T3signaling and other signaling pathways. For example Smoc1 (⫻1.8), encodes a known BMP antagonist. A complex situation was observed with respect to the IGF1 pathway. Up-reg-ulations were observed in mutant cartilage for Igf1r (⫻1.9), Igf2r (⫻1.7), Igf2bp2 (⫻1.6). T3has already been
shown to stimulate Igf1r expression in cultured cells (51). Increasing the level of receptor for IGF-1 should contrib-ute to stimulate the proliferation of resting-zone chondro-cytes, increase chondrocyte hypertrophy, and promote longitudinal bone growth (52). The increase in igf1r ex-pression is thus paradoxical, considering the observation of reduced bone growth in mutant mice. This apparent inconsistency suggests that up-regulation of some inhibi-tors exert a predominant influence. For instance, Wisp3 (⫻2.6) has been demonstrated to suppress IGF1 signaling in chondrocytes and to be part of a WISP3–IGF1 regula-tory loop whereby Wisp3 restricts IGF1-mediated chon-drocyte hypertrophy (53). Likewise, Igf2bp2 is known to counteract IGF1 signaling (54). Alternatively, reduced bone growth may result from an impaired cross talk with the Wnt/-catenin signaling pathways, which have been shown to act downstream of IGF1 signaling to stimulate growth plate chondrocyte proliferation and promote hy-pertrophy (51). Up-regulation of genes encoding Wnt an-tagonist (Sfrp1⫻2.4 and Sfrp2⫻2) and frizzled receptors (Fzd2⫻1.9; Fzd9 ⫻2) should result in decreased prolif-eration and altered chondrocytes differentiation, in a man-ner similar to the one previously reported for the intestinal epithelium (45, 55, 56). In addition, Sox9 (⫻2.7) is known to restrict Wnt signaling (57) and its overexpression in mouse chondrocytes results in a delayed endochondral ossification (58). Furthermore, Wnt and several other sig-naling pathways depend largely upon the cytoskeleton and ciliary signaling (59). Interestingly, deregulation of cytoskeleton, primary cilium, and cell adhesion represent other striking features emerging from our data. The role of cell shape and cell-cell and cell-ECM interactions, all re-lying on the cytoskeleton, as well as ciliary signaling are now well recognized and considered as essential to the maturation of chondrocytes (60).
Delayed ossification in mutant mice results primarily from the growth plate impairment, in good agreement with previous studies suggesting that impaired chondro-cyte terminal differentiation may be responsible for de-fective bone development (61, 62). Our microarray anal-ysis may also provide clues on the indirect consequences of impaired chondrocyte proliferation and differentiation on vascular invasion, osteoblast and osteoclast recruitment, and mineralization. In this respect, we identified several
down-regulated chemokines (Ccl3 2.4, Ccl4 1.6, Ccl9 2.3, and Ccl12 1.6) and secreted proteins (Bglab encoding os-teocalcin 12.5, Ostn encoding osteocrin 2.2 and Wisp2 2.2) that may correspond to these defective processes. In addition to their role in angiogenesis (63– 65) chemokines play a role in bone maturation. They favor osteoclasto-genesis (osteocalcin, CCL9) (66, 67) and osteoclast re-sorption function (osteocalcin, CCL3) (68, 69). Further-more, CCL4 is thought to play a role in maturation and function of osteoblasts (70), and osteocrin acts as a soluble inhibitor of osteoblast differentiation (71).
In summary, TR␣1L400Rhas 2 effects on chondrocyte
differentiation. It first refrain their proliferation. It impairs neither the onset of chondrocyte hypertrophy nor the hy-pertrophic process per se but then alters the fine tuning of terminal differentiation, leading to delayed ossification (Figure 9). Impaired chondrocyte terminal differentiation is then responsible for a defective vascularization and/or osteoblast recruitment, leading to a delayed development of the secondary ossification center. This phenotype is very similar to the one reported in hypothyroidism, sug-gesting that the ability of T3to promote chondrocyte
pro-liferation and terminal differentiation plays a critical role in its ability to promote skeletal growth.
Acknowledgments
We thank Dr Mallein-Gerin from Institute of Biology and Chem-istry of Proteins (LBTi, CNRS-LIMR 5305, Lyon) for providing the Col2Cre mouse model and Suzy Markossian for technical help.
Address all correspondence and requests for reprints to: Frederic Flamant, PhD, Ecole Normale Supérieure de Lyon – IGFL, 46 Allée d’Italie, Lyon – 69007, France. E-mail:Frederic.Flamant@ens-lyon.fr. Author Contribution: Study design: L.S. Study conduct: C.D., L.S., L.L.M., and F.F. Data collection: C.D., J.R., C.M., C.B.L., C.C., O.C., J.L.C. Data analysis and interpretation: L.S., C.D., L.L.M., F.F., D.L., C.C., O.C. Manuscript writing and revising: L.S., C.D., L.L.M., F.F., and O.C.
This study was funded, in part, by a starting grant from INRA Animal genetics Department and UMR1313 GABI and Euro-Grow (FP6-LSHM-CT-2007-037471). This work was sup-ported by the Thyrogenomic2 ANR grant (to F.F.).
Disclosure Summary: All authors have nothing to disclose.
References
1. Marino R. Growth plate biology: new insights. Curr Opin Endo-crinol Diabetes Obes. 2011;18(1):9 –13.
2. Mackie EJ, Tatarczuch L, Mirams M. The skeleton: a multi-func-tional complex organ: the growth plate chondrocyte and endochon-dral ossification. J Endocrinol. 2011;211(2):109 –121.
3. Williams GR, Robson H, Shalet SM. Thyroid hormone actions on cartilage and bone: interactions with other hormones at the epiph-yseal plate and effects on linear growth. J Endocrinol. 1998;157(3): 391– 403.
4. Stevens DA, Harvey CB, Scott AJ, et al. Thyroid hormone activates fibroblast growth factor receptor-1 in bone. Mol Endocrinol. 2003; 12:12.
5. Schlesinger B, Fisher OD. Accelerated skeletal development from thyrotoxicosis and thyroid overdosage in childhood. Lancet. 1951; 2(6677):289 –290.
6. Robson P, Wright GM, Keeley FW. Distinct non-collagen based cartilages comprising the endoskeleton of the Atlantic hagfish, Myx-ine glutinosa. Anat Embryol. 2000;202(4):281–290.
7. Miura Y, Takahashi T, Jung SM, Moroi M. Analysis of the inter-action of platelet collagen receptor glycoprotein VI (GPVI) with collagen. A dimeric form of GPVI, but not the monomeric form, shows affinity to fibrous collagen. J Biol Chem. 2002;277(48): 46197– 46204.
8. Bassett JH, Williams GR. The molecular actions of thyroid hormone in bone. Trends Endocrinol Metab. 2003;14(8):356 –364. 9. Wojcicka A, Bassett JH, Williams GR. Mechanisms of action of
thyroid hormones in the skeleton. Biochim Biophys Acta. 2013; 1830(7):3979 –3986.
10. Bochukova E, Schoenmakers N, Agostini M, et al. A mutation in the thyroid hormone receptor␣ gene. N Engl J Med. 2012;366(3):243– 249.
11. van Mullem AA, Chrysis D, Eythimiadou A, et al. Clinical pheno-type of a new pheno-type of thyroid hormone resistance caused by a mu-tation of the TR␣1 receptor: consequences of LT4 treatment. J Clin Endocrinol Metab. 2013;98(7):3029 –3038.
12. Weiss RE, Refetoff S. Resistance to thyroid hormone. Rev Endocr Metab Disord. 2000;1(1–2):97–108.
13. Bassett JH, O’Shea PJ, Chassande O, et al. Analysis of skeletal phe-notypes in thyroid hormone receptor mutant mice. Scanning. 2006; 28(2):91–93.
14. O’Shea PJ, Bassett JH, Cheng SY, Williams GR. Characterization of skeletal phenotypes of TR␣1 and TR mutant mice: implications for tissue thyroid status and T3 target gene expression. Nucl Recept Signal. 2006;4:e011.
15. O’Shea PJ, Bassett JH, Cheng SY, Williams GR. Characterization of skeletal phenotypes of TR␣1 and TR mutant mice: implications for tissue thyroid status and T3 target gene expression. Nucl Recept Signal. 2006;4:e011.
16. O’Shea PJ, Harvey CB, Suzuki H, et al. A thyrotoxic skeletal phe-notype of advanced bone formation in mice with resistance to thy-roid hormone. Mol Endocrinol. 2003;17(7):1410 –1424. 17. Bassett JH, O’Shea PJ, Sriskantharajah S, et al. Thyroid hormone
excess rather than thyrotropin deficiency induces osteoporosis in hyperthyroidism. Mol Endocrinol. 2007;21(5):1095–1107. 18. Tinnikov A, Nordstro¨m K, Thore´n P, et al. Retardation of
post-natal development caused by a negatively acting thyroid hormone receptor␣1. Embo J. 2002;21(19):5079–5087.
19. Flamant F, Samarut J. Thyroid hormone receptors: lessons from knockout and knock-in mutant mice. Trends Endocrinol Metab. 2003;14(2):85–90.
20. Quignodon L, Vincent S, Winter H, Samarut J, Flamant F. A point mutation in the activation function 2 domain of thyroid hormone receptor␣1 expressed after CRE-mediated recombination partially recapitulates hypothyroidism. Mol Endocrinol. 2007;21(10): 2350 –2360.
21. Fauquier T, Romero E, Picou F, et al. Severe impairment of cere-bellum development in mice expressing a dominant-negative muta-tion inactivating thyroid hormone receptor␣1 isoform. Dev Biol. 2011;356(2):350 –358.
22. Picou F, Fauquier T, Chatonnet F, Flamant F. A bimodal influence of thyroid hormone on cerebellum oligodendrocyte differentiation. Mol Endocrinol. 2012;26(4):608 – 618.
23. Fauquier T, Chatonnet F, Picou F, et al. Purkinje cells and Bergmann glia are primary targets of the TR␣1 thyroid hormone receptor dur-ing mouse cerebellum postnatal development. Development. 2014; 141(1):166 –175.
24. Dacquin R, Starbuck M, Schinke T, Karsenty G. Mouse ␣1(I)-col-lagen promoter is the best known promoter to drive efficient Cre recombinase expression in osteoblast. Dev Dyn. 2002;224(2):245– 251.
25. Sakai K, Hiripi L, Glumoff V, et al. Stage-and tissue-specific expres-sion of a Col2a1-Cre fuexpres-sion gene in transgenic mice. Matrix biology: journal of the International Society for Matrix Biology. 2001;19(8): 761–767.
26. Parfitt AM. Bone histomorphometry: standardization of nomencla-ture, symbols and units. Summary of proposed system. Bone Miner. 1988;4(1):1–5.
27. Gentleman RC, Carey VJ, Bates DM, et al. Bioconductor: open software development for computational biology and bioinformat-ics. Genome Biol. 2004;5(10):R80.
28. Smyth GK, Michaud J, Scott HS. Use of within-array replicate spots for assessing differential expression in microarray experiments. Bioinformatics. 2005;21(9):2067–2075.
29. Guihard-Costa AM, Sakka M. [Variations as a function of time of
the ossification of various bony elements of the cranial vault (ex-perimental study in mice)]. Bulletin de l’Association des
anato-mistes. 1986;70(211):27–32.
30. Abe E, Marians RC, Yu W, et al. TSH is a negative regulator of skeletal remodeling. Cell. 2003;115(2):151–162.
31. Rabier B, Williams AJ, Mallein-Gerin F, Williams GR, Chassande
O. Thyroid hormone-stimulated differentiation of primary rib
chon-drocytes in vitro requires thyroid hormone receptor. J Endocrinol. 2006;191(1):221–228.
32. O’Shea PJ, Bassett JH, Sriskantharajah S, Ying H, Cheng SY,
Wil-liams GR. Contrasting skeletal phenotypes in mice with an identical
mutation targeted to thyroid hormone receptor␣1 or . Mol En-docrinol. 2005;19(12):3045–3059.
33. Monfoulet LE, Rabier B, Dacquin R, et al. Thyroid hormone re-ceptor mediates thyroid hormone effects on bone remodeling and bone mass. J Bone Miner Res. 2011;26(9):2036 –2044.
34. Kaneshige M, Suzuki H, Kaneshige K, et al. A targeted dominant negative mutation of the thyroid hormone␣ 1 receptor causes in-creased mortality, infertility, and dwarfism in mice. Proc Natl Acad Sci USA. 2001;98(26):15095–15100.
35. Bassett JH, Nordstro¨m K, Boyde A, et al. Thyroid status during skeletal development determines adult bone structure and mineral-ization. Mol Endocrinol. 2007;21(8):1893–1904.
36. Rot-Nikcevic I, Downing KJ, Hall BK, Kablar B. Development of the mouse mandibles and clavicles in the absence of skeletal myo-genesis. Histology and histopathology. 2007;22(1):51– 60. 37. Moran C, Schoenmakers N, Agostini M, et al. An adult female with
resistance to thyroid hormone mediated by defective thyroid hor-mone receptor␣. J Clin Endocrinol Metab. 2013;98(11):4254–61. 38. van Mullem A, van Heerebeek R, Chrysis D, et al. Clinical pheno-type and mutant TR␣1. N Engl J Med. 2012;366(15):1451–1453. 39. Collingwood TN, Adams M, Tone Y, Chatterjee VK. Spectrum of transcriptional, dimerization, and dominant negative properties of twenty different mutant thyroid hormone-receptors in thyroid hormone resistance syndrome. Mol Endocrinol. 1994;8(9):1262– 1277.
40. Robson H, Siebler T, Stevens DA, Shalet SM, Williams GR. Thyroid hormone acts directly on growth plate chondrocytes to promote hypertrophic differentiation and inhibit clonal expansion and cell proliferation. [In Process Citation]. Endocrinology. 2000;141(10): 3887–3897.
41. Bassett JH, Swinhoe R, Chassande O, Samarut J, Williams GR. Thyroid hormone regulates heparan sulfate proteoglycan expres-sion in the growth plate. Endocrinology. 2006;147(1):295–305. 42. Makihira S, Yan W, Murakami H, et al. Thyroid hormone enhances
aggrecanase-2/ADAM-TS5 expression and proteoglycan degrada-tion in growth plate cartilage. Endocrinology. 2003;144(6):2480 – 2488.
43. Lassova´ L, Niu Z, Golden EB, Cohen AJ, Adams SL. Thyroid hor-mone treatment of cultured chondrocytes mimics in vivo stimulation of collagen X mRNA by increasing BMP 4 expression. J Cell Physiol. 2009;219(3):595– 605.
44. Trentin AG. Thyroid hormone and astrocyte morphogenesis. J En-docrinol. 2006;189(2):189 –197.
45. Kress E, Samarut J, Plateroti M. Thyroid hormones and the control of cell proliferation or cell differentiation: paradox or duality? Mol Cell Endocrinol. 2009;313(1–2):36 – 49.
46. Kowalik MA, Perra A, Pibiri M, et al. TR is the critical thyroid hormone receptor isoform in T3-induced proliferation of hepato-cytes and pancreatic acinar cells. J Hepatol. 2010;53(4):686 – 692. 47. Gil-Iban˜ez P, Morte B, Bernal J. Role of thyroid hormone receptor subtypes␣ and  on gene expression in the cerebral cortex and striatum of postnatal mice. Endocrinology. 2013;154(5):1940 – 1947.
48. Chan IH, Privalsky ML. Isoform-specific transcriptional activity of overlapping target genes that respond to thyroid hormone receptors ␣1 and 1. Mol Endocrinol. 2009;23(11):1758–1775.
49. Lin JZ, Sieglaff DH, Yuan C, et al. Gene specific actions of thyroid hormone receptor subtypes. PLoS One. 2013;8(1):e52407. 50. Chatonnet F, Guyot R, Benoıˆt G, Flamant F. Genome-wide analysis
of thyroid hormone receptors shared and specific functions in neural cells. Proc Natl Acad Sci U S A. 2013;110(8):E766 –E775. 51. Wang L, Shao YY, Ballock RT. Thyroid hormone-mediated growth
and differentiation of growth plate chondrocytes involves IGF-1 modulation of-catenin signaling. J Bone Miner Res. 2010;25(5): 1138 –1146.
52. van der Eerden BC, Karperien M, Wit JM. Systemic and local reg-ulation of the growth plate. Endocr Rev. 2003;24(6):782– 801. 53. Repudi SR, Patra M, Sen M. WISP3-IGF1 interaction regulates
chondrocyte hypertrophy. J Cell Sci. 2013;126(Pt 7):1650 –1658. 54. Firth SM, Baxter RC. Cellular actions of the insulin-like growth
factor binding proteins. Endocr Rev. 2002;23(6):824 – 854. 55. Kress E, Rezza A, Nadjar J, Samarut J, Plateroti M. The
frizzled-related sFRP2 gene is a target of thyroid hormone receptor␣1 and activates-catenin signaling in mouse intestine. J Biol Chem. 2009; 284(2):1234 –1241.
56. Kress E, Skah S, Sirakov M, et al. Cooperation between the thyroid hormone receptor TR␣1 and the WNT pathway in the induction of intestinal tumorigenesis. Gastroenterology. 2010;138(5):1863– 1874.
57. Topol L, Chen W, Song H, Day TF, Yang Y. Sox9 inhibits Wnt
signaling by promoting-catenin phosphorylation in the nucleus. J Biol Chem. 2009;284(5):3323–3333.
58. Akiyama H. [Transcriptional regulation in chondrogenesis by Sox9]. Clin Calcium. 2011;21(6):845– 851.
59. May-Simera HL, Kelley MW. Cilia, Wnt signaling, and the cyto-skeleton. Cilia. 2012;1(1):7.
60. Woods A, Wang G, Beier F. Regulation of chondrocyte differenti-ation by the actin cytoskeleton and adhesive interactions. J Cell Physiol. 2007;213(1):1– 8.
61. Lu C, Wan Y, Cao J, et al. Wnt-mediated reciprocal regulation between cartilage and bone development during endochondral os-sification. Bone. 2013;53(2):566 –574.
62. Mugniery E, Dacquin R, Marty C, et al. An activating Fgfr3 muta-tion affects trabecular bone formamuta-tion via a paracrine mechanism during growth. Hum Mol Genet. 2012;21(11):2503–2513. 63. Sahin H, Borkham-Kamphorst E, Kuppe C, et al. Chemokine Cxcl9
attenuates liver fibrosis-associated angiogenesis in mice. Hepatology. 2012;55(5):1610 –1619.
64. Wu Y, Li YY, Matsushima K, Baba T, Mukaida N. CCL3-CCR5 axis regulates intratumoral accumulation of leukocytes and fibro-blasts and promotes angiogenesis in murine lung metastasis process. J Immunol. 2008;181(9):6384 – 6393.
65. Tsui P, Das A, Whitaker B, et al. Generation, characterization and biological activity of CCL2 (MCP-1/JE) and CCL12 (MCP-5) spe-cific antibodies. Hum Antibodies. 2007;16(3– 4):117–125. 66. Yang M, Mailhot G, MacKay CA, Mason-Savas A, Aubin J, Odgren
PR. Chemokine and chemokine receptor expression during colony
stimulating factor-1-induced osteoclast differentiation in the tooth-less osteopetrotic rat: a key role for CCL9 (MIP-1gamma) in oste-oclastogenesis in vivo and in vitro. Blood. 2006;107(6):2262–2270. 67. Hashimoto F, Kobayashi Y, Mataki S, Kobayashi K, Kato Y, Sakai
H. Administration of osteocalcin accelerates orthodontic tooth
movement induced by a closed coil spring in rats. European journal of orthodontics. 2001;23(5):535–545.
68. Taddei SR, Queiroz-Junior CM, Moura AP, et al. The effect of CCL3 and CCR1 in bone remodeling induced by mechanical loading during orthodontic tooth movement in mice. Bone. 2013;52(1): 259 –267.
69. Roach HI. Why does bone matrix contain non-collagenous pro-teins? The possible roles of osteocalcin, osteonectin, osteopontin and bone sialoprotein in bone mineralisation and resorption. Cell Biol Int. 1994;18(6):617– 628.
70. Hoshino A, Iimura T, Ueha S, et al. Deficiency of chemokine re-ceptor CCR1 causes osteopenia due to impaired functions of oste-oclasts and osteoblasts. J Biol Chem. 2010;285(37):28826 –28837. 71. Thomas G, Moffatt P, Salois P, et al. Osteocrin, a novel bone-specific secreted protein that modulates the osteoblast phenotype. J Biol Chem. 2003;278(50):50563–50571.