HAL Id: insu-01250011
https://hal-insu.archives-ouvertes.fr/insu-01250011
Submitted on 14 Mar 2016
HAL is a multi-disciplinary open access
archive for the deposit and dissemination of
sci-entific research documents, whether they are
pub-lished or not. The documents may come from
teaching and research institutions in France or
abroad, or from public or private research centers.
L’archive ouverte pluridisciplinaire HAL, est
destinée au dépôt et à la diffusion de documents
scientifiques de niveau recherche, publiés ou non,
émanant des établissements d’enseignement et de
recherche français ou étrangers, des laboratoires
publics ou privés.
Annette Eicker, Ehsan Forootan, Anne Springer, Laurent Longuevergne,
Jürgen Kusche
To cite this version:
Annette Eicker, Ehsan Forootan, Anne Springer, Laurent Longuevergne, Jürgen Kusche.
Does
GRACE see the terrestrial water cycle ‘intensifying’?. Journal of Geophysical Research: Atmospheres,
American Geophysical Union, 2016, 121 (2), pp.733-745. �10.1002/2015JD023808�. �insu-01250011�
hydrological fluxes as precipitation (P), evapotranspiration (E), and river discharge (R). It is under debate, however, whether such observed or reconstructed flux changes are real and on what scales. Large-scale increase or decrease of the flux deficit (P-E-R), i.e., flux changes that do not compensate, would lead to acceleration or deceleration of water storage anomalies potentially visible in Gravity Recovery and Climate Experiment (GRACE) data. In agreement with earlier studies, we do find such accelerations in global maps of gridded GRACE water storage anomalies over 2003–2012. However, these have been generally associated with interannual and decadal climate variability. Yet we show that even after carefully isolating and removing the contribution of El Niño that partially masks long-term changes, using a new method, accelerations of up to 12 mm/yr2remain in regions such as Australia, Turkey, and Northern India. We repeat
our analysis with flux fields from two global atmospheric reanalyses that include land surface models (ERA-Interim and MERRA-Land). While agreeing well with GRACE on shorter time scales, they fall short in displaying long-term trends corresponding to GRACE accelerations. We hypothesize that this may be due to time-varying biases in the reanalysis fluxes as noticed in other studies. We conclude that even though its data record is short, GRACE provides new information that should be used to constrain future reanalyses toward a better representation of long-term water cycle evolution.
1. Introduction
In a warming world, according to the Clausius-Clapyeron relation, the capacity of the atmosphere to hold water vapor is expected to increase. Several studies postulate that this leads to increases in precipitation (P), evapotranspiration (E), and river discharge (R), generally perceived as an intensification of the water cycle [Huntington, 2006; Durack et al., 2012]. Model simulations suggest [Held and Soden, 2000; Chou et al., 2009; Greve et al., 2014] that a modification in the atmospheric circulation and long-term evolution of precipita-tion and evapotranspiraprecipita-tion within a given region may not be balanced; dry regions will become drier and wet regions will become wetter in response to warming. In addition, runoff and river discharge depend on changing land surface conditions and may not balance P-E changes.
As a result, decadal changes of the large-scale flux deficit (P-E-R) may be viewed as a cumulative indicator of direct and indirect anthropogenic modifications of the water cycle [Famiglietti and Rodell, 2013]. Any “intensi-fication” can be seen as a departure from the mean behavior of the water cycle, which represents the response to the long-term evolution of climate and land surface conditions. At annual time scales, the long-term or equilibrium behavior can be written as P-E-R = 0. Considering only the departure from this mean state, includ-ing direct anthropogenic activities like groundwater pumpinclud-ing and irrigation (in I), the evolvinclud-ing mass balance can be viewed as ΔP − ΔE − ΔR − I = dtdS [Scanlon et al., 2007]. This means that the temporal evolution of water storage can be linked to (i) modifications of the land boundary conditions and the resulting climate forcing (ΔP − ΔE), (ii) the direct and indirect impacts of anthropogenic activities (I + ΔE) such as groundwater abstraction and land use change, and (iii) the hydrological response of the system (ΔR + ΔE).
However, measured P, E, and R fields and reanalysis data sets suffer from sampling limitations and contain biases, and the effects of anthropogenic modification are in particular difficult to quantify. Therefore, we use data from the NASA/Deutsches Zentrum für Luft- und Raumfahrt (DLR) Gravity Recovery and Climate Experiment (GRACE) twin-satellite mission [Tapley et al., 2004] to investigate such changes of the terrestrial largely fail to reproduce
corresponding flux trends
Supporting Information:
• Data set S1 and Figures S1–S7
Correspondence to:
A. Eicker,
Citation:
Eicker, A., E. Forootan, A. Springer, L. Longuevergne, and J. Kusche (2016), Does GRACE see the terrestrial water cycle “intensifying”?, J. Geophys. Res. Atmos., 121, 733–745, doi:10.1002/2015JD023808.
Received 17 JUN 2015 Accepted 21 DEC 2015
Accepted article online 28 DEC 2015 Published online 26 JAN 2016
©2015. American Geophysical Union. All Rights Reserved.
water cycle, exploring the fact that trends in P-E-R fluxes will result in an acceleration signal in the GRACE-observed total water storage anomaly (TWSA) time series. While it is now common to interpret GRACE-derived accelerations over ice sheet and glacier regions, the only study so far looking into continental patterns of TWSA acceleration from GRACE, Ogawa et al. [2011] used data from 2003 to 2008 and provided inconclusive results. Since then, a longer GRACE time series has become available, and the by far improved accuracy of the reprocessed data products allows to derive acceleration maps with significantly higher spatial resolution. A recently published study by Wu and Heflin [2015] shows such a global map, but they focus on glacier regions and do not discuss implications for continental hydrology.
However, we recognize that breaking down GRACE observations into climate forcing, anthropogenic effects, and hydrological response is impossible without relying to models. On the other hand, long-term trends in fluxes are likely affected by natural interannual variability that may dominate a decade of GRACE observations. One way of dealing with this problem is to conceptually separate “apparent” mathematically derived GRACE accelerations into long-term accelerations and accelerations due to interannual variability. In fact, several studies have shown [Phillips et al., 2012; Forootan et al., 2014; Boening et al., 2012; Fasullo et al., 2013; de Linage et al., 2013] that GRACE water storage anomalies contain large El Niño-Southern Oscillation (ENSO)-related signals, the strongest climate mode. This, of course, simply reflects the fact that precipitation variability due to ENSO leads to storage change rather fast, while evapotranspiration and runoff responses are modulated by land surface conditions and respond on different time scales [e.g., Miralles et al., 2014]. Thus, when trying to isolate a long-term acceleration of the water cycle, ENSO-related signals should be removed from the time series of fluxes. To this end, we introduce a novel approach based on complex independent component anal-ysis that allows to disentangle ENSO and non-ENSO contributions to the water cycle. Even though it should be kept in mind that removing ENSO from the comparably short GRACE time series is still very challenging and that such a separation cannot be regarded as perfect, we show that the method exhibits promising skills in isolating non-ENSO acceleration signals.
2. Water Storage Acceleration Signal in GRACE Time Series
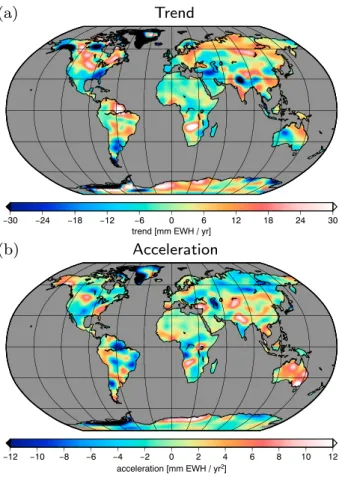
Figure 1 shows the average trend (a) and acceleration (b) of TWSA for 2003–2012, derived from monthly GRACE gravity field models (CSR-RL05 time series [Bettadpur, 2012]) using state of the art methods, see supporting information (SI). As expected, the trend map exhibits regions of long-term climate change (e.g., Greenland and Antarctica ice sheet imbalance and Alaska glacier melting), anthropogenic modifica-tions (e.g., groundwater withdrawal in Northern India, Northern China, and the Middle East), and interannual climate variability (e.g., intensifying precipitation in the Amazon possibly related to an upward trend in trop-ical Atlantic sea surface temperature [Gloor et al., 2013], drought conditions in the La Plata area related to La Niña or weak El Niño events). Yet we find that the acceleration map of Figure 1b reveals, apart from some known signals (increasing mass loss rates of polar glaciers, drop of water level in the Caspian Sea), several regions where water storage accelerates (or decelerates) at a pace comparable to these known effects. Very similar maps are derived from alternative GRACE products (see Figure S1 of the supporting information) and can also be found in Wu and Heflin [2015]. For example, a validation experiment comparing the GRACE accel-erations to altimetry-derived water level variations in the Caspian Sea (Figure S2 of the SI) and comparison to other independent data [Velicogna et al., 2014] verifies the magnitude of the observed signals. In general, statistical tests reveal the estimated accelerations to be significant in about 90% of the continental grid cells. We therefore believe that the observed patterns are real. Moreover, since other geophysical effects leading to gravity change of this magnitude either contain no acceleration signal (glacial isostatic adjustment) or their location is very well known (Mw8–9 Earthquakes), this leads us to suspect that many continental regions are
associated with real trends in water fluxes.
One may argue that regions where trends and accelerations share the same sign are moving away from the long-term equilibrium of the water cycle. As is well known, California, large parts of the U.S. West and Southwest, parts of the Middle East, and also of Equatorial and North Africa belong to the drying regions, while, e.g., Eastern Australia, parts of China, the Sahel, Northeast Europe, and the Parana basin in South America are getting increasingly wetter (in terms of water storage). On the other hand, the largest parts of the Amazon and Siberia appear—at least currently—to converge toward a new equilibrium, as do large parts of the U.S., North Africa, Western Australia, and the Ganges-Brahmaputra basins.
Figure 1. Average trend and acceleration of water storage (EWH = equivalent water height) as seen by the GRACE CSR-RL05 time series for the time span 2003–2012.
The accuracy of GRACE long-term TWSA is still not well understood and depends on the instrumental errors, dealiasing product quality and postprocessing strategy. Here a weighted least squares regression (see details in Scanlon et al. [2012]) allows estimation of the noise level around 3 mm/yr2, which is also equivalent to the
maximum acceleration generally found in most parts of the ocean and in the Sahara region. This corresponds to the fact that independently observed “known” acceleration signals are typically bigger (Figure 1b). This error estimate is in the same range, while being a bit more conservative, than the error estimate computed by Wu and Heflin [2015], who suggest all GRACE-derived accelerations larger than 2 mm/yr2to be significant.
Even when taking a very conservative approach as in Moore and Williams [2014], where GRACE residuals with respect to a parametric model close to ours are considered as temporally correlated noise, regions of strong accelerations over Africa are deemed as statistically significant.
3. Water Storage Acceleration Signal in Reanalysis Time Series
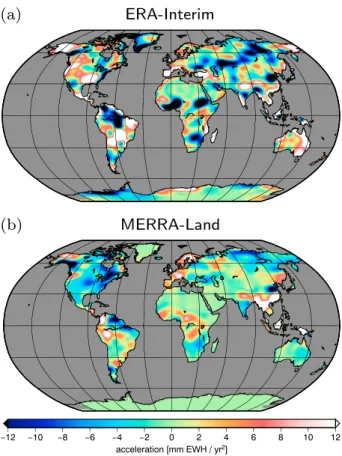
While on annual and shorter time scales, a number of studies found good agreement between GRACE-derived flux and reanalyses (see, e.g., Fersch et al. [2012], Springer et al. [2014], and Table 2 of this article for correlations of short-term flux), we find only few measured TWSA acceleration (i.e., decadal) signals reproduced in global reanalyses of the water cycle. It is important to notice that such accelerations in water storage, according to equation (2) (SI), should equate to trends in the flux budget. Figure 2 shows P-E-R trends averaged over the same period, from reanalysis fields with corresponding land surface models (ERA-Interim and MERRA-Land, for details see SI). First, Figures 2a and 2b reveal, overall, only moderate agreement between these two mod-els, with matching patterns only in some regions, e.g., in Southeast Asia, parts of Africa, and parts of Europe. Similarly, comparing the trend in the flux deficit to the acceleration signal in GRACE (Figure 1b) also shows large differences between modeled and observed accelerations. While ERA-Interim agrees quite well with GRACE over Australia, some regions of the U.S., and Europe, MERRA-Land P-E-R trends agree to GRACE over South America, India, and, e.g., Spain but entirely miss the large signal over Australia. In summary, we find that
Figure 2. Average acceleration of water storage (EWH = equivalent water height) from reanalyses for the time span 2003–2012.
the two global reanalyses fail, at least for many (but different) regions and over 2003–2012, in reproducing flux trends that correspond to independently observed GRACE water storage accelerations. Uncertainties in the models may be introduced by different input data (e.g., precipitation) or land surface representations. In fact, interannual biases in the precipitation differences between ERA-Interim and gauge observations have already been reported in, e.g., Simmons et al. [2010].
While we concede that the GRACE time series is still short and global meteorological analyses at least do not primarily aim at modeling the long-term evolution of the water cycle, we do recommend that future work should address ways of integrating GRACE data into global modeling.
4. Extracting ENSO
Due to the quite limited length of the GRACE time series, accelerations in TWSA due to nonnegligible, long-term trends in flux may be masked by interannual and decadal variability. In fact, several authors have related GRACE time series to ENSO and other modes of natural climate variability. However, in order to relate model deficiencies in reproducing flux trends to, e.g., the impact of unmodeled processes such as direct anthropogenic effects, it would be preferable to separate water storage acceleration into recurring patterns of background climate variability and long-term effects.
In what follows, we therefore first isolate an “ENSO mode” in GRACE TWSA rate and reanalysis net flux fields. This mode is then removed, and the residual “ENSO-free” TWSA acceleration is discussed for selected regions. The underlying hypothesis, of course, is that in this way we will remove most of the interannual variability associated with the response of hydrological systems to ENSO. However, since “ENSO” itself broadly refers to a recurring pattern in various climate data rather than a well-defined physical process, we consider all three data sets individually in this step instead of removing a single “ENSO model realization.” Finally, it can be shown (see Figure S6 of the SI) that after the separation, the ENSO mode exhibits a very strong correlation with the Niño 3.4 index [Trenberth, 1997], while for the non-ENSO mode the correlation is close to zero. From this we conclude that the method succeeds in separating the ENSO effect.
Figure 3. Real and imaginary parts of the ENSO mode found in GRACE TWSA rate (dS∕dt) data. For comparison, the Niño 3.4 index is plotted. All time series are normalized and unitless.
Our method goes as follows (see SI for a detailed mathematical derivation). In the first step, nonseasonal (i.e., after removing a seasonal mode) GRACE water storage rate and reanalysis net flux fields are repre-sented through a finite number of complex-valued orthogonal and uncorrelated modes, ordered according to explained variability. Each of these global modes is characterized by a spatial amplitude pattern, but since the terrestrial water cycle responds to ENSO on various time scales with potential lags, we allow for individual phase lags for each epoch and for each grid cell. To this end, the temporal evolution of each mode is mathematically represented through a real-valued (in phase) and an imaginary (quadrature, i.e., out-of-phase) component, while the corresponding spatial real-valued pattern is complemented by an out-of-phase, imaginary-valued map; see equations (8) and (9) of the SI. Then, in the second step, the most dominant modes are rotated such as to isolate statistically independent rather than orthogonal modes (complex independent component analysis). Our reasoning is that statistically independent modes are more likely to be generated by independent physical processes compared to orthogonal modes [Forootan and Kusche, 2012].
Indeed, it turns out that the real and imaginary contributions to the leading independent modes found in GRACE, ERA-Interim, and MERRA-Land closely follow the Niño 3.4 sea surface temperature (SST) index (shown in Figure 3 for GRACE and in Figure S3 of the SI for ERA-Interim and MERRA-Land).
Niño 3.4 is an indicator of central tropical Pacific sea surface temperature (SST) anomalies, averaged over the box𝜆 = 170°W … 120°W and 𝜙 = 5°S … 5°N. We identify this mode which explains 24.1% (GRACE), 23.6% (MERRA-Land), and 23.1% (ERA-Interim) of the total signal RMS (with the annual and semiannual oscil-lations removed) and which, for example, clearly reproduces above-average continental rainfall that led to
Figure 4. (a) Temporal amplitude and (b) phase evolution of the ENSO mode in GRACE TWSA rate data and reanalyses fluxes. For comparison, the Niño 3.4 amplitude and phase are included.
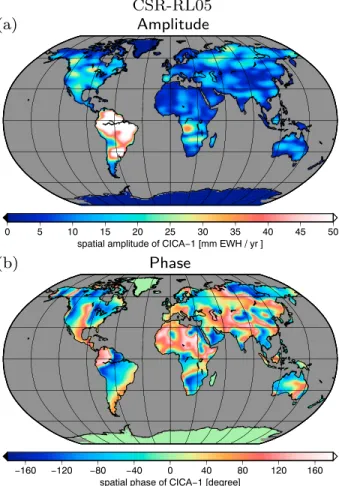
Figure 5. (a) Spatial amplitude of the ENSO mode and (b) the corresponding spatial phase propagation.
the remarkable sea level drop in 2010 [Boening et al., 2012], with the ENSO mode in TWSA rate and the flux products. By cumulating the remaining modes, we then reconstruct the non-ENSO mode.
The imaginary part of the leading mode, in the figure multiplied by −1, and the corresponding imaginary map originate from decomposing a complexified GRACE time series, where the imaginary GRACE fields follow from the Hilbert transform of the real fields (see SI). For each frequency, the Hilbert transform shifts the phase by 90∘. Thus, the more different frequencies the real-valued signal contains, the more will this spread out to various simultaneous time lags. In other words, the apparent varying time lag between real and imaginary contributions to the ENSO mode in GRACE TWSA can be ascribed to the varying frequency content of ENSO, which generally occurs at periods between 2 and 7 years.
It is now useful to map the real and imaginary time series onto an amplitude and phase representation, since the rate of the phase can be identified with the instantaneous frequency of the ENSO mode. Figure 4 shows the temporal amplitude and phase of the ENSO modes found in GRACE TWS rates and ERA-Interim and MERRA-Land fluxes, and, for comparison, of Niño 3.4. The temporal evolutions of amplitude and phase for GRACE are associated with the spatial patterns shown in Figure 5, for the spatial patterns of the reanalyses see Figures S4 and S5 of the SI.
However, one should keep in mind that temporal and (mean) spatial amplitudes are collinear and that we here follow the convention of normalizing the temporal amplitude. The figure then reveals that the tempo-ral amplitude of the GRACE ENSO mode is relatively sustained over the 2008–2010 period (when the phase went through a full cycle), while it appears much less pronounced in 2003–2006 (where Niño 3.4 was mostly positive). We find, on the other hand, the 2010 amplitude larger in reanalyses-derived P-E-R. Moreover, while the ENSO 2008–2010 phase in ERA-Interim follows closely to what GRACE sees, the MERRA-Land phase develops faster. We also find the instantaneous frequency, computed as the rate of phase of the ENSO mode
Figure 6. Time series of water fluxes for different regions. The first column shows the region border and the acceleration signal as seen by GRACE (representing a zoom in from Figure 1b). The time series represent the full signal (second column), the ENSO mode (third column), and the non-ENSO mode (fourth column).
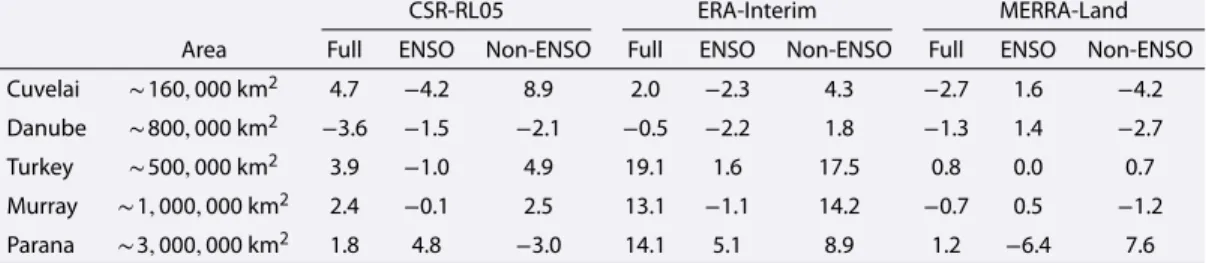
Table 1. Acceleration in Water Storage Change (mm/yr2), Computed as Trend in Flux Time Series
CSR-RL05 ERA-Interim MERRA-Land Area Full ENSO Non-ENSO Full ENSO Non-ENSO Full ENSO Non-ENSO Cuvelai ∼ 160, 000km2 4.7 −4.2 8.9 2.0 −2.3 4.3 −2.7 1.6 −4.2
Danube ∼ 800, 000km2 −3.6 −1.5 −2.1 −0.5 −2.2 1.8 −1.3 1.4 −2.7 Turkey ∼ 500, 000km2 3.9 −1.0 4.9 19.1 1.6 17.5 0.8 0.0 0.7
Murray ∼ 1, 000, 000km2 2.4 −0.1 2.5 13.1 −1.1 14.2 −0.7 0.5 −1.2
Parana ∼ 3, 000, 000km2 1.8 4.8 −3.0 14.1 5.1 8.9 1.2 −6.4 7.6
(see SI), quite similar across GRACE, ERA-Interim, and MERRA-Land except prior to 2005 and boreal summer 2011, and smoothed compared to Niño 3.4. On average over the considered time span, the period corresponds to about one event in 2.2 years.
The spatial amplitude of the ENSO mode in GRACE TWSA rates is displayed in Figure 5a (for the corresponding spatial amplitudes in the reanalyses see Figures S4a and S5a of the SI); this illustrates the (time independent) relative strength of ENSO per region and broadly corresponds to earlier work [e.g., Phillips et al., 2012] that, however, focused on TWSA storage rather than flux as we do here.
Mostly affected is South America with some moderate ENSO variability in TWSA rates over tropical Africa, North America, and many other regions. Spatial phases (Figure 5b) finally tell how the temporal phase is advanced or delayed as per grid cell with respect to Figure 4b; one may relate the phase to the time lag of the maximum correlation within a given temporal windows by using the instantaneous frequency. For example, assuming the average ENSO period of 2.2 years mentioned above, the phase shift shown in Figure 5b corre-sponds to a time lag of 2–8 months in the northeast of the Amazon basin. This is in good agreement with findings by Schmidt et al. [2008] and de Linage et al. [2013], who also identify a quasi-biennial oscillation with similar time lags in this area.
In what follows, we analyze both ENSO and non-ENSO modes in GRACE and global reanalysis fluxes for a number of regions of different sizes, climatic conditions, and ENSO strength.
5. Hot Spots of Acceleration
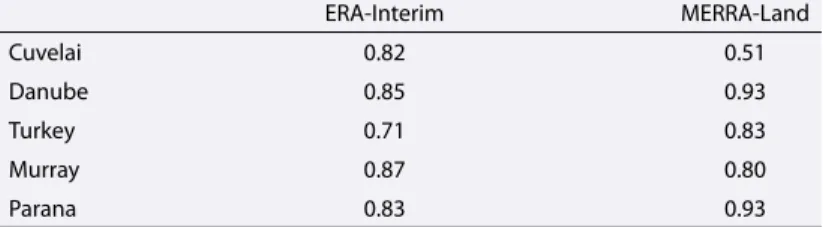
In Figure 6, we close in on a number of hot spots of accelerating TWSA, and we analyze region-averaged interannual net flux change with and without removing the ENSO mode. The regions are chosen such as to each exhibit a nonnegligible positive or negative acceleration signal, to represent different continents and different climate zones, and to experience different influences of ENSO variability. Averaging regions are out-lined in the acceleration maps; they are based on hydrological catchment delineations (except Turkey). Time series plots show GRACE TWSA rates, ERA-Interim, and MERRA-Land net fluxes in mm/month, separated into the full signal (left), the ENSO mode (center), and the non-ENSO signal (right) after removing the ENSO mode. Again, annual and semiannual modes have been removed, and a 13 month moving average filter has been applied to remove high-frequency oscillations. Flux trends (in mm/yr2) are summarized in Table 1, and the
correlation between GRACE and reanalyses fluxes, generally between 0.5 and higher than 0.9, is shown in Table 2. We find that for almost all combinations of region and data set, removing the ENSO mode reduces the RMS variability (Table 3).
5.1. Cuvelai
The Cuvelai or Cuvelai-Etosha basin is located in the north central part of Namibia. This endorheic basin is characterized by highly variable rainfall, ranging from 250 to 830 mm/yr, leading a system of shallow ephemeral streams originating in Angola and spreading over flat planes [Mendelsohn et al., 2013]. Widespread surface water variability of unclear origin was detected by Hiyama et al. [2014], using NDVI (Normalized Difference Vegetation Index) derived from the MODIS (Moderate Resolution Imaging Spectroradiometer) instrument. For this region, Ahmed et al. [2014] report a distinct positive trend in TWSA, without identifying a clear increase in precipitation. They ascribe the increase in water to the change from a drought situation to wetter conditions including frequent flooding events during the GRACE period. The positive trend can also be found in Figure 1. TWSA acceleration observed by GRACE is also positive (4.7 mm/yr2) and almost doubles
aComputed for the full (ENSO plus non-ENSO) signal after removing the trend.
may mask any long-term effect potentially related to anthropogenic origin, such as the recent development of surface water irrigation to feed this region with the highest population density in Namibia. This is similar, yet less pronounced, for ERA-Interim, while MERRA-Land fails to reconstruct an increase in TWSA rate. Yet the Cuvelai basin is, with an area of about 160,000 km2, at the limit of the GRACE resolution, and we cannot rule
out GRACE errors mapping into even the dominating empirical modes and thus creating artifacts in our ENSO reduction. We conclude that GRACE suggests an intensification, but that a longer time series and comparison to independent observations, including surface water volume monitoring, is required.
5.2. Danube
In the larger, well-monitored Danube basin, net reanalysis flux change fits quite well to GRACE results (Figure 6b, full signal), as also observed, e.g., by Springer et al. [2014]. Excluding the period prior to 2006, RMS differences to GRACE are below 2.5 mm/month (ERA-Interim) and 1.6 mm/month (MERRA-Land). We find a positive trend and a robust negative acceleration (−3.6 mm/yr2for GRACE), that is, to some extend,
recon-structed in ERA-Interim and MERRA-Land and that is also present in the non-ENSO signals. Yet dry periods leading to water storage increase (2004–2006, 2007, and 2010) and wet periods of negative storage rates are strong and may dominate long-term effects. Pan et al. [2012] combined various data sets, including GRACE, in an adjusted multisensor water budget for the Danube. Their results indicate that rainfall and evapotranspi-ration fluxes are affected by interannual variations over the basin. The Danube basin is known to be affected by both ENSO and the North Atlantic Oscillations (NAO) [Rimbu et al., 2004], which contribute to climate at 30 year time scales. Therefore, GRACE positive trend and negative acceleration suggest here the impact of NAO on the limited GRACE time frame. In the light of an overall positive (but decreasing) water storage rate, we conclude that GRACE, in line with the reanalyses, does not point to an intensification for the Danube basin.
5.3. Turkey
While recent studies have focused on groundwater loss and reservoir/lake storage change over the Middle East [Voss et al., 2013; Longuevergne et al., 2012], an acceleration signal stands out in GRACE analyses over the western part of Turkey. The GRACE time series exhibits a negative trend signal (Figure 1a), which can be attributed to drought conditions and groundwater withdrawal [Lenk, 2013] for the years 2003–2008. In the following years, above-average precipitation levels [Kurnaz, 2014] led to an increase in storage and thus to an overall positive acceleration (Figure 6c). We find that this net effect persists after removing the (weaker) ENSO mode. Interestingly, while the net flux variability from both ERA-Interim and MERRA-Land appears to agree quite well with GRACE, ERA-Interim exhibits a very large trend. Investigating the fluxes individually (not shown here) reveals that this difference in trends is caused by the evapotranspiration time series, which exhibits a negative trend in ERA-Interim and a positive trend in MERRA-Land. At the same time the precipi-tation time series of both models agree very well. As the trend in the net flux deficit of MERRA-Land agrees
Table 3. Reduction of the RMS in Percent of Each Time Series After Removing ENSO CSR-RL05 ERA-Interim MERRA-Land Cuvelai 7.0 29.7 10.8 Danube 9.4 27.5 1.4 Turkey 0.6 3.9 3.4 Murray 18.1 0.0 −12.1 Parana −23.2 20.9 10.3
much better with what GRACE sees, we hypothesize that the differences in E are possibly related to model biases in ERA-Interim, in lieu of a better explanation. We note that, comparing model TWSA to GRACE over the Turkey-Iran region, Swenson and Lawrence [2014] found the soil resistance parameterization in the Com-munity Land Model causing a similar problem with the E simulation in semiarid regions. We conclude that further studies are required to isolate model errors and anthropogenic effects for the Turkey region, in order to explain the GRACE signal which points at a robust acceleration in TWSA.
5.4. Murray-Darling
The Murray-Darling was affected by the severe “Millennium Drought” from the mid-1990s to 2009 [Dijk et al., 2013; Leblanc et al., 2012] which was then followed by a water mass increase due to natural climate variabil-ity in 2010 [Fasullo et al., 2013], resulting in a strong positive acceleration signal visible in the GRACE data (Figure 6d). We find that removing the ENSO mode reduces the amplitude of the positive flux anomaly in 2010 but does hardly change the average trend. While the overall behavior of the modeled and observed flux time series shows similar patterns, both drought conditions and mass increase are much more pronounced in ERA-Interim and less visible in MERRA-Land, when compared to GRACE. Referring to Figures 1a and 1b, we conclude that the northern part of the Murray-Darling appears as increasingly wetting (“intensifying” in terms of water storage), while the southern part may be on a pathway to converge toward an equilibrium. Although the considered time frame is short, our method of removing an empirical ENSO mode suggests that these indications may be insensitive to the timing and strengthness of ENSO and thus more robust. However, ENSO is not the single climate mode that affects the water cycle over Australia, and additional research is solicited that may, e.g., study GRACE sensitivity with respect to the Indian Ocean Dipole [García-García et al., 2011].
5.5. Parana
The Parana or Parana-Plata basin spreads throughout much of South America; it is crossed by many tributaries of the Parana river and includes the large Itaipu and Yacireta reservoirs. Similar to the Danube example, we find good agreement between GRACE TWSA rates and net flux past year 2006, while ERA-Interim appears to have a wet bias since mid-2010. Over the considered time frame, GRACE observes a negative water storage trend, specifically in the lower part of the basin, which has also been reported by Chen et al. [2010] and found to be consistent with recognized drought conditions in the area. Our analysis points at a strong ENSO-related, mainly positive acceleration signal (as expected) that overlays other interannual variations. A strong trend in ERA-Interim net flux is particularly evident in the precipitation time series (not shown) and appears to be partly related to the ENSO mode in this model. In summary, and considering the maps Figures 1a and 1b, we conclude that GRACE suggests that parts of the upper basin are currently storing increasingly more water, likely related to increased precipitation during ENSO. This appears less the case for the lower basin. Removing the ENSO mode in GRACE data would, overall, reverse the sign and point to a slight drying which is unobserved in the reanalyses and requires further investigations.
Of course, one possible reason for disagreements between GRACE and reanalysis results may be that land sur-face models underlying global simulations do not account for anthropogenic modification of water storage (surface and groundwater withdrawal). However, recent estimates of anthropogenic water abstraction rates [Döll et al., 2014, Figure 4c showing present-day abstraction rates in the five basins between 0.1 and 10 mm/yr] suggest that these direct modifications of the water cycle can hardly account for the patterns of acceleration that we observe here. When we assume that groundwater pumping for irrigation started suddenly at some epoch in the past and has linearly increased ever since, a mean anthropogenic TWSA acceleration can be esti-mated from the mean abstractions in Döll et al. [2014]. Assuming conservatively that pumping started in the 1950s, basin averages of these accelerations reach absolute values of less than 0.2 mm/yr2(Murray-Darling
basin) and are, therefore, at least 1 order of magnitude smaller compared to TWSA accelerations seen by GRACE. In other words, seen the present-day rates of abstraction, pumping would have to have started just 20 years ago in order to generate an anthropogenic acceleration of 0.7 mm/yr2in the Murray-Darling
basin or 0.4 mm/yr2 in the Danube catchment, still not outstanding in Table 1 and this is deemed
very unlikely.
6. Discussion and Outlook
With the growing record of data provided by the GRACE satellites, distinct changes in the linear rates of water storage over large land regions within 2003–2012 become evident. These water storage accelerations
means that either the region-averaged net flux (precipitation minus evapotranspiration minus runoff ) exhibits a nonvanishing trend or that water storage changes occur due to groundwater or surface water extraction increasing or decreasing within our analysis time frame. However, recent estimates of anthropogenic water extraction [Döll et al., 2014] suggest that these direct modifications of the water cycle can hardly account for the large patterns of acceleration we observe.
Direct observational records of precipitation, evapotranspiration, and runoff are still hampered by data issues; we therefore compare GRACE-derived trend changes to two global reanalysis products (ERA-Interim and MERRA-Land). However, we find distinctive misagreements between reanalysis-based net flux trends and GRACE, and at this time scale the reanalyses also do not fit to each other. On the other hand, we find that reanalyses fluxes and GRACE rates fit surprisingly well at interannual time scales with correlation coefficients of the deseasoned, detrended time series mostly between 0.71 and 0.93 after applying a 13 month moving average filter. Since we have no reason to suspect the monthly GRACE data products as “drifting,” we conclude that the observed trends are not well represented in model-based flux of either precipitation or evapotranspi-ration (runoff is comparably small). This has been suggested in earlier studies, e.g., for Europe [Springer et al., 2014], and it provides further motivation to consider GRACE data (and data from the GRACE-FO mission to be launched in 2017 as GRACE’s follower) for improving the water cycle in global models.
We then apply a new mathematical method to partition GRACE- and model-derived fluxes into an ENSO mode, associated with El Niño and La Niña cycles and a non-ENSO mode. The ENSO mode explains about 24% of the nonseasonal variability in GRACE, ERA-Interim, and MERRA-Land. It is found to be generally strongest in South America followed by sub-Saharan Africa, Northern India, and (parts of ) the south eastern U.S., while the amplitude and phase of the individual regions differ substantially in the three data sets. For example, in ERA-Interim tropical Australia displays a strong ENSO amplitude which is neither visible in MERRA-Land and GRACE, whereas the Ganges-Brahmaputra delta appears not affected in ERA-Interim while it is in MERRA-Land and GRACE.
Five regions that exhibit a large water storage acceleration signal are studied in more detail: the Danube basin and Western Turkey in Europe, the Cuvelai basin in Central Africa, the Parana basin in South America, and the Murray-Darling basin in Australia. While for some of these regions TWSA accelerations in fact suggest decreasing trends, for the Cuvelai basin and for parts of the Parana and Murray-Darling regions the (short) GRACE record points at an intensification of the water cycle where, admittedly, a large portion may be rather related to interannual climate variability. In fact, for all five regions, removing the ENSO mode from the GRACE data leads variability to be reduced by up to 30%. Yet contrary to what may be expected, we find that removing the ENSO mode does not cause net flux trends to decrease neither in GRACE data nor in reanalysis fields. We rather conclude that, even after accounting for ENSO, GRACE points at TWSA accelerations of up to 8.9 mm/yr2
(Cuvelai-Etosha), corresponding to a linear rate of a total flux of 0.74 mm/month/yr. These trends may be related to remaining non-ENSO climate variability and underlying long-term effects, and it is clear that longer time series are required to address a potential anthropogenic origin. We note that from the short GRACE time series with only 10 years of data the decomposition into ENSO and non-ENSO signals is rather challenging and will certainly introduce uncertainties. However, in a simulation study (see SI) we were able to show that when assuming realistic GRACE errors, the accelerations can be separated reasonably well from the ENSO effects with the resulting errors of the estimated accelerations amounting to up to only 10%.
We further conclude that, at least for the five considered regions, global reanalyses perform surprisingly well at reproducing short-term GRACE TWSA rates beyond the annual and semiannual signals but largely fail to reproduce GRACE flux trends prior to removing ENSO. This, in particular, appears to be related to discrep-ancies in the reanalysis prior to the year 2006. We finally conclude that the growing record of GRACE data,
which will be complemented by the GRACE-FO mission in 2017 [Sheard et al., 2012], still provides great poten-tial for improving the water cycle representation in operational and reanalysis atmospheric and land surface models (as was done, e.g., in Springer et al. [2014]).
References
Ahmed, M., M. Sultan, J. Wahr, and E. Yan (2014), The use of GRACE data to monitor natural and anthropogenic induced variations in water availability across Africa, Earth Sci. Rev., 136, 289–300.
Bettadpur, S. (2012), Insights into the Earth System mass variability from CSR-RL05 GRACE gravity fields, Geophys. Res. Abstracts, vol. 14, EGU2012-6409, EGU General Assembly.
Boening, C., J. K. Willis, F. W. Landerer, R. S. Nerem, and J. Fasullo (2012), The 2011 La Niña: So strong, the oceans fell, Geophys. Res. Lett., 39, L19602, doi:10.1029/2012GL053055.
Chen, J., C. Wilson, B. Tapley, L. Longuevergne, Z. Yang, and B. Scanlon (2010), Recent La Plata basin drought conditions observed by satellite gravimetry, J. Geophys. Res., 115, D22108, doi:10.1029/2010JD014689.
Chou, C., J. D. Neelin, C.-A. Chen, and J.-Y. Tu (2009), Evaluating the rich-get-richer mechanism in tropical precipitation change under global warming, J. Clim., 22(8), 1982–2005.
de Linage, C., H. Kim, J. S. Famiglietti, and J.-Y. Yu (2013), Impact of Pacific and Atlantic sea surface temperatures on interannual and decadal variations of GRACE land water storage in tropical South America, J. Geophys. Res. Atmos., 118, 10,811–10,829, doi:10.1002/jgrd.50820. Dijk, A. I., H. E. Beck, R. S. Crosbie, R. A. Jeu, Y. Y. Liu, G. M. Podger, B. Timbal, and N. R. Viney (2013), The millennium drought in southeast
Australia (2001–2009): Natural and human causes and implications for water resources, ecosystems, economy, and society, Water Resour. Res., 49, 1040–1057, doi:10.1002/wrcr.20123.
Döll, P., H. Müller Schmied, C. Schuh, F. T. Portmann, and A. Eicker (2014), Global-scale assessment of groundwater depletion and related groundwater abstractions: Combining hydrological modeling with information from well observations and GRACE satellites, Water Resour. Res., 50, 5698–5720, doi:10.1002/2014WR015595.
Durack, P. J., S. E. Wijffels, and R. J. Matear (2012), Ocean salinities reveal strong global water cycle intensification during 1950 to 2000, Science, 336(6080), 455–458.
Famiglietti, J. S., and M. Rodell (2013), Water in the balance, Science, 340(6138), 1300–1301.
Fasullo, J. T., C. Boening, F. W. Landerer, and R. S. Nerem (2013), Australia’s unique influence on global sea level in 2010–2011, Geophys. Res. Lett., 40, 4368–4373, doi:10.1002/grl.50834.
Fersch, B., H. Kunstmann, A. Bárdossy, B. Devaraju, and N. Sneeuw (2012), Continental-scale basin water storage variation from global and dynamically downscaled atmospheric water budgets in comparison with GRACE-derived observations, J. Hydrometeorol., 13(5), 1589–1603.
Forootan, E., and J. Kusche (2012), Separation of global time-variable gravity signals into maximally independent components, J. Geod., 86(7), 477–497.
Forootan, E., J. Kusche, I. Loth, W.-D. Schuh, A. Eicker, J. Awange, L. Longuevergne, B. Diekkrüger, M. Schmidt, and C. Shum (2014), Multivariate prediction of total water storage changes over West Africa from multi-satellite data, Surv. Geophys., 35(4), 913–940. García-García, D., C. C. Ummenhofer, and V. Zlotnicki (2011), Australian water mass variations from grace data linked to Indo-Pacific climate
variability, Remote Sens. Environ., 115(9), 2175–2183.
Gloor, M., R. Brienen, D. Galbraith, T. Feldpausch, J. Schöngart, J.-L. Guyot, J. Espinoza, J. Lloyd, and O. Phillips (2013), Intensification of the Amazon hydrological cycle over the last two decades, Geophys. Res. Lett., 40, 1729–1733, doi:10.1002/grl.50377.
Greve, P., B. Orlowsky, B. Mueller, J. Sheffield, M. Reichstein, and S. I. Seneviratne (2014), Global assessment of trends in wetting and drying over land, Nat. Geosci., 7(10), 716–721.
Held, I. M., and B. J. Soden (2000), Water vapor feedback and global warming 1, Annu. Rev. Energy Env., 25(1), 441–475.
Hiyama, T., T. Suzuki, M. Hanamura, H. Mizuochi, J. R. Kambatuku, J. N. Niipele, Y. Fujioka, T. Ohta, and M. Iijima (2014), Evaluation of surface water dynamics for water-food security in seasonal wetlands, north-central Namibia, Proc. Int. Assoc. Hydrol. Sci., 364, 380–385. Huntington, T. G. (2006), Evidence for intensification of the global water cycle: Review and synthesis, J. Hydrol., 319(1), 83–95. Kurnaz, L. (2014), Drought in Turkey, IPC-Mercator Policy Brief, Sabanci Univ., Karakoy-Istanbul, Turkey.
Leblanc, M., S. Tweed, A. Van Dijk, and B. Timbal (2012), A review of historic and future hydrological changes in the Murray-Darling basin, Global Planet. Change, 80, 226–246.
Lenk, O. (2013), Satellite based estimates of terrestrial water storage variations in Turkey, J. Geodyn., 67, 106–110.
Longuevergne, L., C. Wilson, B. Scanlon, and J. Crétaux (2012), GRACE water storage estimates for the Middle East and other regions with significant reservoir and lake storage, Hydrol. Earth Syst. Sci. Discuss., 9, 11,131–11,159.
Mendelsohn, J., A. Jarvis, and T. Robertson (2013), A profile and atlas of the Cuvelai-Etosha basin, RAISON, Windhoek, Namibia. Miralles, D. G., et al. (2014), El Niño–La Niña cycle and recent trends in continental evaporation, Nat. Clim. Change, 4(2), 122–126. Moore, P., and S. Williams (2014), Integration of altimetric lake levels and GRACE gravimetry over Africa: Inferences for terrestrial water
storage change 2003–2011, Water Resour. Res., 50(12), 9696–9720.
Ogawa, R., B. F. Chao, and K. Heki (2011), Acceleration signal in GRACE time-variable gravity in relation to interannual hydrological changes, Geophys. J. Int., 184(2), 673–679.
Pan, M., A. K. Sahoo, T. J. Troy, R. K. Vinukollu, J. Sheffield, and E. F. Wood (2012), Multisource estimation of long-term terrestrial water budget for major global river basins, J. Clim., 25(9), 3191–3206.
Phillips, T., R. Nerem, B. Fox-Kemper, J. Famiglietti, and B. Rajagopalan (2012), The influence of ENSO on global terrestrial water storage using GRACE, Geophys. Res. Lett., 39, L16705, doi:10.1029/2012GL052495.
Rimbu, N., M. Dima, G. Lohmann, and S. Stefan (2004), Impacts of the North Atlantic Oscillation and the El Niño–Southern Oscillation on Danube river flow variability, Geophys. Res. Lett., 31, L23203, doi:10.1029/2004GL020559.
Scanlon, B., L. Longuevergne, and D. Long (2012), Ground referencing GRACE satellite estimates of groundwater storage changes in the California Central Valley, USA, Water Resour. Res., 48, W04520, doi:10.1029/2011WR011312.
Scanlon, B. R., I. Jolly, M. Sophocleous, and L. Zhang (2007), Global impacts of conversions from natural to agricultural ecosystems on water resources: Quantity versus quality, Water Resour. Res., 43, W03437, doi:10.1029/2006WR005486.
Schmidt, R., S. Petrovic, A. Güntner, F. Barthelmes, J. Wünsch, and J. Kusche (2008), Periodic components of water storage changes from GRACE and global hydrology models, J. Geophys. Res., 113, B08419, doi:10.1029/2007JB005363.
Sheard, B., G. Heinzel, K. Danzmann, D. Shaddock, W. Klipstein, and W. Folkner (2012), Intersatellite laser ranging instrument for the GRACE follow-on mission, J. Geod., 86(12), 1083–1095.
Acknowledgments
We are grateful for the funding of the German Research Foundation DFG (Ehsan Forootan, under the project BAYES-G) and of the HPSC Terrsys (Anne Springer). The GRACE data used in this study can be downloaded at http://podaac.jpl.nasa.gov/GRACE, and the atmospheric reanalyses can be found at http://apps.ecmwf.int/ and http://disc.sci.gsfc.nasa.gov/mdisc/.
Voss, K. A., J. S. Famiglietti, M. Lo, C. Linage, M. Rodell, and S. C. Swenson (2013), Groundwater depletion in the Middle East from GRACE with implications for transboundary water management in the Tigris-Euphrates-Western Iran region, Water Resour. Res., 49, 904–914, doi:10.1002/wrcr.20078.
Wu, X., and M. B. Heflin (2015), A global assessment of accelerations in surface mass transport, Geophys. Res. Lett., 42, 6716–6723, doi:10.1002/2015GL064941.