HAL Id: hal-02555592
https://hal-amu.archives-ouvertes.fr/hal-02555592
Submitted on 4 May 2020HAL is a multi-disciplinary open access archive for the deposit and dissemination of sci-entific research documents, whether they are pub-lished or not. The documents may come from teaching and research institutions in France or
L’archive ouverte pluridisciplinaire HAL, est destinée au dépôt et à la diffusion de documents scientifiques de niveau recherche, publiés ou non, émanant des établissements d’enseignement et de recherche français ou étrangers, des laboratoires
Hassib Audi, Yannick Viero, N Alwhaibi, Zhongrui Chen, Maksym Iazykov,
Arnaud Heynderickx, Fan Xiao, David Guérin, Christophe Krzeminski, Iain
Mark Grace, et al.
To cite this version:
Hassib Audi, Yannick Viero, N Alwhaibi, Zhongrui Chen, Maksym Iazykov, et al.. Electrical molecular switch addressed by chemical stimuli. Nanoscale, Royal Society of Chemistry, 2020, 12 (18), pp.10127-10139. �10.1039/D0NR02461A�. �hal-02555592�
Electrical molecular switch
addressed by chemical stimuli.
H. Audi,1 Y. Viero,2 N. Alwhaibi,3 Z. Chen,1 M. Iazykov,1 A. Heynderickx,1 F. Xiao,1
D. Guérin,2 C Krzeminski,2 I.M. Grace,3 C.J. Lambert,3,* O. Siri,1,* D.Vuillaume2,*,
S Lenfant2,*, H. Klein1,*
1) Centre Interdisciplinaire de Nanoscience de Marseille (CINaM), CNRS, Aix Marseille Université, Marseille, France.
2) Institut d’Electronique, Microélectronique et Nanotechnologie (IEMN), CNRS, Université de Lille, Avenue Poincaré, Villeneuve d’Ascq, France.
3) Physics Department, Lancaster University, Lancaster, LA1 4YB (UK).
Abstract
We demonstrate that the conductance switching of benzo-bis(imidazole) molecules upon protonation depends on the lateral functional groups. The protonated H-substituted molecule shows a higher conductance than the neutral one (Gpro>Gneu), while the opposite (Gneu>Gpro) is
observed for a molecule laterally functionalized by amino-phenyl groups. These results are demonstrated at various scale lengths : self-assembled monolayer, tiny nanodot-molecule
junction and single molecules. From ab-initio theoretical calculations, we conclude that for the H-substituted molecule, the result Gpro>Gneu is correctly explained by a reduction of the
LUMO-HOMO gap, while for the amino-phenyl functionnalized molecule, the result Gneu>Gpro is consistent with a shift of HOMO, which reduces the density of states at the Fermi
Introduction
Molecular electronic exploits the rich variety of organic molecules to create custom-designed molecular devices for applications in future electronics. The desired function should be encoded in the molecules, which are then connected to electrodes. Among the numerous functional molecules found in the literature, the most striking examples of molecular devices are arguably the molecular switches, i.e. molecules which exist as at least two stable isomers, whose electronic properties can be controllably and reversibly modified by external stimuli.1
These switches should be distinguished from molecules where a stochastic conductance switching is observed (e.g. for uncontrollable switching driven by the electric field, or electrode/molecule instabilities).2-6 For conformational switches, the 3D structure of the
molecule is modified by the isomerization reaction (stereoisomerization). The cis-trans isomerization induced by light of the azobenzene molecule,7-12 photoisomerization of
diarylethene,13-16 or hydrogen tautomerization reaction in phtalocyanine,17 are well-known
examples of such switches. In redox switches, the electronic properties depend on the modification of the charge state of the molecules18-22 through oxidation or reduction
depending on the position of the electrochemical potential with respect to the HOMO-LUMO gap of the molecule. It is also possible to control the conductance of molecular junctions by the photo-population of excited states.23-26 In this case, upon resonant illumination, the
electrons photo-injected in the LUMO increase the current though the molecular junctions. In contrast to conformational and redox switches, this effect is not persistent, vanishing rapidly when the excitation is turned off.
Several demonstrations of an alternative approach to electronic conductance modulation by pH control in molecular junctions have been reported.27-31 For example, the
conductance value in the junction can be modified by the protonation or deprotonation of the anchor group of the molecule grafted on a metal surface (electrode). Single molecules of alkanes terminated with diamine or dicarboxylic-acid groups measured by scanning tunneling microscope break-junction (STM-BJ) in a pH-controlled solution show higher conductance at pH = 13 (deprotonated) than at pH = 1 (protonated).28 For these authors, the basic (pH = 13)
or acidic (pH = 1) environment of the molecular junction modifies the chemical specie of the anchoring group: NH2 or COO- in basic environment and NH3+ or COOH in acidic medium.
The NH2 and COO- species enhance the coupling strength between the molecule and the gold
electrode, compared to the NH3+ and COOH species formed in acidic environment. In the
specific case of dithiol terminated alkanes, no significant variation of the conductance with the pH was observed. The same behaviors were also observed for diacid oligo(phenylene ethylene) Langmuir Blodgett films characterized by scanning tunneling microscope (STM)30
with a higher conductance (ratio ≈ 7) for the deprotonated form (COO-Au bond at pH = 11.4) than for the protonated form (COOH-Au bond at pH = 5.9). This difference of conductance was interpreted by the chemical modification of the anchoring group with pH as in Ref. 28, but also by the formation of lateral H bonds between neighboring molecules in the films. For these systems, the higher conductance was obtained for the deprotonated form (Gdepro > Gpro).
More recently, STM-BJ measurements of 4,4'-vinylenedipyridine connected between Ni electrodes showed a conductance switch attributed to change in the electrode/molecule coupling upon protonation, and moreover, the pH required to switch the conductance can also be tuned by the applied electrochemical potential.32 Protonation and deprotonation of a
π-conjugated molecular system bridged in a molecular junction can also modify the conductance. Oligoaniline derivatives connected into gaps in single walled carbon nanotubes exhibits conductance variations of around one decade between the protonated form (pH = 3 )
and deprotonated form (pH = 11) and this variation was reversible during 5 cycles.29 The
higher conductance was obtained for the protonated form. In another system, a multi-sensitive molecule (pH and light) based on a spyropiran derivative and characterized by STM-BJ shows an increase of the conductance by a factor about 2 after protonation of the spyropiran in the open form.31 For these π-conjugated molecular systems, the higher conductance was
obtained for the protonated form (Gpro > Gdepro). We can also mention that an inversion of the
rectifying effect in diblock molecular diodes by protonation was observed by STM.27 This
inversion was explained by a modification of the dipolar moment of the molecule with the protonation that induces a reduction of the HOMO and LUMO energies. Consequently, the conduction occurs by a resonant tunneling through the HOMO before the protonation and through the LUMO after. This last result shows that the protonation or deprotonation of the molecule can modify the molecular orbital energy of the molecule addressed in a molecular junction. A similar influence of the protonation on the LUMO position was reported for SAMs, in which the protonation of the terminal carboxylic acid groups converts back and force the molecular junctions between a resistor and a rectifying diode.33 Protonation has also
been used in combination, with light irradiation to block the spiropyran molecule in its merocyanine isomer and avoiding its spontaneous back switching to the spiropyran form.34
Finally, protonation has been used to induce destructive-quantum-interference in diketopyrrolopyrrole derivative, leading to a reversible decrease of the conductance (1 order of magnitude) upon protonation.35
Benzo-imidazole derivatives are molecules known for their sensitivity to pH, exhibiting a different absorption and/or emission signatures depending on their protonation states.36 Benzo-bis(imidazole) have been recently investigated as precursors of modular
fluorescent probes polymers,37, 38 metal coordination frameworks,39 or Janus bis(carbene)s
and transition metal complexes.40 They are also very attractive acidochromic systems, because
of the presence of two localized π-subunits that can be tuned by reversible protonation to become delocalized.41 Thus, protonation of benzo-bis(imidazole)s of type 1 (R1 = aniline and
R2 = aryl) led to a bathochromic effect (Δλ = 13 nm) that can be explained by the stabilization
of the positive charges (color change from yellow to orange).41 This prompted us to introduce
the –SH anchoring group on the benzobis(imidazole) core for grafting such a molecule on gold surfaces in order to evaluate their pH-sensitive switching properties. Here, we demonstrate that the pH effect on the molecule conductance can be controlled by side chain chemistry. A benzo-bis(imidazole) derivative molecule shows a higher conductance in the neutral case (Gneu>Gpro) when laterally functionalized by aniline functions (molecule A,
scheme 1), while we observe the reverse case (Gpro>Gneu) for the H-substituted molecule
(molecule B, scheme 1). The molecular conductances were measured at 3 scale lengths : self-assembled monolayers (SAM) on flat Au surface, about hundred molecules grafted on Au nanodots (NMJ : nanodot molecule junction) and single molecule by mechanically controlled break junction (MCBJ). The conductances were measured by C-AFM in the two former cases. The 3 approaches give the same trends. These results are supported by theoretical calculations and we conclude that their opposite behaviors depend on the position of the HOMO resonances relative to the Fermi energy of the electrodes, which modify the density of states at the Fermi energy.
Experimental section and methods.
Synthesis of the molecular switch A and B and characterization in solution.
Quinoidal precursors 2 (Bandrowski base)41 and 3 42 were reacted with the aldehyde 4 -
previously unknown - in EtOH in the presence of piperidine to afford the expected benzobis(imidazoles) 5 and 6, respectively, in 46 and 49 % yields (Scheme 1). In situ deprotection - using TBAF (tetra-n-butylammonium fluoride) - gave target compounds A and
B, which could be readily reacted in the presence of gold either as molecular junction, or as
unit able to form self-assembled monolayers, because of the presence of terminal -SH thiol functions. Details on the synthesis of 4, 5 and 6 and NMR results (Fig. S1) are given in the supporting information. To check the properties of these switches, protonation of 5 (the stable form of A, i.e. S-protected) was performed in solution, and clearly showed - as expected - a bathochromic effect (supporting information, figure S1) featuring the formation of the protonated species 7 as model of A•2H+(B•2H+). The protonation of the imidazole site could
be clearly identified by color changes41 and analogy with the related benzimidazole bearing a
pyridine unit.43 Upon protonation, we observed a color change of the solution featuring the
protonation of the imidazole and the formation of a delocalized species (as reported in Ref. 41). The lone pair of NH2 units in aniline is indeed less available due to its conjugation with
the aromatic ring. As a result, NH2 is then less basic than the benzoimidazole core. This
hypothesis is also consistent with Ref. 43, which reports the acid-base properties of 2-pyridylbenzimidazoles. Indeed, the first protonation occurs at the benzimidazole unit and not the pyridine moiety. Since pyridine is more basic than aniline, this observation is in agreement with the protonation of the benzobisimidazole units first in molecule A.
!
Scheme 1. Synthesis of benzo-bis(imidazole) devivatives A and B, and protonation.
Preparation of self-assembled monolayers (SAMs) of molecules A and B on gold surfaces.
Glassware was dried in air at 120 °C overnight prior to use. Desilylation and grafting reactions were performed in a nitrogen glovebox. Dimethylsulfoxide (DMSO, anhydrous grade) was stored over freshly activated molecular sieves for 3 days then degassed by nitrogen bubbling for 30 min. Other chemicals were used as received without further purification. Ultra flat gold surfaces were prepared on glass slides following the template stripped gold technique (TSAu).44, 45 4 eq of tetrabutylammonium fluoride (15 % on alumina,
50 mg for A, 60 mg for B) were added to 5 mg of protected-thiol A or B in 20 mL of anhydrous degassed DMSO under stirring. The initial orange solution quickly darkened, then
N N N N R2 R2 1 R1 R1 S CHO N N N N R S S N N H2N NH2 R R + EtOH / 80°C 1 day piperidine R TMS TMS TMS 2 R = p -C6H4-NH2 3 R = H 4 5 R = p -C6H4-NH2 6 R = H N N N N R SH HS R N N N N R SH HS R A R = p -C6H4-NH2 B R = H H H H+ A 2H+ R = p -C6H4-NH2 B 2H+ R = H N N N N R R H H H+ S TMS S TMS 8 R = H 7 R = p -C6H4-NH2 TBAF
the stirring was continued 1 h under continuous nitrogen bubbling. The medium was quenched by addition of an excess of CaCl2.2H2O (20 mg in 1 mL of degassed methanol) to
hydrolyze thiolate and precipitate fluorides in excess. After 10 min, the solution was filtered through a 0.45 µm PTFE filter then immediately used for the preparation of SAMs. The presence of Bu4NCl adduct and the excess of CaCl2 in the medium were assumed not to
interfere in the grafting of the thiol on gold. TSAu substrates were immersed for 3 days in the
thiol solutions then the functionalized surfaces were cleaned with DMSO, methanol then deionized water. Finally, they were dried under a nitrogen stream.
Acid/base treatments of the SAMs of A and B.
Protonation of the SAMs was realized by placing the substrate for 1 min in vapors of diluted hydrochloric acid (i.e. samples held at 2-3 cm above the surface of a 3 M HCl solution). In the same way, conversion back to the neutral form of the molecules in the SAMs was realized by placing the substrate for 1 min in vapors of triethylamine. Each treatment was followed by a short cleaning in ethanol then deionized water.
Thickness measurements.
We recorded spectroscopic ellipsometry data (on 1 cm2 samples) in the visible range using a
UVISEL (Horiba Jobin Yvon) spectroscopic ellipsometer equipped with DeltaPsi 2 data analysis software. The system acquired a spectrum ranging from 2 to 4.5 eV (corresponding to 300−750 nm) with intervals of 0.1 eV (or 15 nm). Data were taken at an angle of incidence of 70°, and the compensator was set at 45°. We fit the data by a regression analysis to a film-on-substrate model as described by their thickness and their complex refractive indexes. First, a background for the substrate before monolayer deposition was recorded. Secondly, after the
monolayer deposition, we used a 2-layer model (substrate/SAM) to fit the measured data and to determine the SAM thickness. We employed the previously measured optical properties of the substrate (background), and we fixed the refractive index of the organic monolayer at 1.50.46 We note that a change from 1.50 to 1.55 would result in less than a 1 Å error for a
thickness less than 30 Å. Overall, we estimated the accuracy of the SAM thickness measurements at ± 2 Å.47 Albeit other methods (angle resolved XPS, AFM nanoindentation)
could be more accurate, ellipsometry has been established as a simple, rapid, and non-destructive tool to estimate the thickness (>1 nm) of SAMs (see a review in Refs. 46, 48).
XPS measurements.
XPS was performed with a Physical Electronics 5600 spectrometer fitted in an UHV chamber with a residual pressure of 2×10⁻¹⁰ Torr. High resolution spectra were recorded with a
monochromatic Al Kα X-ray source (hν = 1486.6 eV), a detection angle of 45° as referenced to the sample surface, an analyzer entrance slit width of 400 µm and with an analyzer pass energy of 12 eV. Semi-quantitative analysis were completed after standard background subtraction according to Shirley’s method.49 Peaks were decomposed by using Voigt functions
and a least square minimization procedure with constant Gaussian and Lorentzian broadenings for each component of a given peak.
Conducting atomic force microscopy (C-AFM).
Current−voltage characteristics were measured by conducting atomic force microscopy (C-AFM) under a nitrogen flow (Icon, Bruker), using PtIr coated tip (SCM-PIC from Bruker, 0.2 N/m spring constant). To form the molecular junction, the conducting tip was localized at a stationary contact point on the SAM surface at controlled loading force (between 5 to 20 nN).
Current−voltage (I−V) characteristics were acquired with Nanoscope 6 software from Bruker, and treated with Gwyddion v2.4450 and WsXM v5.051 software. Two approaches were used
for these C-AFM characterizations: (i) On large flat template-stripped gold surfaces (TSAu)44,
45 modified with SAM, the C-AFM tip is localized at different places on the sample (typically
on an array of stationary contact points spaced of 100 nm), at a fixed loading force and the I−V characteristics were acquired directly by varying voltage from 0 V to +200 mV for each contact point. The I-V characteristics were not averaged between successive measurements and typically between 100 and 10,000 I-V measurements were acquired on each sample at different areas of the sample. (ii) On array of ∼8 nm (in diameter) single-crystal gold nanodots spaced of 100 nm, fabricated by standard electronic lithography process on (100) Si substrate (resistivity = 10-3 Ω.cm) and chemically functionalized with molecules, the so-called nanodot
molecule junctions (NMJ).52 The fabrication of the nanodots and the detailed characterization
of these nanodot arrays have been reported elsewhere.53, 54 Images (topography and current)
were acquired on the nanodot arrays with a sweep frequency of 0.5 Hz and the voltage applied on the substrate was fixed at 200 mV. From the current images recorded from 1,000 to 4,000 nanodots at a fixed voltage, histograms of the distribution of the current and conductance were obtained for each sample.52
Mechanically controlled break junction (MCBJ).
Our setup consists of a home-made MCBJ55, 56 equipped with its dedicated acquisition and
control electronics and software. The MCBJ samples (see Fig. S2, supporting information) were made with an Au wire (250 μm diameter, 99.99%, Goodfellow) glued into two quartz capillaries (fused silica, 1mm inner diameter, Vitrocom), which are then glued onto a phosphorous bronze bending beam. An optical glue (NOA61, Nordland) is used for both
bondings. The wire is notched in the empty space between the capillaries to initiate the breaking of the junction. The free-standing part of the Au wire is typically 200 μm for our samples, and the unfilled parts of the capillaries act as a reservoir for the organic solutions. To ensure cleanliness of the contacts, samples are broken in pure solvent (dimethyl sulfoxide, DMSO). They are operated for one or two hours at a typical current set-point of 200 pA before measurements begin, to allow mechanical relaxation of the bending beam, and thus stabilization of the electrode distance. We then feed the sample with 10 μL of solution and set a current set-point in the sub nA range. This current imposes the distance between the gold electrodes, and after stabilization, the feedback loop controlling the electrode separation is disabled. We then observe the temporal evolution of the current flowing through the contact. A connection or disconnection of a molecule between the 2 electrodes is expected to induce a sharp change (stepwise) in the current. If we do not observe such events, the feedback is enabled, and the set-point is increased (reducing electrode separation). These operations are repeated until we observe abrupt current jumps (see a typical exemple figure S3, in the supporting information). Current histograms and single molecule conductance are extracted from these measurements as reported in Ref. 56 and detailed in the supporting information.
Theoretical modeling.
Single molecule in gas phase. First principles ab-initio calculations were performed using the
Gaussian software.57 The geometries were optimized using density functional theory in the
framework of the B3LYP functional,58 6-311g basis set and the GDISS optimization
algorithm.59 The influence of pH through proton exchanges at the molecular level is not
simple to simulate, due to the interplay of dielectric and solvation effects.60 Another issue for
to equilibrate the total charge of the system.61 To cope with this issue, we have used a cluster
model as defined in Ref. 62 (see the Supporting Information). For each molecule (A and B) and protonation states, we have calculated the HOMO-LUMO gap, the wave function distributions, the electron affinity (EA) and the ionization potential (IP). The theoretical optical absorption was determined using Time Dependent Functional Density theory calculations (TDDFT).
Metal/molecule/metal junction. To calculate the electron transport through these molecules
when a metal/molecule/metal junction is formed, we use a combination of the SIESTA code,63
which enables the extraction of a Hamiltonian describing the junction and the quantum transport code Gollum.64 The calculation utilizes a double-ζ plus polarization orbitals basis
set and the GGA65 exchange correlational functional. To calculate the protonated form, we
control the charge on the counter ions (Cl-) via the atomic basis set (see Supporting
Information). The zero-bias transmission coefficient T(E) is then calculated as a function of the electron energy E. This is then used to evaluate the conductance and electrical current via the Landauer formula.
Results and discussion.
Structural characterization of SAMs.
XPS measurements show that the SAMs of molecules A and B are well formed on the Au surfaces. We observed the peaks of C1s, S2p and N1s with the expected S/C and N/C ratios (see figure S4 and Table S1, Supporting Information). The S2p spectra (for both molecules) showed the contributions of the S-Au bond and the free thiol end-group (Fig. S5, Supporting Information). The N1s spectra showed several peaks (3 for SAM A, 2 for SAM B, Fig. S6, Supporting Information) attributed to the different chemical environments of the N atoms (see
discussion, Supporting Information). Table 1 presents the thickness of SAMs A and B measured by ellipsometry before and after the acid/base treatments. The theoretical length of molecules A and B are estimated to 1.9 nm (see geometry optimization, Supporting Information). It appears that SAM B (thickness ~1.9 nm) is denser and better organized than SAM A (thickness ~ 1.3 nm, thus an average tilt angle of the molecule of ~ 50° with respect to the surface normal). This difference can be explained by the more planar shape of molecule B, which is more favorable to a compact stacking. The treatments with vapors of hydrochloric acid and triethylamine do not induce a significant variation of the thickness of SAMs A and B, indicating a good stability.
Table 1. Thickness (in nm) measured by ellipsometry for SAMs A and B before (pristine) and
after the acid and base treatments. Average values from 2-3 samples and 3 measurements at different places on each samples.
Electrical characterization.
SAM on flat TSAu surfaces characterized by C-AFM.
We measured the electron transport properties in molecular junctions, which consist of SAMs on flat TSAu electrodes, and contacted by C-AFM. For this purpose, the loading force of the
C-AFM tip is kept very low (around 5 nN) in order to avoid any mechanical deformation of the SAM (< 0.1 nm) and consequently any modification of its electronic properties.66-68 The
I-V curves were accumulated over different zones (typically 4) of the sample, and after
pristine HCl exposure NEt3 exposure
SAM A 1.3 ± 0.2 1.3 ± 0.2 1.5 ± 0.2
removing the short-circuited curves (corresponding to curves with current reaching compliance saturation of the C-AFM preamplifier at very low voltage around few mV) we end-up with 103 to 104 I-V curves (see I-V curves in Fig. S7, Supporting Information). The
current histograms were constructed from these curves at a fixed voltage (35, 70, 140 and 200 mV) for SAMs after fabrication (pristine), after protonation and after conversion back to the neutral state (Figure 1 at 200 mV, other data at lower voltages in the Supporting Information, Figs. S8 and S9) according to the procedure described in the experimental section. These current histograms were well fitted by one log-normal distribution (parameters given in figure caption and table S2, Supporting Information).
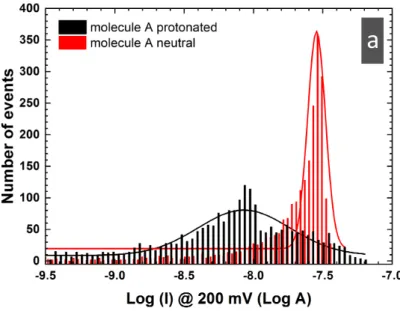
For both SAMs of molecules A and B, the current distributions are shifted by the protonation and the back conversion to the neutral state of the molecules, and we observe that the mean current for the pristine SAM has an intermediate value between the mean currents measured on the protonated and neutral SAMs. Specifically for the molecule A (Figure 1-a), the mean current initially measured at 4.8x10⁻⁹A for the pristine SAM is between the mean
current of the protonated SAM of 1.5x10⁻⁹A and the neutral SAM at 1.4x10⁻⁸A. For molecule
B, the mean currents for the pristine, protonated and neutral SAMs are measured at 8.3x10⁻¹⁰ A, 2.0x10⁻⁹A and 3.2x10⁻¹⁰A respectively (Figure 1-b). It is likely that in the "pristine" case,
just after the SAM grafting, there is a mix of neutral and protonated molecules. Thus, we observed that the molecule A is more conducting in the neutral state, while the molecule B exhibits a higher conductance in the protonated state. The ratios of the mean currents are Ineu(A)/Ipro(A)=9.3 and Ipro(B)/Ineu(B)=6.3 for molecule A and B, respectively (table 2).
!
Figure 1. Histograms of the current at a fixed bias of 200 mV for (a) SAM of molecule A after
fabrication (3698 junctions) in black (log µ = -8.32 (4,8x10⁻⁹ A), log σ = 0.57), after
protonation in red (1588 junctions, log µ = -8.81 (1.5x10⁻⁹ A), log σ = 0.36) and after
converted back to the neutral state in green (1186 junctions, log µ = -7.86 (1.4x10⁻⁸ A), log σ
= 0.69); (b) SAM of molecule B after fabrication (6096 junctions, log µ = -9.08 (8.3x10⁻¹⁰ A),
log σ = 0.56) in black, after protonation in red (9338 junctions, log µ = -8.69 (2x10⁻⁹ A), log σ
a
= 0.50) and after converted back to the neutral state in green (5034 junctions, log µ = -9.50 (3.2x10⁻¹⁰ A), log σ = 0.68). Solid lines are the log-normal distributions fitted on the data.
These current histograms were measured for successive cycles of protonation and back conversion to the neutral state for the two molecular junctions. The parameters (mean current and standard deviation) of the fitted log-normal distributions for these histograms are plotted in figure 2. The opposite behaviors of the conductance variations upon protonated/ neutral is reproduced for 3 cycles albeit we observe a progressive decrease of the current ratios.
!
Figure 2. Plot of the log mean current and standard deviation (plotted as error bar) of the
fitted log-normal distributions for the current histograms measured by C-AFM at 200 mV for the two molecules and for 3 successive cycles of protonation (acid) and back conversion to
the neutral form (basic).
0.0 0.5 1.0 1.5 2.0 2.5 3.0 -10.5 -10.0 -9.5 -9.0 -8.5 -8.0 -7.5 Molecule B Molecule A < L o g I > @ 2 0 0 m V ( L o g A ) Cycle
For molecules A, the ratios Ineu(A)/Ipro(A) are 9.3, 4.1 and 2.2. For molecule B, we get Ipro(B)/
Ineu(B) ratios of 6.3, 2.1 and 1.2 for the three cycles. This “fatigue” effect, usually observed in
molecular switches (optical,69 redox22 or pH29), may have several causes (molecule desorption
or degradation, uncontrolled chemical reactions,…) and strategies have been recently demonstrated (e.g. mixed SAMs with alkylthiols) to maximize the conductance switching and reduce this fatigue effect.70, 71
Table 2. Switching ratios for molecules A and B measured at 3 scale lengths by 3 approaches,
and theoretical calculations (n.m. :not measured)
Molecules grafted on sub-10 nm nanodots (NMJ) and characterized by C-AFM.
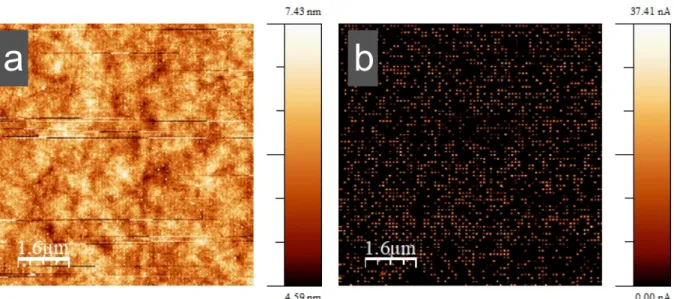
The changes in the molecular junction conductance for the protonated and neutral states of the molecules were also assessed with another platform of smaller size, made from hundreds of molecules grafted onto tiny crystalline Au nanodots and contacted by C-AFM (NMJ).52, 53 The
current is measured by scanning the array of NMJs, with a C-AFM tip at a given bias applied on the substrate. A current is measured only when the tip is localized on the molecular junction (Fig. 3).52 The current through the native SiO2 covering the space between the
nanodots is below the detection limit of our apparatus. C-AFM images on this array of nanodot/molecules junctions taken at + 200 mV for both the molecules and for the two states (neutral and protonated) are shown in the supporting information (Fig. S10). From these C-AFM images and with help of the Gwyddion software,50 we extract a value of the current for
MCBJ NMJ SAM/AuTS theory
A (Gneu/Gpro) n.m. 3.4 9.3 6
each electrically active nanodot/molecules junctions in each C-AFM image, and we construct current histograms.52
!
Figure 3. Example of (a) topography image (nanodots are bright spots) and (b) current image
(bright spots are the current value of each NMJ) obtained simultaneously on NMJs of neutral molecules A and measured by C-AFM (loading force10 nN and Vbias = 200 mV). 2456 NMJs
are measured.
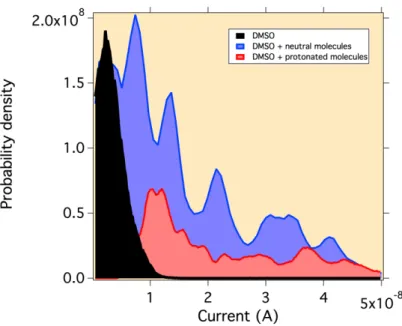
The current histograms at 200 mV for both the molecules and in both states (protonated and neutral) are presented in figure 4. These histograms are well fitted by log-normal distributions (solid lines) and the fitted parameters (log mean current, log μ, and log standard deviation, log σ) are given in table S2 (Supporting Information) and in the figure captions. We clearly observe a shift of the distribution between the protonated and neutral NMJs, with higher currents for the neutral molecule A (Gneu(A)>Gpro(A)) and a decrease of
the current for the neutral molecule B (Gpro(B)>Gneu(B)). We define Ipro and Ineu as the mean
current value after protonation and after converted back to the neutral state, respectively, we obtain I (A)=8.5x10⁻⁹A and I (B)=4.2x10⁻⁸A for molecule A and B, respectively, and
Ineu(A)=2.9x10⁻⁸A and Ineu(B)=1.7x10⁻⁸A for molecule A and B, respectively. These current
values lead to ratios of conductances Ineu(A)/Ipro(A)=3.4 and Ipro(B)/Ineu(B)=2.5 for molecule
A and B, respectively, a little bit smaller then on TSAu surfaces (table 2). This inversion of the ratios with the nature of the side chains of the molecule will be further discussed in the theoretical section below.
�
Figure 4. Histograms of the current at a fixed bias (200 mV) measured by C-AFM on (a)
array of NMJs of molecule A after protonation in black (2445 junctions, log µ = -8.07 (8.5x10⁻⁹ A), log σ = 0.33) and for neutral molecules in red (2456 junctions, log µ = -7.54
(2.9x10⁻⁸ A), log σ = 0.05); (b) NMJs of molecule B after protonation in black (1634
junctions, log µ = -7.38 (4.2x10⁻⁸ A), log σ = 0.29) and for neutral molecules in red (1154
a
junctions, log µ = -7.78 (1.7x10⁻⁸ A), log σ = 0.51). Solid lines are the log-normal
distributions fitted on the data.
Single molecule conductance measurements by MCBJ.
Finally, we compare these results with single molecule experiments using the MCBJ technique. Following the protocol described in the experimental section, we performed single molecule conductance measurements on molecules A and B, starting with a millimolar solution of the neutral molecules in DMSO. However, we never obtained stable molecular junctions for the molecule A, which we attribute to steric hindrance caused by the bulkier side groups. Therefore, only results for molecule B are reported here. Figure 5 shows the histograms constructed from current recordings at Vbias = 35 mV (a typical current vs. time
trace is given figure S11 in the supporting information) for a MCBJ operated in pure DMSO, in a millimolar solution of neutral and protonated molecule B. While the histogram of currents for the molecule B exhibits a series of evenly spaced current peaks, the measurement performed in pure DMSO does not exhibit such features. Moreover, the current histogram after protonation is shifted to higher currents. Measurements are realized for bias voltage of 35, 70 and 140 mV following the same protocol (for comparison with the C-AFM results). Similar current histograms are obtained (see figures S11-S13 for Vbias = 35, 70 and 140 mV,
Supporting Information). Measurements at higher bias voltages (i.e. 200 mV) are not reported here, because molecular junctions become unstable above 140 mV. These instabilities are attributed to electromigration processes in the metallic electrodes, and current-induced heating of the molecular junction.72
�
Figure 5. Histograms of currents (at Vbias = 35 mV) measured with the MCBJ in pure DMSO
(dark) and in a 1 mM solution of molecules B in the neutral state (blue) and protonated state (red). The current histogram after protonation is shifted to higher currents, see text and Figs. 6 and S17 (in the supporting information) for the data analysis (multi-peak) and the single molecule conductance determination.
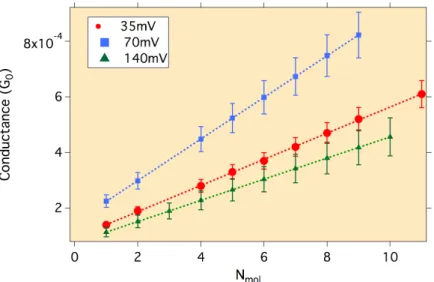
We obtained complex conductance histograms, which prevent us from a straightforward analysis. We thus developed an automated analysis protocol (see more details in the supporting information). In brief, from the current histograms converted to conductance, we calculate the differences between the most probable current values (peaks in Fig. 5). If these differences correspond to connection/disconnection of molecules in the contact, they should share a common multiple, the conductance of a single molecule. We plot in figure 6 the peaks of conductance versus a discrete number of molecules NMOL. Arbitrarily,
the lowest conductance value (lowest current peak) is attributed to NMOL = 1, since we do not
observe current jumps of lower amplitude. These plots clearly show that for all the measurements, the conductance values are fitted by a linear function f(NMOL) = GMOL NMOL,
(i.e. peaks), which reflects the stochastic nature of these molecular junctions. The conductance values are expressed in the conductance quantum units, G0 = 2e2/h (7.75x10⁻⁵ S), with e the
electron charge and h the Planck constant. The extracted GMOL values are reported in table 3.
We note that the conductances vary with the applied voltage, while the conductances of the SAMs (see Table S3, Supporting Information) are not dependent on the voltage (linear I-V regime < 200 mV). However, conductances of single molecules is very sensitive to the atomic details of the molecule/electrode contact. For example, it has been reported73, 74 that the
conductance depends whether the molecule is connected on a hollow site of the gold surface or to a gold ad-atom (this variability being averaged in a larger area junction).75
!
Figure 6. Conductance values of the peaks observed in the histograms of Fig. 5 (and figures
S9-S11) versus a number of molecules (neutral molecule B). A linear fit gives the GMOL values
reported in table 2 for the 3 applied voltages. Conductance values are given in conductance quantum units, G0.
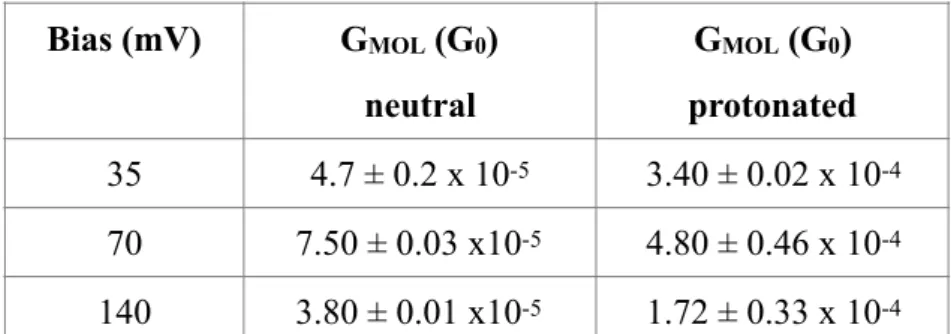
Table 3 : Values of the molecule conductance, Gmol, at several voltages and in the neutral
(from data Fig. 6) and protonated forms (data Fig S17 in the supporting information).
We have then applied the same measurement and analysis protocol to the protonated molecule B (Figs. S14-S16 in the supporting information). The protonation is operated in-situ by exposing the junction with molecules to HCl vapors for one minute. After the exposition, the base tunneling current in the junction, for given electrode separation, increases by approximately one order of magnitude. This current increase is attributed to the dissolution of acid in the solvent, leading to the opening of an ionic current channel in the junction. One of the main benefits of the measurement and analysis method used here, lies in eliminating the constant (or slowly varying) tunneling or ionic contribution to the net conductance.56 In these
conditions, it makes sense to compare conductance values of protonated and neutral molecules. Table 3 gathers the conductance values obtained for neutral and protonated molecules B at Vbias = 35, 70 and 140 mV (see supporting information, figures S14-S16 given
the corresponding current traces and histograms of currents and figure S17 for the GMOL vs.
NMOL plots). In all cases, the conductance of protonated molecules is higher than the
conductance of the neutral ones. From these values, we can calculate a conductance ratio between protonated and neutral molecule ranging from 4.5 to 6.5 (table 2). These results show that we have operated a molecular switch, using a chemical stimulus, at the scale of a single molecule. Bias (mV) GMOL (G0) neutral GMOL (G0) protonated 35 4.7 ± 0.2 x 10⁻⁵ 3.40 ± 0.02 x 10⁻⁴ 70 7.50 ± 0.03 x10⁻⁵ 4.80 ± 0.46 x 10⁻⁴ 140 3.80 ± 0.01 x10⁻⁵ 1.72 ± 0.33 x 10⁻⁴
Modeling molecules in gas phase
We first calculated the optimized geometries, the electron affinity (EA), the ionization potential (IP) and the HOMO-LUMO gap for molecules A and B in the neutral and protonated forms (Figs. S18-S20, Supporting Information). For molecule A, we considered the 4H+ and 2H+ cases, and we find that the HOMO-LUMO gap is the same in the two cases (Fig. S19, Supporting Information). Basically, the protonation tends to reduce the HOMO-LUMO gap of the molecules and increases the IP and EA. Both the HOMO and the HOMO-LUMO of molecules A and B are characterized by highly delocalized wave functions. The protonation of the nitrogen atoms strongly modify the nature of the HOMO as it becomes strongly localized on the protonation sites i.e. on the chloride counter-ion. On the contrary, the LUMO wave functions remain strongly delocalized on the aromatic cycles.
Modeling electron transport in metal/molecule/metal junctions
To explain this switching behavior, we calculated electron transport through the two molecules when attached to gold electrodes. The transmission curves T(E) in Figure 7 show the gap between the HOMO and LUMO resonances is approximately 2eV. To perform a comparison between molecule A and B, we first calculate their transport properties for identical contacting geometries as shown in Figure 7. Molecule A in the neutral form shows that the DFT predicted Fermi energy (EF0) lies close to the HOMO resonance and gives a conductance value of 0.06G0. Upon protonation, the HOMO-LUMO gap is decreased and the position of the Fermi energy lies in the middle of the gap. The value of conductance decreases to 0.01G0 in agreement with trend shown in the SAM measurement of figures 1 and 4. The
thickness of the SAM ~ 1.3nm compared to the molecule length (1.8nm) means the molecule forms a more tilted geometry in the SAM. However, we find that the general trend upon protonation is not dependent on the contact angle geometry (figure S24, Supporting Information). Also, electron transport though tilted molecule A contacting the gold electrode though the NH2 anchor group can be discarded, since the conductance is 3 orders of magnitude lower (Fig. S25, Supporting Information).
For molecule B, we find that the DFT calculation positions the Fermi energy close to the HOMO, leading to a similar transmission for Molecule A (Figure S22, Supporting Information). However, the calculated IP of molecule B is larger than A (meaning the HOMO is at a lower energy). Figure S19 (Supporting Information) shows this difference to be ~ 0.5eV, and therefore we shift the Fermi energy by this amount and define EF1 = EF0+0.5eV (Fig. 7b). The value of the conductance for the neutral case at EF1 is 0.002G0. Protonation again decreases the HOMO-LUMO gap, but now the transmission is higher at E-EF1 = 0eV and the conductance now increases to a value of 0.03G0, again in agreement with the measured trend (Figs. 1, 4 and 6). Also, the predicted conductance is much larger than the measured value of G (Table 3), which can be attributed to the underestimation of the HOMO-LUMO gap. However the conductance ratios for molecular A Gneu/Gpro = 6 and Gpro/Gneu = 15 for molecule B are in agreement with our measured ratios (Table 2). Thus, the changing behavior on protonation between molecule A and B can be attributed to the difference in the relative position of the HOMO resonance with respect to the Fermi energy.
�
Figure 7. Zero bias transmission coefficient T(E) for molecule A (a) and molecule B (b) in a linear geometry for the protonated (black lines) and neutral (red lines) forms.
Conclusion.
A multi-scale characterization of the electron transport though molecular junction upon protanation demonstrates that their conductance switching depends on the lateral functional groups. The molecular conductances were measured at 3 scale lengths : self-assembled monolayers on flat Au surfaces, about hundred molecules grafted on Au nanodots (measured by C-AFM in these two cases) and single molecules by mechanically controlled break junction, and. These 3 approaches demonstrate that the effect of pH modulation on the molecule conductance can be controlled by side chain chemistry. A benzo-bis(imidazole) molecule shows a higher conductance in the neutral state (Gneu>Gpro) when laterally
functionalized by amino-phenyl groups, while we observe the reverse case (Gpro>Gneu) for the
H-substituted molecule. These results are understood with the help of theoretical calculations which attribute the different behaviors to the position of the HOMO resonances relative to the Fermi energy of the electrodes.
Associated content
Supporting Information
The Supporting Information is available free of charge on website at DOI: xxxxx
Synthesis, NMR, UV-vis spectra, detailed protocols MCBJ measurements, XPS spectra, detailed current vs. time traces during MCBJ measurements, C-AFM images on NMJs, C-AFM current-voltage curves on TSAU/SAM, calculated optimized
geometries, calculated electronic structures, calculated molecular orbitals, calculated optical absorption curves and calculated electron transport in metal/molecule/metal junctions.
Author information
Author contributions
H.A., Z.C., A.H., F.X. and O.S. synthesized the molecules, optimized the procedures, and characterized the compounds by spectroscopy (NMR and UV-vis measurements). Y.V., D.G. and S.L. fabricated the devices on gold nano dots and flat gold surfaces and carried out the C-AFM measurements. D.G. performed the XPS measurements. M.I. and H.K. did the single molecule conductance measurements. C.K. performed the theoretical calculations for
molecules in gas phase. N.A., I.M.G and C.J.L carried out the electron transport calculations of the molecular junctions. O.S., D.V. and H.K. conceived the experiments and supervised the project. D.V., O.S., D.G., C.K., S.L., I.M.G, C.J.L. and H.K. wrote the paper with the help and contributions of all the authors.
Corresponding authors * [email protected] * [email protected] * [email protected] * [email protected] * [email protected] ORCID H. Audi: 0000-0001-9291-9409 A. Heynderickx: 0000-0002-4991-6592 I.M. Grace: 0000-0001-8686-2290 C.J. Lambert: 0000-0003-2332-9610 O. Siri: 0000-0001-9747-3813 D.Vuillaume: 0000-0002-3362-1669 S Lenfant: 0000-0002-6857-8752 H. Klein: 0000-0002-8625-4778 Notes
The authors declare no competing financial interest.
Acknowledgments
This work was funded by the ANR grant FOST (ANR-12-BS10-01801). We thank Dominique Deresmes (IEMN) for help and advices (C-AFM measurements). Support from the UK EPSRC is acknowledged, through grant nos. EP/N017188/1, EP/M014452/1, EP/P027156/1 and EP/N03337X/1. Support from the European Commission is provided by the FET Open project 767187 – QuIET.
References
1. van der Molen, S. J.; Liljeroth, P., Charge transport through molecular switches. J
Phys Condens Matter 2010, 22, 133001.
2. Ramachandran, G. K.; Hopson, T. J.; Rawlett, A. M.; Nagahara, L. A.; Primak, A.; Lindsay, S. M., A bond-fluctuation mechanism for stochastic switching in wired molecules.
Science 2003, 300 (5624), 1413-1416.
3. Van Der Molen, S. J.; Vegte, H. V. D.; Kudernac, T.; Amin, I.; Feringa, B. L.; Wees, B. J. V., Stochastic and photochromic switching of diarylethenes studied by scanning
tunnelling microscopy. Nanotechnology 2005, 17 (1), 310-314.
4. Jang, S.-Y.; Reddy, P.; Majumdar, A.; Segalman, R. A., Interpretation of stochastic events in single molecule conductance measurements. Nano Lett 2006, 6 (10), 2362-7. 5. Battaglini, N.; Klein, H.; Hortholary, C.; Coudret, C.; Maurel, F.; Dumas, P., STM observation of a single diarylethene flickering. Ultramicroscopy 2007, 107 (10), 958-962. 6. Moore, A.; Mantooth, B.; Donhauser, Z.; Yao, Y.; Tour, J.; Weiss, P., Real-time measurements of conductance switching and motion of single oligo (phenylene ethynylene) molecules. J. Am. Chem. Soc 2007, 129 (34), 10352-10353.
7. Bellini, B.; Ackermann, J.; Klein, H.; Grave, C.; Dumas, P.; Safarov, V., Light-induced molecular motion of azobenzene-containing molecules: a random-walk model. J
Phys Condens Matter 2006, 18, S1817-S1835.
8. Katsonis, N.; Lubomska, M.; Pollard, M. M.; Feringa, B.; Rudolf, P., Synthetic light-activated molecular switches and motors on surfaces. Progress in Surf. Sci. 2007, 82,
407-434.
9. Ferri, V.; Elbing, M.; Pace, G.; Dickey, M. D.; Zharnikov, M.; Samorì, P.; Mayor, M.; Rampi, M. A., Light-Powered Electrical Switch Based on Cargo-Lifting Azobenzene Monolayers. Angew. Chem. Int. Ed. 2008, 47 (18), 3407-3409.
10. Kumar, A. S.; Ye, T.; Takami, T.; Yu, B.-C.; Flatt, A. K.; Tour, J. M.; Weiss, P. S., Reversible Photo-Switching of Single Azobenzene Molecules in Controlled Nanoscale Environments. Nano Lett. 2008, 8 (6), 1644-1648.
11. Mativetsky, J. M.; Pace, G.; Elbing, M.; Rampi, M. A.; Mayor, M.; Samori, P., Azobenzenes as Light-Controlled Molecular Electronic Switches in Nanoscale Metal-Molecule-Metal Junctions. J. Am. Chem. Soc. 2008, 130 (29), 9192-9193.
12. Smaali, K.; Lenfant, S.; Karpe, S.; Oçafrain, M.; Blanchard, P.; Deresmes, D.; Godey, S.; Rochefort, A.; Roncali, J.; Vuillaume, D., High On−Off Conductance Switching Ratio in Optically-Driven Self-Assembled Conjugated Molecular Systems. ACS Nano 2010, 4 (4), 2411-2421.
13. Irie, M., Diarylethenes for Memories and Switches. Chem Rev 2000, 100 (5), 1685-1716.
14. Katsonis, N.; Kudernac, T.; Walko, M.; Van der Molen, S.; Van Wees, B.; Feringa, B., Reversible conductance switching of single diarylethenes on a gold surface. Adv. Mat.
2006, 18 (11), 1397-1400.
15. Kronemeijer, A. J.; Akkerman, H. B.; Kudernac, T.; Van Wees, B. J.; Feringa, B. L.; Blom, P. W. M.; De Boer, B., Reversible Conductance Switching in Molecular Devices. Adv.
Mater. 2008, 20 (8), 1467-1473.
16. van der Molen, S. J.; Liao, J.; Kudernac, T.; Agustsson, J. S.; Bernard, L.; Calame, M.; van Wees, B. J.; Feringa, B. L.; Schönenberger, C., Light-controlled conductance switching of ordered metal-molecule-metal devices. Nano Letters 2009, 9 (1), 76-80. 17. Liljeroth, P.; Repp, J.; Meyer, G., Current-induced hydrogen tautomerization and conductance switching of naphthalocyanine molecules. Science 2007, 317, 1203-1206. 18. Gittins, D. I.; Bethell, D.; Schiffrin, D. J.; Nichols, R. J., A nanometer-scale electronic switch consisting of a metal cluster and redox-addressable groups. Nature 2000,
408, 67-69.
19. Liu, Z.; Yasseri, A. A.; Lindsey, J. S.; Bocian, D. F., Molecular memories that survive silicon device processing and real-world operation. Science 2003, 302, 1543-1545.
20. Roth, K. M.; Yasseri, A. A.; Liu, Z.; Dabke, R. B.; Malinovskii, V.; Schweikart, K.-H.; Yu, L.; Tiznado, K.-H.; Zaera, F.; Lindsey, J. S.; Kuhr, W. G.; Bocian, D. F.,
Measurements of electron-transfer rates of charge-storage molecular monolayers on Si(100). Towards hybrid molecular/semiconductor information storage devices. J. Am. Chem. Soc.
21. Mahapatro, A.; Ying, J.; Ren, T.; Janes, D., Electronic Transport through Ruthenium-Based Redox-Active Molecules in Metal− Molecule− Metal Nanogap Junctions. Nano Letters
2008, 8 (8), 2131-2136.
22. Liao, J.; Agustsson, J. S.; Wu, S.; Schönenberger, C.; Calame, M.; Leroux, Y.; Mayor, M.; Jeannin, O.; Ran, Y.-F.; Liu, S.-X.; Decurtins, S., Cyclic Conductance Switching in Networks of Redox-Active Molecular Junctions. Nano Lett 2010, 10 (3), 759-764.
23. Zhou, J.; Wang, K.; Xu, B.; Dubi, Y., Photoconductance from Exciton Binding in Molecular Junctions. J Am Chem Soc 2017, 140 (1), 70-73.
24. Morteza Najarian, A.; Bayat, A.; McCreery, R. L., Orbital Control of Photocurrents in Large Area All-Carbon Molecular Junctions. J Am Chem Soc 2018, 140 (5), 1900-1909. 25. Pourhossein, P.; Vijayaraghavan, R. K.; Meskers, S. C. J.; Chiechi, R. C., Optical modulation of nano-gap tunnelling junctions comprising self-assembled monolayers of hemicyanine dyes. Nat Commun 2018, 7, 11749.
26. Najarian, A. M.; McCreery, R. L., Long-Range Activationless Photostimulated Charge Transport in Symmetric Molecular Junctions. ACS Nano 2019, 13 (1), 867-877.
27. Morales, G. M.; Jiang, P.; Yuan, S.; Lee, Y.; Sanchez, A.; You, W.; Yu, L., Inversion of the rectifying effect in diblock molecular diodes by protonation. J Am Chem Soc 2005, 127 (30), 10456-10457.
28. Chen, F.; Li, X.; Hihath, J.; Huang, Z.; Tao, N. J., Effect of anchoring groups on single-molecule conductance: comparative study of thiom-, amine-, and carboxylic-acid-terminated molecules. J. Am. Chem. Soc. 2006, 128 (49), 15874-15881.
29. Guo, X.; Small, J. P.; Klare, J. E.; Wang, Y.; Purewal, M. S.; Tam, I. W.; Hong, B. H.; Caldwell, R.; Huang, L.; O'Brien, S.; Yan, J.; Breslow, R.; Wind, S. J.; Hone, J.; Kim, P.; Nuckolls, C., Covalently bridging gaps in single-walled carbon nanotubes with conducting molecules. Science 2006, 311, 356-359.
30. Ballesteros, L. M.; Martín, S.; Cortés, J.; Marqués-González, S.; Higgins, S. J.; Nichols, R. J.; Low, P. J.; Cea, P., Controlling the Structural and Electrical Properties of Diacid Oligo(Phenylene Ethynylene) Langmuir–Blodgett Films. Chem. Eur. J. 2013, 19 (17), 5352-5363.
31. Darwish, N.; Aragonès, A. C.; Darwish, T.; Ciampi, S.; Díez-Pérez, I.,
Multi-Responsive Photo- and Chemo-Electrical Single-Molecule Switches. Nano Lett 2014, 14 (12), 7064-7070.
32. Brooke, R. J.; Szumski, D. S.; Vezzoli, A.; Higgins, S. J.; Nichols, R. J.; Schwarzacher, W., Dual Control of Molecular Conductance through pH and Potential in Single-Molecule Devices. Nano Lett 2018, 18 (2), 1317-1322.
33. Ai, Y.; Kovalchuk, A.; Qiu, X.; Zhang, Y.; Kumar, S.; Wang, X.; Kühnel, M.; Nørgaard, K.; Chiechi, R. C., In-Place Modulation of Rectification in Tunneling Junctions Comprising Self-Assembled Monolayers. Nano Lett 2018, 18 (12), 7552-7559.
34. Kumar, S.; Merelli, M.; Danowski, W.; Rudolf, P.; Feringa, B. L.; Chiechi, R. C., Chemical Locking in Molecular Tunneling Junctions Enables Nonvolatile Memory with Large On–Off Ratios. Adv. Mater. 2019, 31, 1807831.
35. Zhang, Y.-P.; Chen, L.-C.; Zhang, Z.-Q.; Cao, J.-J.; Tang, C.; Liu, J.; Duan, L.-L.; Huo, Y.; Shao, X.; Hong, W.; Zhang, H.-L., Distinguishing Diketopyrrolopyrrole Isomers in Single-Molecule Junctions via Reversible Stimuli-Responsive Quantum Interference. J Am
Chem Soc 2018, 140 (21), 6531-6535.
36. Rogers, K. S.; Clayton, C. C., Effects of pH on benzimidazole fluorescence. Analytical
Biochemistry 1972, 48 (1), 199-201.
37. Kamplain, J. W.; Bielawski, C. W., Dynamic covalent polymers based upon carbene dimerization. Chem. Commun. 2006, 5 (16), 1727.
38. Le, H. T. M.; El-Hamdi, N. S.; Miljanić, O. Š., Benzobisimidazole Cruciform Fluorophores. The Journal of Organic Chemistry 2015, 80 (10), 5210-5217.
39. Bunzen, H.; Mahmood, F.; Grzywa, M.; Volkmer, D., Zinc(II) Coordination
Frameworks Based on Benzobisimidazole: The Role of the Methyl Substituent. Eur. J. Inorg.
Chem. 2017, 2017 (45), 5395-5402.
40. Khramov, D. M.; Boydston, A. J.; Bielawski, C. W., Synthesis and Study of Janus Bis(carbene)s and Their Transition-Metal Complexes. Angew. Chem. Int. Ed. 2006, 45 (37), 6186-6189.
41. Shilova, E. A.; Heynderickx, A.; Siri, O., Bandrowski’s Base Revisited: Toward a Unprecedented Class of Quinonediimines or New Two-Way Chromophoric Molecular Switches. J Org Chem 2010, 75 (6), 1855-1861.
42. Audi, H.; Chen, Z.; Charaf-Eddin, A.; D’Aléo, A.; Canard, G.; Jacquemin, D.; Siri, O., Extendable nickel complex tapes that reach NIR absorptions. Chem. Commun. 2014, 50 (96), 15140-15143.
43. Novo, M.; Mosquera, M.; Prieto, F. R., Prototropic equilibria of
2-pyridylbenzimidazoles in aqueous solution. Canadian Journal of Chemistry 1992, 70 (3), 823-827.
44. Weiss, E.; Chiechi, R.; Kaufman, G.; Kriebel, J.; Li, Z.; Duati, M.; Rampi, M.; Whitesides, G., Influence of defects on the electrical characteristics of mercury-drop
junctions: self-assembled monolayers of n-alkanethiolates on rough and smooth silver. J. Am.
Chem. Soc 2007, 129 (14), 4336-4349.
45. Weiss, E. A.; Kaufman, G. K.; Kriebel, J. K.; Li, Z.; Schalek, R.; Whitesides, G. M., Si/SiO 2-Templated Formation of Ultraflat Metal Surfaces on Glass, Polymer, and Solder Supports: Their Use as Substrates for Self-Assembled Monolayers. Langmuir 2007, 23 (19), 9686-9694.
46. Ulman, A., An introduction to ultrathin organic films : from Langmuir-Blodgett to Self-assembly. Academic press: Boston, 1991.
47. Rabe, J. P.; Knoll, W., An ellipsometric method for the characterization of macroscopically heterogeneous films. Optics Communications 1986, 57 (3), 189-192. 48. Love, J. C.; Estroff, L. A.; Kriebel, J. K.; Nuzzo, R. G.; Whitesides, G. M., Self-assembled monolayers of thiolates on metals as a form of nanotechnology. Chem. Rev. 2005,
105 (4), 1103-1169.
49. Shirley, D. A., High-Resolution X-Ray Photoemission Spectrum of the Valence Bands of Gold. Phys. Rev. B 1972, 5, 4709-4714.
50. Necas, D.; Klapetek, P., Gwyddion: an open-source software for SPM data anylsis.
51. Horcas, I.; Fernández, R.; Gómez-Rodríguez, J. M.; Colchero, J.; Gómez-Herrero, J.; Baro, A. M., WSXM: A software for scanning probe microscopy and a tool for
nanotechnology. Rev. Sci. Instrum. 2007, 78 (1), 013705.
52. Smaali, K.; Clement, N.; Patriarche, G.; Vuillaume, D., Conductance Statistics from a Large Array of Sub-10 nm Molecular Junctions. ACS Nano 2012, 6 (6), 4639-4647.
53. Clement, N.; Patriarche, G.; Smaali, K.; Vaurette, F.; Nishiguchi, K.; Troadec, D.; Fujiwara, A.; Vuillaume, D., Large Array of Sub-10-nm Single-Grain Au Nanodots for use in Nanotechnology. Small 2011, 7 (18), 2607-2613.
54. Trasobares, J.; Vaurette, F.; Francois, M.; Romijn, H.; Codron, J. L.; Vuillaume, D.; Theron, D.; Clement, N., High speed e-beam lithography for gold nanoarray fabrication and use in nanotechnology. Beilstein Journal of Nanotechnology 2014, 5, 1918-1925.
55. Alwan, M.; Candoni, N.; Dumas, P.; Klein, H. R., Statistical evidence of strain induced breaking of metallic point contacts. The European Physical Journal B 2013, 86 (6), 243.
56. Gil, M.; Malinowski, T.; Iazykov, M.; Klein, H. R., Estimating single molecule conductance from spontaneous evolution of a molecular contact. J. Appl. Phys. 2018, 123 (10), 104303.
57. Frisch, M. J.; Trucks, G. W.; Schlegel, H. B.; Robb, G.; Cheeseman, J. R.;
Montgomery Jr, J. A.; Iyengar, S. S., Gaussian03-Version c01. Gaussian Inc Wallingford CT
2004.
58. Becke, A. D., Density-functional thermochemistry. III. The role of exact exchange.
The Journal of Chemical Physics 1993, 98 (7), 5648-5652.
59. Farkas, Ö.; Schlegel, H. B., Methods for optimizing large molecules. Part III. An improved algorithm for geometry optimization using direct inversion in the iterative subspace (GDIIS). Physical Chemistry Chemical Physics 2002, 4 (1), 11-15.
60. Bürgi, R.; Kollman, P. A.; van Gunsteren, W. F., Simulating proteins at constant pH: An approach combining molecular dynamics and Monte Carlo simulation. Proteins:
Structure, Function, and Bioinformatics 2002, 47 (4), 469-480.
61. Ibragimova, G. T.; Wade, R. C., Importance of Explicit Salt Ions for Protein Stability in Molecular Dynamics Simulation. Biophysical Journal 1998, 74 (6), 2906-2911.
62. Singh, U. C.; Kollman, P. A., A combined ab initio quantum mechanical and molecular mechanical method for carrying out simulations on complex molecular systems: Applications to the CH3Cl + Cl− exchange reaction and gas phase protonation of polyethers. Journal of
Computational Chemistry 1986, 7 (6), 718-730.
63. Soler, J. M.; Artacho, E.; Gale, J. D.; Garcia, A.; Junquera, J.; Ordejon, P.; Sanchez-Portal, D., The SIESTA method ad initio order-N materials simulation. Journal of Physics
Condensed Matter 2002, 14 (11), 2745.
64. Ferrer, J.; Lambert, C. J.; García-Suárez, V. M.; Manrique, D. Z.; Visontai, D.; Oroszlany, L.; Rodríguez-Ferradás, R.; Grace, I.; Bailey, S. W. D.; Gillemot, K.; Sadeghi, H.; Algharagholy, L. A., GOLLUM: a next-generation simulation tool for electron, thermal and spin transport. New Journal of Physics 2014, 16 (9), 093029.
65. Perdew, J. P.; Burke, K.; Ernzerhof, M., Generalized Gradient Approximation Made Simple. Physical Review Letters 1996, 77 (18), 3865-3868.
66. Engelkes, V. B.; Beebe, J. M.; Frisbie, C. D., Analysis of the Causes of Variance in Resistance Measurements on Metal-Molecule-Metal Junctions Formed by Conducting-Probe Atomic Force Microscopy. The Journal of Physical Chemistry B 2005, 109 (35),
16801-16810.
67. Engelkes, V. B.; Daniel Frisbie, C., Simultaneous nanoindentation and electron
tunneling through alkanethiol self-assembled monolayers. The Journal of Physical Chemistry
B 2006, 110 (20), 10011-10020.
68. Smaali, K.; Desbief, S.; Foti, G.; Frederiksen, T.; Sanchez-Portal, D.; Arnau, A.; Nys, J. P.; Leclere, P.; Vuillaume, D.; Clement, N., On the mechanical and electronic properties of thiolated gold nanocrystals. Nanoscale 2015, 7 (5), 1809-1819.
69. Viero, Y.; Copie, G.; Guerin, D.; Krzeminski, C.; Vuillaume, D.; Lenfant, S.; Cleri, F., High Conductance Ratio in Molecular Optical Switching of Functionalized Nanoparticle Self-Assembled Nanodevices. J. Phys. Chem. C 2015, 119, 21173-21183.
70. Kumar, S.; van Herpt, J. T.; Gengler, R. Y. N.; Feringa, B. L.; Rudolf, P.; Chiechi, R. C., Mixed Monolayers of Spiropyrans Maximize Tunneling Conductance Switching by
Photoisomerization at the Molecule–Electrode Interface in EGaIn Junctions. J Am Chem Soc
71. Kumar, S.; Soni, S.; Danowski, W.; Leach, I. F.; Faraji, S.; Feringa, B. L.; Rudolf, P.; Chiechi, R. C., Eliminating Fatigue in Surface-Bound Spiropyrans. The Journal of
Physical Chemistry C 2019, 123 (42), 25908-25914.
72. Huang, Z.; Xu, B.; Chen, Y.; Di Ventra, M.; Tao, N. J., Measurement of current-induced local heating in a single molecule junction. Nano Lett. 2006, 6 (6), 1240-1244. 73. Li, X.; He, J.; Hihath, J.; Xu, B.; Lindsay, S. M.; Tao, N., Conductance of single alkanedithiols: conduction mechanism and effect of molecule-electrode contacts. J Am Chem
Soc 2006, 128 (6), 2135-41.
74. Li, C.; Pobelov, I.; Wandlowski, T.; Bagrets, A.; Arnold, A.; Evers, F., Charge transport in single Au/alkanedithiol/Au junctions: coordination geometries and
conformational degrees of freedom. J. Am. Chem. Soc. 2008, 130 (1), 318-326.
75. Vuillaume, D., Molecular Electronics: From Single-Molecule to Large-Area Devices.