HAL Id: hal-03048724
https://hal-mines-albi.archives-ouvertes.fr/hal-03048724
Submitted on 9 Dec 2020HAL is a multi-disciplinary open access archive for the deposit and dissemination of sci-entific research documents, whether they are pub-lished or not. The documents may come from teaching and research institutions in France or abroad, or from public or private research centers.
L’archive ouverte pluridisciplinaire HAL, est destinée au dépôt et à la diffusion de documents scientifiques de niveau recherche, publiés ou non, émanant des établissements d’enseignement et de recherche français ou étrangers, des laboratoires publics ou privés.
Initial microstructure influence on Ti-Al-Mo-V alloy’s
superplastic deformation behavior and deformation
mechanisms
A.O. Mosleh, A.D. Kotov, Vanessa Vidal, A.G. Mochugovskiy, Vincent Velay,
A.V. Mikhaylovskaya
To cite this version:
A.O. Mosleh, A.D. Kotov, Vanessa Vidal, A.G. Mochugovskiy, Vincent Velay, et al.. Initial microstructure influence on Ti-Al-Mo-V alloy’s superplastic deformation behavior and deforma-tion mechanisms. Materials Science and Engineering: A, Elsevier, 2021, 802, pp.1-10/140626. �10.1016/j.msea.2020.140626�. �hal-03048724�
Initial microstructure influence on Ti-Al-Mo-V alloy’s superplastic deformation behavior and deformation mechanisms
A.O. Mosleh1,2, A.D. Kotov1, V. Vidal3, A.G. Mochugovskiy1, V. Velay3, A.V. Mikhaylovskaya1*
1
National University of Science and Technology “MISiS”, Leninsky Prospekt, 4, Moscow 119049, Russian Federation
2
Shoubra Faculty of Engineering, Benha University, Shoubra St. 108, Shoubra, P.O. 11629, Cairo, Egypt
3
Université de Toulouse, CNRS Mines Albi, INSA, ISAE, ICA (Institut Clément Ader), Campus Jarlard, 81013 ALBI Cedex 09, France
*corresponding author e-mail [email protected]
Abstract
Superplastic forming is an effective way to manufacture complex-shaped parts of titanium-based alloys. This paper studies the influence of the initial microstructure and its strain-induced evolution on superplastic deformation behavior and the formability of a titanium-based alloy. Two types of Ti-Al-V-Mo alloy samples having a different fraction of recrystallized grains before the start of the superplastic deformation were studied. The deformation behavior, including strain hardening and strain rate sensitivity of the flow stress, was analyzed in a temperature range of 775°C to 900°C and a strain rate range of 10-5 to 10-2 s-1. Strain-induced changes of the microstructure within the bulk of the samples and on the surface of the pre-polished samples were studied during superplastic deformation with a constant strain rate. The dynamic recrystallization and dynamic grain growth in the volume of the samples and the multiple slip bands on the samples’ surface were revealed after superplastic deformation. The grain structure evolution and slip bands localization depended on the samples’ initial microstructure. The results showed that the samples with an increased fraction of recrystallized grains exhibited better superplasticity and higher quality of the formed parts with a more uniform thickness distribution across the section than the samples with a lower initial recrystallized fraction.
Keywords: Superplasticity; Superplastic forming; Titanium alloys; Microstructural evolution; Slip
1. Introduction
Superplasticity is the capability of the metallic material to undergo an extremely large elongation at low stress without necking due to a high strain rate sensitivity of flow stress [1–3]. Superplastic forming (SPF) uses this phenomenon to produce high-quality complex-shaped parts that fit well with the die surface [4–6]. The SPF results in low residual stresses, a decrease of the welding joints and the components weight, and is appropriate for low-volume production, including airplane and space industries. This approach is considered valuable for fabricating Ti-based alloy sheets, owing to their limited low-temperature formability.
Grain boundary sliding is the main superplastic deformation mechanism, and the grain size predominantly controls superplastic behavior [1,3,6–8]. A fine-grained microstructure that remains stable at elevated temperatures is favorable for superplastic alloys [2,6]. Two types of microstructures providing excellent superplasticity are possible with metallic alloys. The first group of alloys exhibits an equiaxed recrystallized fine-grained structure with the domination of high-angle grain boundaries (HAGB) before the beginning of superplastic deformation [9,10]. The recrystallized grain structure is usually formed at heating up to the SPF temperature. This microstructural type is typical of various alloys, including materials processed by severe plastic deformation [11,12]. Superplastic alloys of the second microstructural type exhibit a non-recrystallized or partially recrystallized grain structure [9]. In these alloys, the dynamic recrystallization (DRX), occurring during superplastic deformation, allows the formation of a fine-grained structure promoting high elongations [9,13,14].
Apart from using high temperature and/or low strain rate, which are unsuitable for environmental and economic issues, the superplasticity of Ti-based alloys can be optimized in two main ways: (i) the modification of the alloys’ chemical composition by either adding alloying elements that can control the grain size [15, 16] and/or promote low-temperature superplasticity using β-stabilizing elements with high diffusivity in Ti [17] or (ii) by using advanced manufacturing procedures such as thermomechanical treatment or severe plastic deformation [18,19], which also provides superplasticity at desirable low temperatures and increased strain rates [20–23]. Two-phase Ti-based alloys typically demonstrate good grain size stability at a phase proportion of α/β near 50/50% due to developed interface boundaries, also facilitating grain boundary sliding [24, 25]. Moreover, the ductile and highly diffusive β-phase effectively accommodates grain boundary sliding [10,26,27]. For the same reasons, the dynamic grain growth (DGG) of the β-phase is usually more rapid than that of the α-phase [28]. To minimize the DGG effect and enhance superplasticity in several alloys, the volume fraction of the β-Ti phase should be decreased to 20-30% [6, 29].
Owing to its industrial importance, superplasticity of titanium alloys is a well-developed phenomenon [29–35]. Ti-6Al-4V is widely studied alloy that exhibits an equiaxed recrystallized structure before superplastic deformation [10,36,37]. Other Ti-based alloys are also of industrial interest, and their superplastic behavior and strain-induced microstructural evolution are documented in several research works [5,6]. The superplastic characteristics of the high-strength two-phase Ti-4Al-3Mo-1V alloy (Russian grade of VT14) with an initial mixed structure of elongated and equiaxed grains are addressed in [38,39]. The microstructural parameters of this alloy and their evolution during superplastic flow require further attention and understanding. The principal alloying element, Mo, might suppress the recrystallization and spheroidization processes during annealing due to its low diffusivity that can affect superplastic formability. For successful SPF, the microstructural evolution during superplastic deformation of the alloy and its influence on the deformation behavior also require detailed studies. The current work focuses on (i) studying the annealing effect and the strain-induced evolution of macrostructure and (ii) identifying the influence of the initial microstructural parameters on superplastic deformation behavior, deformation mechanisms, and superplastic formability of the Ti-4Al-3Mo-1V alloy. We investigated the superplastic deformation behavior and strain-induced microstructural changes in the bulk and on the surface of the samples of two sheets of the same composition. The sheets exhibited a similar grain size, but they were different in the fraction of initial elongated and recrystallized grains. Elevated temperature tensile tests, the superplastic forming of complex-shaped parts, and detailed microstructural investigations after annealing and superplastic deformation were performed to analyze the material behavior in several loading conditions and identify the effect of the initial microstructure on the superplasticity of the studied alloy.
2. Materials and test experiments
The sheets of the two-phase Ti-4Al-1V-3Mo alloy (Ti-4.6Al-3.1Mo-1.1V-0.15Zr-0.08Si-0.08Fe-0.03N-0.08O-0.09C-0.009H), marked up as sheet A and sheet B, were processed by two different thermomechanical steps (Fig.S1). The treatment of sheet A included hot rolling with subsequent water quenching and warm rolling in the α+β phase field. The processing regime for sheet A was similar to the industrial process used to obtain superplastic sheets of this alloy [40]. Sheet B was processed using hot rolling with subsequent quenching from the β-phase field to form a martensitic structure and warm rolling in the two-phase field in near-isothermal conditions at 740±20°C [3]. The total rolling reduction was similar for both sheets. Hot rolling for ≈40% reduction was performed in three passes, and warm rolling for ≈70% was performed in six passes.
The samples of both sheets were annealed in a temperature range of 775-900 °C for 30 min and were subsequently water-quenched to examine the size and shape of the grains before the beginning of the elevated temperature deformation. Note that during water quenching from a temperature close to the β-transus, a thin lamellar of α (and/or martensite α´) forms within the beta grains at cooling. The β-phase fraction at high temperature is equal to the phase fraction of β-transformed (and/or martensite α´) observed at RT, as a bright area, on the SEM images.
The strain rate sensitivity coefficient (m) was determined at temperatures in a range of 775-900 °C by tests with a step-by-step strain rate decreasing in a range of 2×10⁻⁵-2×10⁻² s-1. The strain at each step was 0.02. The uniaxial-tensile tests at constant strain rates were performed at 875 °C with strain rates in a range of 2×10⁻⁴ - 5×10⁻² s-1 and at temperatures in a range of 775-875°C with a constant strain rate of 1×10⁻³ s-1. The tensile tests were performed in a Walter-Bay LFM 100 test machine. The dog-bone type test samples with a gauge size of 14×6×1 mm3 were cut parallel to the rolling direction. The strain-induced microstructural changes were analyzed after the deformation at temperatures of 775, 825, and 875°C with a constant strain rate of 1×10⁻³ s-1 for the samples of both sheets. The samples after superplastic deformation for various strains were immediately quenched in water to analyze their microstructure.
The superplastic forming of the model parts was performed in a laboratory machine using the conditions in terms of temperature and strain rate, providing the maximum m-value and elongation-to-failure. The used die shape and its dimensions are presented in Ref. [41].
The microstructure was studied using a TESCAN Vega 3 scanning electron microscope (SEM) equipped with an electron backscatter diffraction detector (EBSD) HKL NordlysMax. The EBSD analysis was employed with a step size of 0.15 µm and a scan area of 70 × 70 µm2. The samples for the microstructural studies were mechanically ground on SiC papers up to 2400 PP then polished on a CHEM MD cloth with a lubricant of 50 ml colloidal silica + 10 ml H2O2 (30%) + 5 ml Kroll’s agent.
To clarify the superplastic deformation mechanisms, the surface study was conducted using accurate grid marking. The grids were milled on the pre-polished surface of the sample using a STRATA FIB - 2051 microscope. The grids have a total size of 40 × 40 µm2 with an interline spacing of 2.5 µm and 0.5 µm, and a depth of about 0.15 µm.
3. Results
3.1 Analysis of the initial microstructure
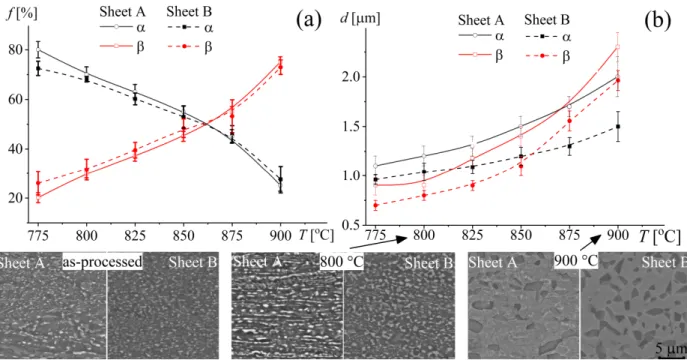
After processing, both sheets A and B exhibited a two-phase mixed structure of equiaxed and elongated grains (Fig.1, left inserts). Figure 1 shows the microstructural parameters evolution vs. temperature and
microstructures of the samples water-quenched after annealing at 800 and 900 °C for 30 min. The measured microstructural parameters are collected in Table 1. The α/β fraction was near 80/20 % and 75/25 % in the as-processed samples of sheet A and sheet B, respectively. A mean size of β grains was 0.7±0.1 µm in the as-processed samples of both sheets. The sheet A samples exhibited a fraction of an elongated structure of 45±5%, whereas it was 22±3% for sheet B. The changes in the phase ratio (Fig.1a), the grain growth (Fig.1b), and the changes in the grains’ shape (Fig.1, see SEM-micrographs) were observed with an increase of annealing temperature. The fraction of the areas with the elongated structure after annealing at 875 °C decreased to 25±3% in sheet A and to 9±2% in sheet B. Mostly equiaxed grains were observed after annealing at 900°C for the samples of both sheets (Fig.1, right inserts).
Fig. 1 (a) Volume fraction of the phases and (b) the grain size dependences on the annealing temperature of sheet A (dotted lines) and sheet B (solid lines) Inserts: SEM-microstructures of the investigated sheets A and B after sheet processing and annealing for 30 min at 800°C and 900°C (sheet
type and sample state are written in images), the α and β phases appear dark and bright, respectively.
The volume fraction of the β-phase changed from 20-25 to 75%, with an increase of annealing temperature from 775 to 900 °C in the samples of both sheets (Fig. 1a). The temperature at which the
α/β phase fraction ratio is equal to 50% was between 850°C and 875 °C. The grain size of the equiaxed
grains of both phases grew from 0.8-1.0 to 1.5-2.0 µm with an increase of annealing temperature from 775 to 900 °C (Fig. 1b). The considerable grain growth observed at temperatures above 850°C was more significant in the β-phase (Fig. 1b).
Table 1. Microstructure parameters (α/β phases) of the studied samples after annealing in a temperature range 775 - 900°C for 30 min
Sheet type
Microstructure parameter (α/β)
As-processed Annealing temperature [°C]
775 800 825 850 875 900
A
Mean grain size [µm] - 1.1/0.9 1.2/0.9 1.3/1.2 1.5/1.4 1.7/1.7 2.0/2.3 Volume fraction of the
phases [%]
81/19
80/20 70/30 63/37 55/45 45/55 25/75 Fraction of areas with the
elongated structure
45±5
43±4 40±5 38±5 30±4 25±3 0
B
Grain size [µm] - 1.0/0.7 1.0/0.8 1.1/0.9 1.2/1.1 1.3/1.6 1.5/2.0 Volume fraction of the
phases [%]
75/25
73/27 68/32 60/40 53/47 46/54 27/73 Fraction of areas with the
elongated structure
22±3
19±3 18±3 15±2 11±3 9±2 0
3.2 Step-by-step decreasing strain rate tensile tests
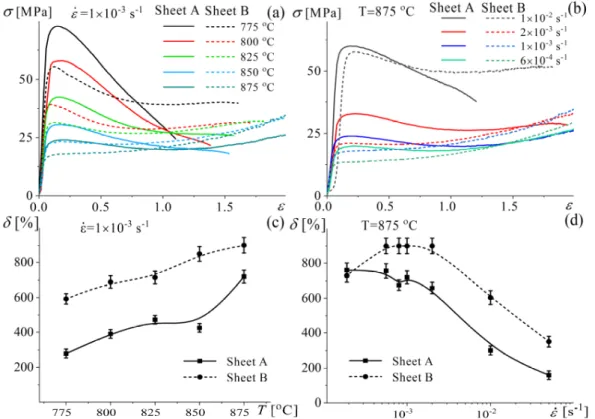
The stress-strain rate curves, the strain rate sensitivity m-coefficient maps are shown in Fig. 2. The strain rate vs. the temperature data corresponding to a maximum m-value (Fig.2) and the limits inside which m>0.3 are shown in Fig.S2. Both sheets exhibit a sigmoidal shape of the lnσ-ln ˙ curves typical of superplastic materials (Fig. 2a). The optimum strain rate, which corresponded to a maximum m-value, increased with a temperature increase for both samples (Figs. 2b,c, Figs.S2). Both sheets demonstrated a maximum m-value, m=0.45 and 0.51 for the sheets A and B, respectively, at a deformation temperature of 875°C with a strain rate of about 1×10⁻³ s-1. A slightly wider strain rate interval of m ˃0.3 was observed for sheet B than for sheet A.
Fig. 2 (a) Stress-strain rate data obtained by the tests of step-by-step decreasing of the strain rate for A-type (solid lines) and B-A-type (dash lines) sheets; (b,c) the strain rate sensitivity m-coefficient vs.
temperature (x-axis) and strain rate (y-axis) for (b) sheet A and (c) sheet B
3.3 Constant strain rate tests
Figure 3 shows the dependencies of true stress (σ) from logarithmic strain (ε), elongation-to-failure (δ), at the studied temperatures and constant strain rates. The samples of both sheets exhibited similar
deformation behavior. The deformation was accompanied by strain softening at low strains before 0.5-1.0 and strain hardening at larger strains (Figs.3a,b). A peak stress value and values of a strain exponent n in the relationship of σ expressed as a function of are presented in Fig.S3. For both sheets, increasing the deformation temperature (Fig.S3a) and decreasing the strain rate (Fig.S3b) led to a decrease in both stress value and n-coefficient. The minimum peak stress and coefficient n≈0 (in a strain range of 0.2-1.0) were observed at 875°C (see Fig.S3). The strain softening was less significant, and the peak stress values were lower for B-type samples than for A-type.
Fig. 3 (a,b) Stress-strain curves at (a) different temperatures and at a constant strain rate of 1×10⁻³ s-1 and (b) different strain rates at a deformation temperature of 875°C and (c) the dependency of elongation-to-failure (δ) from the temperature at a constant strain rate of 1×10⁻³ s-1 and (d) from the
strain rate at 875°C for sheet A (solid lines) and sheet B (dash lines).
The sheet B samples (Figs.3c,d; dash lines) demonstrated larger elongation-to-failure than the sheet A samples (Figs.3c,d; solid lines). The maximum elongations of 740% for sheet A and 900 % for sheet B were achieved at 875°C and 1×10⁻³ s-1.
3.4 Microstructural evolution during superplastic deformation
3.4.1 Comparison of the microstructures of the deformed to 0.69 (gauge part of the tensile samples) and undeformed samples (grip part of the tensile samples)
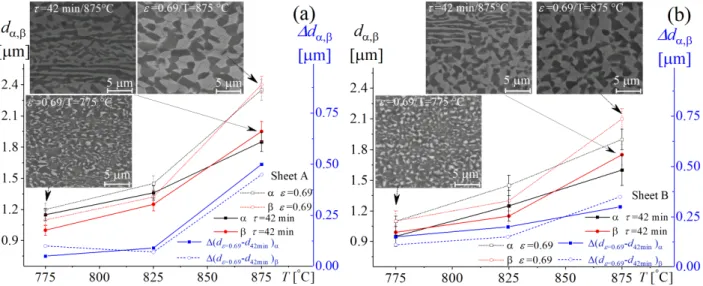
The microstructural parameters of the grip parts (equivalent to annealing for 42 min), the gauge parts (ε =0.69), and the samples were compared after deformation at temperatures of 775, 825, and 875 °C with a strain rate of 1×10⁻³ s-1 (Fig.4). Annealing-induced and strain-induced grain growths were observed for both α and β phases, whose effects were pronounced at an increased temperature of 875 °C. The grain growth for sheet A (Fig. 4a) was more intensive than for sheet B (Fig. 4b) at the tested temperatures.
Fig. 4 Mean grain size values (dα,β, left axis) and dynamic grain growth component ∆d (dε=0.69-d42min)
(right axis) of α- and β-phase grains for (a) sheet A and (b) sheet B. Inserts: Microstructures of deformed to strain (ε) of 0.69 (gauge part of the sample) at 775 and 875 °C and annealed for τ =42 min
(grip part of the sample) at 875 °C samples.
The dynamic grain growth component ∆d (dε=0.69-d42min) of β and α grains was insignificant at low
temperatures, and it increased with increasing the temperature to 875°C (Fig. 4; blue curves). At 875 °C, the ∆d of both α and β grains for sheet A was higher than for sheet B.
The mixed structure of elongated and near-equiaxed grains was observed in the sample of sheet A deformed to strain ε=0.69 at 775 °C (inserts in Fig.4a). The same deformation conditions (inserts in Fig.4b) provided a near-equiaxed grain structure for sheet B. Superplastic deformation at temperatures higher than 825 °C with ε =0.69 led to the formation of near-equiaxed grains in both sheets. Nevertheless, at this temperature range (above 825°C), some elongated grains were still observed in the samples' undeformed grip area (left inserts in Fig.4). Indeed, a fraction of elongated grains after
annealing at 875 °C for 42 min was respectively 45±5% and 21±4% for sheet A and sheet B, which was similar to the values obtained after annealing for 30 min at the same temperature.
3.4.2. Strain-induced microstructural evolution at a deformation temperature of 875°C
The strain-induced microstructural evolution was studied during deformation at a temperature of 875 °C with a constant strain rate of 1×10⁻³ s-1. These testing conditions provided the maximum m-value of 0.45-0.51 and elongation-to-failure. A similar β-phase fraction of around 52-55% was observed for both sheets in the studied strain range (see SEM images in Fig.S4). Moreover, at a low strain of 0.4, while some areas of elongated grains were still observed in the samples of sheet A, the microstructure of sheet B was homogeneous and equiaxed. The residual cavitation was not found in the samples of both sheets up to failure, while the dynamic grain growth was revealed. At a strain of 2.1 (720%), the studied sheets A and B exhibited respectively dβ=4.2±0.3 µm / dα=3.8±0.3 µm, and
dβ=3.8±0.2 µm / dα=3.4±0.2 µm.
The EBSD-IPF maps and misorientation angle distributions of the samples before superplastic deformation at 875°C (as-annealed for 30 min) and after strains of 0.4 and 1.6 with a constant strain rate of 1×10⁻³ s-1 are presented in Fig. 5. The grain structure parameters are collected in Table 2. The white-colored boundaries are low-angle (LAGB) with a misorientation angle in a range of 2 to 15°. The black-colored boundaries are a high-angle (HAGB) with a misorientation angle of above 15°. The grain size distributions are shown in Fig.S5 in the supplementary materials. Notably, the β-phase with the BCC lattice partially transformed into the HCP lattice (martensite α´phase during quenching from 875 °C) during rapid water-cooling after annealing or deformation. Thus, it is difficult, by EBSD, to clearly determine if the transformed β-phase and α-phase both belong to an HCP lattice structure.
Fig. 5. Electron backscattered diffraction grain boundaries maps (EBSD-IPF- Z, parallel to ND) of the HCP-phase and the related grain boundaries misorientation angle distributions of (a-c) sheet A and (d-f) sheet B after (a,d) annealing for 30 min and superplastic deformation at 875°C with 1×10⁻³s-1 at (b,e)
logarithmic strain of 0.4 and (c,f) logarithmic strain of 1.6.
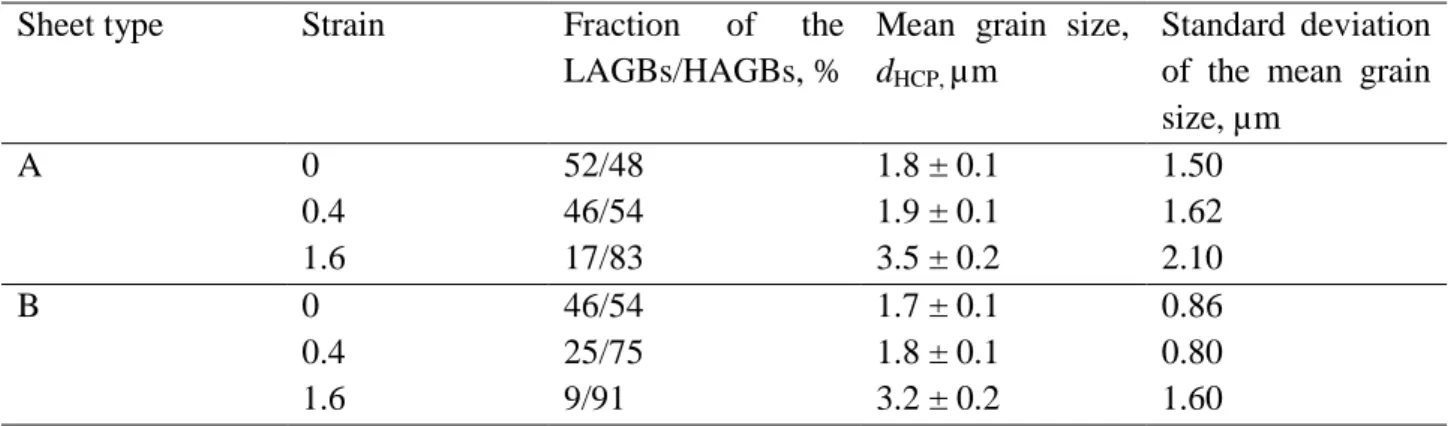
Table 2. The grain structure parameters evolution (EBSD data) during superplastic deformation at a temperature of 875°C with a constant strain rate of 1×10⁻³ s-1
Sheet type Strain Fraction of the LAGBs/HAGBs, %
Mean grain size,
dHCP, µm
Standard deviation of the mean grain size, µm A 0 52/48 1.8 ± 0.1 1.50 0.4 46/54 1.9 ± 0.1 1.62 1.6 17/83 3.5 ± 0.2 2.10 B 0 46/54 1.7 ± 0.1 0.86 0.4 25/75 1.8 ± 0.1 0.80 1.6 9/91 3.2 ± 0.2 1.60
Before superplastic deformation, sheet A (Fig.5a) exhibited the 52% LAGBs fraction; the mean grain size was 1.8 µm, and its standard deviation was 1.5 µm (see Fig. S5a in the supplementary materials). By increasing the strain to 0.4, the fraction of HAGBs increased while a slight decrease in the LAGBs fraction was observed (Fig. 5b and Fig.S5b of supplementary materials). The mean grain size and its standard deviation were quite similar to the as-annealed state. Therefore, at a strain of 0.4, even if sheet A started to undergo a slight microstructural evolution, insignificant changes of the non-recrystallized
areas were observed. It is also interesting to notice that the microstructure of sheet A after a strain of 0.4 (Fig. 5b) is quite similar to sheet B before superplastic deformation (Fig. 5d). Indeed, in comparison with sheet A at 0.4 of strain (Fig. 5b), similar grain boundaries misorientation angle distributions and a mean grain size of 1.7 µm were observed in sheet B before superplastic deformation (Table 2). Only a lower standard deviation of a mean grain size of 0.86 µm was revealed (Fig.S5d of supplementary materials). For sheet B, a strain of 0.4 led to a significant decrease of the LAGB fraction from 46% to 25% (as well as to a more equiaxed microstructure) (Figs.5e, S5e, Table 2). During the deformation to 1.6, the LAGB fraction significantly decreased to 17% for sheet A (Fig.5c, Table 2) and 9% for sheet B (Fig.5f, Table 2), and the HAGB fraction, correspondingly, increased for both sheets. Increasing the strain to 1.6 led to the grain growth to a mean size of 3.5 µm with a standard deviation of 2.1 µm for sheet A and 3.2 µm with a standard deviation of 1.6 µm for sheet B (see Fig.S5c,f). The EBSD results suggest a strong texture before superplastic deformation and texture randomization during superplastic deformation.
The SEM-SE images (Figs. 6,7) revealed a surface relief after deformation for the marked-up areas. Note that during deformation up to a strain of 0.14, the FIB-grid lines (Fig.6 a,b) disappeared from the surface of sheet A (Figs.6c) and significantly blurred on the surface of sheet B (Figs.6d).
Fig.6. SEM-SE microstructures of the pre-polished surface samples of the sheets (a,c) A and (b,d) B before deformation and after deformation at 875 °C with a constant strain rate of 1×10⁻³s-1 to a strain of 0.14; white dotted line in (c) shows a shift of the FIB-grid line during deformation; the tensile direction
is horizontal.
The relief related to GBS was revealed in a few areas of the sample A surface (Fig.6 c; arrows in Fig.7a). Multiple slip bands were observed in α-and β-grains for sheet A, which indicates the dislocation nature of the deformation mechanisms at low strains in both phases (see high-magnification SEM-SE (through lens detector) images in Fig.7b).
Sheet B exhibited a more typical GBS relief that resulted from grains rotation and sliding to the tensile direction (Fig.6d). The GBS related shifts of the cross grid lines were observed for sheet B (Fig.6d and 7c white dotted line). Figures 7e and 7f show, respectively, the SEM-SE and SEM-BSE images of the same place on the surface and BSE image helps to identify the α and β phases in the studied area due to a difference in their chemical compositions. The α-grains containing slip bands and the α-grains free of them are depicted in Figs.7d,e for sheet B. Moreover, the localization of the slip bands into the β grains was observed in sheet B. Only a few β-grains (Fig.7e) were free of a dislocations activity.
Fig.7. Microstructure of the pre-polished surface samples of the sheets (a,b) A and (c,e,d,f) B as-deformed at 875 °C with a constant strain rate of 1×10⁻³s-1 to a strain of 0.14; (a-d) SEM-SE images, (e)
and (f) SE and BSE images of the same area; (b,d) high magnification SEM-SE (through lens detector) images; yellow arrows show grain boundary sliding related relief; white dotted line in (c) shows a shift
Notably, the analyses of the strain-induced evolution of the surface structure revealed more homogeneous deformation on the macroscopic level of sheet B. Local macroscopic heterogeneities of deformation were observed in sheet A. Intense dislocation activity was revealed in both α and β phases in sheet A, while, a dislocation activity was localized mainly in the β-phase in sheet B. Thus, on the microscopic level, the deformation was more heterogeneous in the samples of sheet B.
3.5 Superplastic forming
The pressure-time cycles of superplastic forming at an optimum deformation temperature of 875°C and a strain rate of 1×10⁻³ s-1 were developed for both sheets, and the model parts were processed by SPF. The pressure-time cycles calculated using the stress-strain data at constant strain rates in a range 6×10
-4
-2×10⁻³ s-1 of each sheet are shown in Fig. S6 (see the supplementary materials). The strain rate at forming varied in a range of 8×10⁻⁴–2.5×10⁻³ s-1. Fig. 8 illustrates the geometries of the SPF-parts. Both components exhibited good quality without any visible defects. Due to the non-uniform strain rate across the section and the influence of friction between the sheet and the die, the thickness across the critical region was different. The thickness of the SPF-part varied from 0.15 mm (ε1=1.95) to 0.41 mm (ε=1.0) for sheet A (Fig. 8 a), and it was between 0.35 mm (ε=1.20) to 0.49 mm (ε=0.85) for sheet B (Fig. 8 a). In the critical areas of the SPF-parts, a strain rate increased to 2.5×10⁻³ s-1 resulted in larger strain values in these areas. Increased fraction of an elongated non-recrystallized structure for sheet A (Fig.8 a, insert for point x1) and a near-equiaxed uniform grain structure for sheet B (Fig.8 b, insert for
point y1) were formed in the low-stained areas during the free bulging stage of SPF. The strain
localization in the critical regions led to local dynamic recrystallization and related strain-softening accompanied by non-uniform deformation during SPF of sheet A. A more stable and homogeneous microstructure of sheet B at low strains provided more uniform deformation and a low thickness variation in the large-strained critical regions. A fine recrystallized grain structure was observed for the large-strained areas of both sheets (Fig. 8, inserts for (a) points x2, sheet A and (b) y2, sheet B).
1 The strain was calculated using thickness changes as ε = ln( to/ti), where ti is the post-forming thickness and to is the initial
Fig. 8. Thickness distribution (all numbers in mm) for the forming components of (a) sheet A and (b) sheet B. Inserts: microstructures of deformed parts of sheet A (for points x1and x2) and sheet B (for
4. Discussion
The microstructure evolution plays a critical role in the flow behavior during superplastic deformation of the Ti-4Al-3Mo-1V alloy. Since deformation with constant strain rates was uniformed and necking-free, the shape of the stress-strain curves depends on the strain-induced microstructural changes. The traditional superplastic alloy Ti-6Al-4V demonstrates equiaxed recrystallized grains before superplastic deformation and its deformation behavior, usually accompanied by strain hardening or stable flow [10,35,36]. In superplastic materials, strain hardening on the curves is likely to result in dynamic grain growth, while the stable flow is related to increased grain structure stability [29,42]. The strain softening during uniform hot deformation with a constant strain rate can be explained by DRX [12,43]. The studied alloy demonstrates a partially recrystallized grain structure and its deformation accompanied by strain softening at the beginning of the superplastic flow. The strain softening on the stress-strain curves directly depends on the deformation temperature, the strain rate, and the related dynamic recrystallization kinetics. The n-coefficient, showing strain-softening intensity in a strain range of 0.2-1.0, decreases when increasing the strain rate and/or decreasing deformation temperature. This behavior is typical of DRX [36] of superplastic materials. The dynamic recrystallization phenomenon at superplastic deformation was suggested in various Ti-based alloys via the EBSD analysis [44–48]. Our EBSD analysis suggested that the grain structure of both sheets studied before the start of superplastic deformation was partially non-recrystallized with a high LAGB fraction. An increased recrystallization resistance of the Ti-4Al-3Mo-1V alloy is most likely a result of alloying by a low-diffusive Mo [49,50]. Superplastic deformation leads to dynamic recrystallization resulting in a significant increase of the HAGB fraction, facilitating grain boundary sliding, texture randomization, and the related decrease in flow stress. It agrees with the results of Balasundar et al. [51], Vo et al. [52], and Roy et al. [53].
The deformation behavior of both sheets studied was qualitatively similar but quantitatively different. Sheet B exhibits a more equiaxed grain structure after sheet processing and after heating to superplastic deformation temperatures. The differences in the microstructural homogeneity persisted at superplastic deformation and resulted in quantity differences of the stress-strain behavior of the studied sheets. The samples of sheet A, with a higher fraction of elongated non-recrystallized grains at the beginning of deformation, demonstrate higher stress values that decrease with increasing strain up to 50-100% due to dynamic recrystallization. This effect is less pronounced in sheet B, which exhibited a low fraction of non-recrystallized grains before superplastic deformation that became recrystallized at strains below 50%. The microstructural study explains the differences in the deformation behavior. Higher stress values of sheet A can be linked to high dislocation activity, in both α and β phases, as it was observed
on the sample surface. On the contrary, sheet B demonstrated the dislocation activity predominantly in the β phase, which provides lower stress values.
Strain softening is replaced by strain hardening at large strains. According to the microstructural analysis, DGG and the dislocation activity in the α and β phases, are the possible reasons for strain hardening. Although a slightly higher strain hardening effect was observed in sheet B, the dynamic grain growth of the α and β-phase grains of sheet B was less significant than in sheet A (see Fig.4). It suggests that strain hardening at large strains is likely to result from both DGG and dislocation activity, especially in the ductile β-phase, where the dislocation activity was significant in both sheets. The intense dislocation activity promotes the DRX process that compensates a strain increase due to DGG in sheet A. The cooperation between DGG and DRX explains a weaker total strain hardening effect at larger sheet A strains. Further investigations of superplastic deformation of the samples with surface markers are required to determine the changes in the deformation mechanisms at large strains.
Importantly, a more homogeneous and stable grain structure leads to higher elongation of sheet B. The grain growth rate on the interfacial boundaries of the alternating α/β phases is lower than that of the α/α or β/β grain boundaries [10,50,54,55]. For this reason, sheet B, with a more homogeneous initial microstructure and a high fraction of the interfacial boundaries, demonstrates increased stability of the grain structure during heating to the elevated temperatures and superplastic deformation.
The results of the strain-induced changes in the bulk grain structure agree with the changes of the samples’ surface deformed at optimal superplastic conditions. The typical GBS surface relief was observed in sheet B and the local areas of the samples of sheet A after superplastic deformation. It suggested more pronounced GBS at low strains for sheet B, which resulted in a higher HAGB fraction. More intense GBS provided more homogeneous deformation at low strains of sheet B.
The grid lines blurred and disappeared from the samples’ surface mainly due to significant intragranular deformation at low strains and the formation of slip bands on the surface of the grains. The multiple slip bands on the surface were observed in the β-phase area of the samples of both sheets studied. Only several β-grains show smooth surface free of dislocation activity in sheet B, suggesting that GBS is mainly accommodated by intragranular slip deformation into the β phase. The dislocations mechanisms of the β phase deformation at superplastic deformation agree with the results of numerous studies; in-situ studies of strain-induced microstructural evolution for the Ti-Al-V alloy [10], TEM studies of Ti-Al-V, and various Ti-based alloys studied by the EBSD method [47,56,57]. According to the superplasticity theory, the ductile BCC β-phase has an accommodation function and simplifies the sliding of the HCP α-grains [26,27].
In the studied alloy, many slip bands were also observed on the surface of α-grains. The intragranular deformation of the α-phase was more pronounced for sheet A with an increased fraction of recrystallized grains. This observation suggests that the active dislocation activity promotes DRX at the early stages of superplastic deformation of both phases for sheet A. Sekiguchi et al. [48] suggested that DRX occurred preferentially in the α-Ti phase at low strains and the β-Ti phase in large strains in a Ti– 531CN alloy. The formation of the slip bands on the α-grains surface can also be a result of GBS dislocation accommodation, which is reasonable in sheet B with a high fraction of recrystallized grains and pronounced GBS.
The initial microstructure is also one of the most important parameters of the SPF process of the studied alloy. A high fraction of elongated grains and a non-uniform grain structure at low strains led to significant strain localization and non-uniform thickness distribution for sheet A. The equiaxed recrystallized grains formed in the sample of sheet B before it contacted with the die surface that provided stable flow and desirable, more uniform, thickness distribution in the formed parts of sheet B. The regime of superplastic forming of sheet A required further optimization to increase the thickness homogeneity of the formed parts.
5. Conclusions
In the present study, two sheets of a titanium alloy (Ti-4Al-3Mo-1V) different in their fraction of equiaxed recrystallized/elongated non-recrystallized grains were investigated. We used uniaxial tensile tests and microstructural characterization (as received, after annealing, after superplastic deformation) as well as scanning electron microscopy to analyze the material characteristics and compare the sheets deformation behavior. The tensile tests were performed in a temperature range of 775°C-900°C and a strain rate range of 1×10⁻⁵-2×10⁻² s-1. Superplastic forming at a temperature of 875°C with an average strain rate of 1×10⁻³s-1 was processed. Given the results, we concluded that:
1) Due to the same chemical composition, the volume fraction α/β=50/50 was between 850-875°C for both sheets studied. A temperature of 875°C and a strain rate of 1×10⁻³s-1 provided the maximum strain rate sensitivity index (m) of 0.52 and 0.45 for the sheets with low and high recrystallized fraction, respectively. The superplastic deformation of both sheets was accompanied by strain softening at low strains. The strain-softening effect and the peak stress values increased with an increase in the strain rate and a decrease in the deformation temperature. The samples with a lower initial non-recrystallized fraction exhibited weaker strain softening and lower peak stress than the sheets with higher non-recrystallized fractions.
2) The SEM and EBSD studies revealed a significant increase of the fraction of equiaxed grains and high angle grain boundaries of both samples, which suggested dynamic recrystallization at low strains and dynamic grain growth at large strains. The dynamic grain growth at superplastic flow was more significant in the case of the alloy with pronounced inhomogeneity of the initial microstructure and a lower fraction of recrystallized grains before the beginning of superplastic deformation.
3) The SEM observations of the strain-induced evolution of the surface structure at strains of 0.1-0.2 revealed GBS relief and the formation of slip bands inside the grains of both phases, which suggested a significant intragranular strain via dislocation mechanisms of deformation and/or dislocation GBS accommodation in both sheets. The weaker GBS relief and more slip bands in both phases were revealed for the sheet with a lower initial recrystallized fraction.
4) The sheet with a higher fraction of recrystallized equiaxed grains before the beginning of superplastic deformation demonstrated a higher m-value, elongation-to-failure at tensile tests, and more uniformed thickness distribution during superplastic forming than those obtained for the sheet with a decreased fraction of recrystallized grains in the initial state.
Acknowledgments
The work was carried out with the support of the Ministry of Science and Higher Education of the Russian Federation in the framework of the State Task to Universities [project code 0718-2020-0030]. The authors gratefully acknowledge Dr. Elena Bazanova for helpful recommendations. We dedicate this work to the memory of Prof. V.K. Portnoy.
Data Availability
The raw/processed data required to reproduce these findings cannot be sheared at this time as the data also forms part of an ongoing study.
References
[1] T.G. Langdon, The physics of superplastic deformation, Mater. Sci. Eng. A. (1991). https://doi.org/10.1016/0921-5093(91)90312-B.
[2] M. Kawasaki, T.G. Langdon, Superplasticity in ultrafine-grained materials, in: Rev. Adv. Mater. Sci., 2018. https://doi.org/10.1515/rams-2018-0019.
[3] I.I. Novikov, V.K. Portnoj, Superplastizität von Legierungen, 1985. https://doi.org/10.1007/978-3-7091-9521-5.
Titanium Alloys, in: Titan. Titan. Alloy., 2005. https://doi.org/10.1002/3527602119.ch1.
[5] J. Sieniawski, M. Motyka, Superplasticity in titanium alloys, Jounal Achiev. Mater. Manuf. Eng. (2007).
[6] T.G. Nieh, J. Wadsworth, O.D. Sherby, Superplasticity in Metals and Ceramics, Cambridge University Press, 1997. https://doi.org/10.1017/CBO9780511525230.
[7] H. Masuda, E. Sato, Diffusional and dislocation accommodation mechanisms in superplastic materials, Acta Mater. 197 (2020) 235–252. https://doi.org/10.1016/j.actamat.2020.07.042. [8] K.A. Padmanabhan, M.R. Basariya, A theory of steady state structural superplasticity in
different classes of materials: A materials-agnostic analysis, Mater. Sci. Eng. A. (2019). https://doi.org/10.1016/j.msea.2018.12.086.
[9] K. Sotoudeh, P.S. Bate, Diffusion creep and superplasticity in aluminium alloys, Acta Mater. (2010). https://doi.org/10.1016/j.actamat.2009.11.034.
[10] E. Alabort, P. Kontis, D. Barba, K. Dragnevski, R.C. Reed, On the mechanisms of
superplasticity in Ti-6Al-4V, Acta Mater. (2016). https://doi.org/10.1016/j.actamat.2015.12.003. [11] R.Z. Valiev, A. V. Korznikov, R.R. Mulyukov, Structure and properties of ultrafine-grained
materials produced by severe plastic deformation, Mater. Sci. Eng. A. (1993). https://doi.org/10.1016/0921-5093(93)90717-S.
[12] T. Sakai, A. Belyakov, R. Kaibyshev, H. Miura, J.J. Jonas, Dynamic and post-dynamic recrystallization under hot, cold and severe plastic deformation conditions, Prog. Mater. Sci. (2014). https://doi.org/10.1016/j.pmatsci.2013.09.002.
[13] J.J. Blandin, Superplasticity of metallic alloys: Some current findings and open questions, in: Mater. Sci. Forum, 2016: pp. 13–22. https://doi.org/10.4028/www.scientific.net/MSF.838-839.13.
[14] A.V. Mikhaylovskaya, O.A. Yakovtseva, V.V. Cheverikin, A.D. Kotov, V.K. Portnoy,
Superplastic behaviour of Al-Mg-Zn-Zr-Sc-based alloys at high strain rates, Mater. Sci. Eng. A. (2016). https://doi.org/10.1016/j.msea.2016.02.061.
[15] V. Sinha, R. Srinivasan, S. Tamirisakandala, D.B. Miracle, Superplastic behavior of Ti-6Al-4V-0.1B alloy, Mater. Sci. Eng. A. (2012). https://doi.org/10.1016/j.msea.2011.12.058.
[16] J.A. Wert, N.E. Paton, Enhanced superplasticity and strength in modified Ti-6AI-4V alloys, Metall. Trans. A. (1983). https://doi.org/10.1007/BF02668895.
[17] E. Alabort, D. Barba, M.R. Shagiev, M.A. Murzinova, R.M. Galeyev, O.R. Valiakhmetov, A.F. Aletdinov, R.C. Reed, Alloys-by-design: Application to titanium alloys for optimal
[18] S.V. Zherebtsov, G.A. Salishchev, R.M. Galeyev, O.R. Valiakhmetov, S. Yu. Mironov, S.L. Semiatin, Production of submicrocrystalline structure in large-scale Ti-6Al-4V billet by warm severe deformation processing, Scr. Mater. (2004).
https://doi.org/10.1016/j.scriptamat.2004.08.018.
[19] R.S. Mishra, V. V. Stolyarov, C. Echer, R.Z. Valiev, A.K. Mukherjee, Mechanical behavior and superplasticity of a severe plastic deformation processed nanocrystalline Ti-6Al-4V alloy, Mater. Sci. Eng. A. (2001). https://doi.org/10.1016/s0921-5093(00)01338-1.
[20] T. Zhang, Y. Liu, D.G. Sanders, B. Liu, W. Zhang, C. Zhou, Development of fine-grain size titanium 6Al-4V alloy sheet material for low temperature superplastic forming, Mater. Sci. Eng. A. (2014). https://doi.org/10.1016/j.msea.2014.04.098.
[21] Z. Horita, M. Furukawa, M. Nemoto, A.J. Barnes, T.G. Langdon, Superplastic forming at high strain rates after severe plastic deformation, Acta Mater. (2000). https://doi.org/10.1016/S1359-6454(00)00182-8.
[22] M.J. Qarni, G. Sivaswamy, A. Rosochowski, S. Boczkal, Effect of incremental equal channel angular pressing (I-ECAP) on the microstructural characteristics and mechanical behaviour of commercially pure titanium, Mater. Des. (2017). https://doi.org/10.1016/j.matdes.2017.03.015. [23] D. Kim, J.W. Won, C.H. Park, J.K. Hong, T. Lee, C.S. Lee, Enhancing Superplasticity of
Ultrafine-Grained Ti–6Al–4V without Imposing Severe Plastic Deformation, Adv. Eng. Mater. (2019). https://doi.org/10.1002/adem.201800115.
[24] M. Jain, M.C. Chaturvedi, N.L. Richards, N.C. Goel, Microstructural characteristics in α phase during superplastic deformation of Ti6Al4V, Mater. Sci. Eng. A. (1991).
https://doi.org/10.1016/0921-5093(91)90250-Q.
[25] M.L. Meier, D.R. Lesuer, A.K. Mukherjee, α Grain size and β volume fraction aspects of the superplasticity of Ti-6Al-4V, Mater. Sci. Eng. A. (1991). https://doi.org/10.1016/0921-5093(91)90442-P.
[26] M.L. Meier, A.K. Mukherjee, Consequences of using the average diffusivity in correlating the enhanced superplasticity of iron-modified Ti-6Al-4V, Scr. Metall. Mater. (1991).
https://doi.org/10.1016/0956-716X(91)90435-4.
[27] S.L. Semiatin, F. Montheillet, G. Shen, J.J. Jonas, Self-consistent modeling of the flow behavior of wrought alpha/beta titanium alloys under isothermal and nonisothermal hot-working
conditions, Metall. Mater. Trans. A Phys. Metall. Mater. Sci. 33 (2002) 2719–2727. https://doi.org/10.1007/s11661-002-0394-9.
during Superplastic Deformation of Ti–6Al–4V, Mater. Trans. JIM. 32 (1991) 465–472. https://www.jstage.jst.go.jp/article/matertrans1989/32/5/32_5_465/_article.
[29] H. Imai, G. Yamane, H. Matsumoto, V. Vidal, V. Velay, Superplasticity of metastable ultrafine-grained Ti 6242S alloy: Mechanical flow behavior and microstructural evolution, Mater. Sci. Eng. A. (2019). https://doi.org/10.1016/j.msea.2019.03.085.
[30] C. Akihiko, Superplasticity of the Ultrafine-Grained Ti-6Al-4V Alloy with a Metasstable -Single Phase Microstructure, Proc. 13th World Conf. Titan. (2016) 789–792.
[31] H. Matsumoto, V. Velay, Mesoscale modeling of dynamic recrystallization behavior, grain size evolution, dislocation density, processing map characteristic, and room temperature strength of Ti-6Al-4V alloy forged in the (α+β) region, J. Alloys Compd. (2017).
https://doi.org/10.1016/j.jallcom.2017.02.285.
[32] H. Matsumoto, V. Velay, A. Chiba, Flow behavior and microstructure in Ti-6Al-4V alloy with an ultrafine-grained α-single phase microstructure during low-temperature-high-strain-rate superplasticity, Mater. Des. (2015). https://doi.org/10.1016/j.matdes.2014.05.045.
[33] L. Despax, V. Vidal, D. Delagnes, M. Dehmas, M. Geyer, H. Matsumoto, V. Velay, Superplasticity in fine grain Ti-6Al-4V alloy: Mechanical behavior and microstructural evolution, Defect Diffus. Forum. 385 DDF (2018) 137–143.
https://doi.org/10.4028/www.scientific.net/DDF.385.137.
[34] Q. Sirvin, V. Velay, R. Bonnaire, L. Penazzi, Mechanical behaviour modelling and finite element simulation of simple part of Ti-6Al-4V sheet under hot/warm stamping conditions, J. Manuf. Process. 38 (2019) 472–482. https://doi.org/10.1016/j.jmapro.2018.12.010.
[35] V. Velay, H. Matsumoto, V. Vidal, A. Chiba, Behavior modeling and microstructural evolutions of Ti-6Al-4V alloy under hot forming conditions, Int. J. Mech. Sci. (2016).
https://doi.org/10.1016/j.ijmecsci.2016.01.024.
[36] E. Alabort, D. Putman, R.C. Reed, Superplasticity in Ti-6Al-4V: Characterisation, modelling and applications, Acta Mater. (2015). https://doi.org/10.1016/j.actamat.2015.04.056.
[37] M. Motyka, J. Sieniawski, W. Ziaja, Microstructural aspects of superplasticity in Ti-6Al-4V alloy, Mater. Sci. Eng. A. (2014). https://doi.org/10.1016/j.msea.2014.01.067.
[38] A.D. Kotov, A. V. Mikhailovskaya, A.O. Mosleh, T.P. Pourcelot, A.S. Prosviryakov, V.K. Portnoi, Superplasticity of an Ultrafine-Grained Ti–4% Al–1% V–3% Mo Alloy, Phys. Met. Metallogr. (2019). https://doi.org/10.1134/S0031918X18100083.
[39] A.O. Mosleh, A.V. Mikhaylovskaya, A.D. Kotov, M. Sitkina, P. Mestre-Rinn, J.S. Kwame, Superplastic deformation behavior of ultra-fine-grained Ti-1V-4Al-3Mo alloy: Constitutive
modeling and processing map, Mater. Res. Express. (2019). https://doi.org/10.1088/2053-1591/ab31f9.
[40] V.N. Moiseyev, Titanium alloys: Russian aircraft and aerospace applications, 2005.
[41] A.O. Mosleh, A.D. Kotov, P. Mestre-Rinn, A.V. Mikhaylovskaya, Superplastic forming of Ti-4Al-3Mo-1V alloy: Flow behavior modelling and finite element simulation, in: Procedia Manuf., 2019. https://doi.org/10.1016/j.promfg.2019.12.042.
[42] M. Zelin, B. Gershon, I. Arbel, Grain growth during superplastic deformation, Interface Sci. 10 (2002) 37–42. https://doi.org/10.1023/A:1015180912228.
[43] A. Rollett, F. Humphreys, G.S. Rohrer, M. Hatherly, Recrystallization and Related Annealing Phenomena: Second Edition, 2004. https://doi.org/10.1016/B978-0-08-044164-1.X5000-2. [44] G.N. Haidemenopoulos, Physical metallurgy: Principles and design, 2018.
[45] P. Lin, A. Feng, S. Yuan, G. Li, J. Shen, Microstructure and texture evolution of a near-α titanium alloy during hot deformation, Mater. Sci. Eng. A. (2013).
https://doi.org/10.1016/j.msea.2012.11.064.
[46] Z. Liu, P. Li, L. Geng, T. Liu, H. gao, Microstructure and texture evolution of TA32 titanium alloy during superplastic deformation, Mater. Sci. Eng. A. (2017).
https://doi.org/10.1016/j.msea.2017.05.082.
[47] T. Yasmeen, B. Zhao, J.-H. Zheng, F. Tian, J. Lin, J. Jiang, The study of flow behavior and governing mechanisms of a titanium alloy during superplastic forming, Mater. Sci. Eng. A. (2020). https://doi.org/10.1016/j.msea.2020.139482.
[48] K. Sekiguchi, H. Masuda, H. Tobe, E. Sato, Continuous dynamic recrystallization in dual-phase titanium alloy in superplasticity, in: Defect Diffus. Forum, 2018.
https://doi.org/10.4028/www.scientific.net/DDF.385.126.
[49] Y. Liu, W.F. Wei, K.C. Zhou, L.F. Chen, H.P. Tang, Microstructures and mechanical behavior of PM Ti-Mo alloy, J. Cent. South Univ. Technol. (English Ed. (2003).
https://doi.org/10.1007/s11771-003-0043-5.
[50] E. Alabort, D. Barba, R. Reed, Mechanisms of superplasticity in titanium alloys: Measurement, in situ observations and rationalization, in: Defect Diffus. Forum, 2018.
https://doi.org/10.4028/www.scientific.net/DDF.385.65.
[51] I. Balasundar, T. Raghu, B.P. Kashyap, Modeling the hot working behavior of near-α titanium alloy IMI 834, Prog. Nat. Sci. Mater. Int. (2013). https://doi.org/10.1016/j.pnsc.2013.11.004. [52] P. Vo, M. Jahazi, S. Yue, Recrystallization during thermomechanical processing of IMI834,
https://doi.org/10.1007/s11661-008-9666-3.
[53] S. Roy, S. Suwas, The influence of temperature and strain rate on the deformation response and microstructural evolution during hot compression of a titanium alloy Ti-6Al-4V-0.1B, J. Alloys Compd. (2013). https://doi.org/10.1016/j.jallcom.2012.08.123.
[54] J.S. Kim, J.H. Kim, Y.T. Lee, C.G. Park, C.S. Lee, Microstructural analysis on boundary sliding and its accommodation mode during superplastic deformation of Ti-6Al-4V alloy, Mater. Sci. Eng. A. (1999). https://doi.org/10.1016/s0921-5093(98)01157-5.
[55] J.H. Kim, S.L. Semiatin, C.S. Lee, High-temperature deformation and grain-boundary
characteristics of titanium alloys with an equiaxed microstructure, Mater. Sci. Eng. A. (2008). https://doi.org/10.1016/j.msea.2007.08.027.
[56] L. Despax, V. Vidal, D. Delagnes, M. Dehmas, H. Matsumoto, V. Velay, Influence of strain rate and temperature on the deformation mechanisms of a fine-grained Ti-6Al-4V alloy, Mater. Sci. Eng. A. 790 (2020) 139718. https://doi.org/10.1016/j.msea.2020.139718.
[57] J. Shen, Y. Sun, Y. Ning, H. Yu, Z. Yao, L. Hu, Superplasticity induced by the competitive DRX between BCC beta and HCP alpha in Ti-4Al-3V-2Mo-2Fe alloy, Mater. Charact. (2019). https://doi.org/10.1016/j.matchar.2019.05.014.
Table 1. Microstructure parameters (α/β phases) of the studied samples after annealing in a temperature range 775 - 900°C for 30 min
Sheet type Microstructure parameter (α/β) As-processed Annealing temperature [°C] 775 800 825 850 875 900 A
Mean grain size [µm] - 1.1/0.9 1.2/0.9 1.3/1.2 1.5/1.4 1.7/1.7 2.0/2.3 Volume fraction of the
phases [%]
81/19
80/20 70/30 63/37 55/45 45/55 25/75 Fraction of areas with
the elongated structure
45±5
43±4 40±5 38±5 30±4 25±3 0
B
Grain size [µm] - 1.0/0.7 1.0/0.8 1.1/0.9 1.2/1.1 1.3/1.6 1.5/2.0 Volume fraction of the
phases [%]
75/25
73/27 68/32 60/40 53/47 46/54 27/73 Fraction of areas with
the elongated structure
22±3
19±3 18±3 15±2 11±3 9±2 0
Table 2. The grain structure parameters evolution (EBSD data) during superplastic deformation at a temperature of 875°C with a constant strain rate of 1×10⁻³ s-1
Sheet type Strain Fraction of the LAGBs/HAGBs, %
Mean grain size,
dHCP, µm
Standard deviation of the mean grain size, µm A 0 52/48 1.8 ± 0.1 1.50 0.4 46/54 1.9 ± 0.1 1.62 1.6 17/83 3.5 ± 0.2 2.10 B 0 46/54 1.7 ± 0.1 0.86 0.4 25/75 1.8 ± 0.1 0.80 1.6 9/91 3.2 ± 0.2 1.60
Declaration of interests
☒The authors declare that they have no known competing financial interests or personal relationships that could have appeared to influence the work reported in this paper.
☐The authors declare the following financial interests/personal relationships which may be considered as potential competing interests: