HAL Id: hal-03191504
https://hal.univ-reunion.fr/hal-03191504
Submitted on 7 Apr 2021
HAL is a multi-disciplinary open access
archive for the deposit and dissemination of
sci-entific research documents, whether they are
pub-lished or not. The documents may come from
teaching and research institutions in France or
abroad, or from public or private research centers.
L’archive ouverte pluridisciplinaire HAL, est
destinée au dépôt et à la diffusion de documents
scientifiques de niveau recherche, publiés ou non,
émanant des établissements d’enseignement et de
recherche français ou étrangers, des laboratoires
publics ou privés.
Public Attitudes towards Hydraulic Fracturing in
Western Newfoundland
Roberto Martínez-Espiñeira, María A. García-Valiñas, David Matesanz
To cite this version:
Roberto Martínez-Espiñeira, María A. García-Valiñas, David Matesanz. Public Attitudes towards
Hydraulic Fracturing in Western Newfoundland. Energy Economics, Elsevier, 2019, 84, pp.104492.
�10.1016/j.eneco.2019.104492�. �hal-03191504�
Public Attitudes towards Hydraulic Fracturing in Western
Newfoundland
Roberto Mart´ınez-Espi˜
neira
1Department of Economics, Memorial University of Newfoundland, Canada
Mar´ıa ´
A. Garc´ıa-Vali˜
nas
Oviedo Efficiency Group, Departamento de Economia, Universidad de Oviedo, Spain
David
Matesanz
Departamento
de Economia Applicada, Universidad de Oviedo, Spain
1Corresponding author: Department of Economics, Memorial University of Newfoundland, Canada Tel:
Abstract
Hydraulic fracturing or “fracking” is an emerging unconventional technology in the oil and gas (OG) exploitation sector linked to high levels of uncertainty. In this paper, we examine the level of support for fracking in the province of Newfoundland and Labrador (NL). This province is also one of the regions of the country in which fracking could be performed and whose economy could substantially benefit from the availability of this new source of energy resources. However, there remain serious obstacles to the social acceptability of fracking among the people of NL and, in particular, the prospect of fracking in Western Newfoundland (WNL) is a highly controversial issue. This area hosts one of the most highly valuable natural areas in the province (Gross Morne National Park). We identify key factors to oppose or support fracking. Using a multinomial logit model, we characterize di↵erent groups of citizens who oppose or support fracking and also other ‘conventional’ extractive technologies. Institutional issues, environmental risks, and socio-economic factors will be considered when explaining attitudes towards fracking. Further understanding the acceptability of this ‘unconventional’ technology should help public regulators make decisions and design optimal policies in the OG extraction sector.
Keywords: Fracking, social license to operate, public perceptions, environmental policies1
1The following nonstandard acronyms are used throughout:
NL Newfoundland and Labrador WNL Western Newfoundland OG oil and gas
HVHF High Volume Hydraulic Fracturing NIMBY “Not In My Backyard”
1
Introduction
Geologists have known for a long time now about the existence of organic-rich shale found deep below the earth’s surface in various regions of the world. However, its exploitation for the de-velopment of energy sources has been relatively limited until recently. Due to its extreme im-permeability, extracting this resource with conventional drilling techniques was not economically practical. However, recent technological breakthroughs in multi-stage hydraulic fracturing and horizontal drilling have made extracting these so-called “unconventional” sources of oil and natu-ral gas feasible. In this context, hydraulic fracturing, and more specifically High Volume Hydraulic Fracturing (HVHF), or “fracking” is considered as an emerging “unconventional” technology in the OG exploitation sector.
Canada is one of the countries whose economy stands to benefit from this new source of energy. However, Canadian production from shale is still in the early stages relative to, for example, the US2 and the Canadian provincial governments3 maintain di↵erent positions towards fracking
activities. In fact, several moratoria have been implemented or at least considered. The lack of proper information about this new technology generates a climate of confusion and controversy that makes it difficult for regulators to agree on what is the best path to follow when it comes to fracking, since they cannot be sure at this stage whether banning, authorising, or even promoting it will yield the most net benefits, both economically and politically.
An increasing number of studies on this topic have appeared in recent years, matched by substantial media interest.4 In this paper, we analyse the level of support for this unconventional
technology in the province of NL. This province is one of the regions where fracking has been considered and whose currently frail economy could substantially benefit from this source of energy resources. However, there remain serious obstacles to the social acceptability of fracking among the people of NL. In particular, the prospect of fracking in WNL is a highly controversial issue, since this area hosts one of the most highly-valuable natural areas in the province (Gross Morne National Park).
In 2013, the NL Ministry of Natural Resources placed fracking under a moratorium in the province.5 The Ministerial Statement mentions the need to undertake “public engagement to
ensure that our residents have an opportunity to comment and are fully informed before any decision is made”.6 As a result, in October 2014 a phone survey was conducted as part of the
2About a fourth of the natural gas consumed in the US in 2010 was extracted through fracking, a technique
employed in about 90% of the onshore OG wells in that country (Ehrenberg, 2012).
3In Canada, environmental and natural resources regulation fall under provincial jurisdiction. Therefore, it
is possible to observe di↵erences in the regulation of fracking. Some provinces embrace the technology (British Columbia, Alberta, and Saskatchewan), while in other provinces it is banned or placed under a moratorium (Quebec, Nova Scotia, New Brunswick, and NL). The remaining provinces either have own little of the resource or have simply not yet granted permits for drilling (Olive, 2016).
4See, for instance Thomas et al. (2017) for a extensive survey.
5For further information, check http://www.releases.gov.nl.ca/releases/2013/nr/1104n06.htm.
6The attitude of the NL government contrasts with other situations in which the public opinion about
frack-ing is ignored. That is the case of UK government, which recently dropped a question related to frackfrack-ing from a general public opinion survey: https://www.independent.co.uk/news/uk/politics/fracking-government-question-public-opinion-survey-fossil-fuels-lancashire-cuadrilla-a8495846.html.
process of information gathering by NL’s Minister of Natural Resources to decide whether that moratorium on fracking should be extended, or not, in WNL. In response to views expressed by the public, the NL Government maintained the moratorium, not accepting applications for OG exploration using hydraulic fracturing.
Using the data obtained from this survey, we analyse the main factors behind the opposition to or support for fracking in NL. We consider the influence of institutional issues, concerns about environmental impacts, and socio-economic considerations on public attitudes towards fracking. We judge that knowledge about the determinants of the acceptability of this unconventional tech-nology and the attitudes towards the associated uncertainties surrounding its application may aid public regulators in designing the optimal policies in the OG extraction sector. As O’Connor and Fredericks (2018) and Howell (2018) pointed out, the socioeconomic, environmental, regional con-texts, and even the timing context shape public perceptions. Therefore, this paper contributes to the literature by filling this gap in a geographical location of high ecological and natural value.7
We are interested in identifying di↵erent groups of citizens, according to their views of several OG extracting technologies. Therefore, we also link public attitudes towards fracking with views about more ‘conventional’ types of OG exploitation in NL, so we can characterize detractors and supporters of fracking and alternative technologies to extract OG. Our findings help us identify di↵erent socio-economic profiles in each case. However, no evidence is detected of a proximity e↵ect on attitudes towards exploitation activities, while self-reported knowledge about fracking is a significant explanatory factor.
1.1
The role of fracking in the exploitation of OG
Conventional OG exploitation is based on drilling a vertical wellbore into permeable rock forma-tions. This traditional extraction technique eventually leads to pressures in the play to drop, di-minishing the production returns in the sector. New technologies able to exploit resources located in impermeable rock formations become thus increasingly sought after OG in difficult-to-access pockets (Holahan and Arnold, 2013).
Fracking (as HVHF is commonly referred to) consists of injecting large quantities of water,8
sand, and chemicals deep below the earths surface at a very high pressure, so that the sedimentary rock can be broken and the oil and natural gas can be released. Combining horizontal and vertical drilling techniques,9 fracking creates new channels from which unconventional fossil fuels can be
extracted, making it economically feasible to extract OG from shale. These advances are expected to result in a revolutionary shift in patterns of worldwide energy production (IEA, 2012).
As it is often the case of other energy developments, the prospect of fracking usually elicits mixed reactions. The optimism associated with the positive outcomes of further exploration and extraction of OG has been at least partially o↵set by widespread concerns about its potential
7Gros Morne National Park is one ot the most valuable natural areas in Canada.
8Shale gas extraction requires 50100 times more water than the extraction of conventional gas (Jenner and
Lamadrid, 2013).
9Note that fracking needs of a deeper vertical well, potentially double the depth of a conventional well (Holahan
social, economic, and environmental impacts (Brasier et al., 2011; Willits et al., 2013; Wolske et al., 2013). Glowing descriptions of improved economic conditions, labour market outcomes, and general prosperity compete with frightening reports of environmental degradation, health risks, and seismic e↵ects (Willits et al., 2013).
Having access to OG in impermeable material leads to the expansion of naturally occurring fissures and the generation of additional ones (Holahan and Arnold, 2013). Thus, fracking has been linked to issues including pollution and depletion of ground and drinking water (Abdalla and Drohan, 2010), usually mentioned as a main concern by the public (Wolske et al., 2013; O’Brien and Hipel, 2016); emissions of greenhouse gases (Howarth et al., 2011); leakage of methane into tap water, which could make it flammable and explosive (Osborn et al., 2011; Ehrenberg, 2012); and seismic activity (NAS, 2012).10 In some jurisdictions, concerns have also been raised in relation
to the lack of regulations about and enforcement of rules governing the disclosure of the mix of chemicals used by extracting companies (Kirker and Burger, 2011; Wolske et al., 2013),11as well
as the handling of potentially toxic wastewater flowback (Colborn et al., 2011; Bamberger and Oswald, 2012). Furthermore, when it comes to considering the ills of fracking, public opinion polls have revealed wider concerns, such as those related to undesirable social e↵ects of the expansion of extractive operations, even if not directly related to the use of fracking as such (Brasier et al., 2011; Adgate et al., 2014; Jacquet, 2014; Israel et al., 2015).
All of these concerns have been amplified, at least within some opinion circles, by alarming reports fuelled by an increasing amount of media attention (Davis and Fisk, 2014), which contrasts with the relative paucity of the supply of scientific contributions on the topic (Ehrenberg, 2012). Indeed, fracking is such a hot “topic of conversation” in mass media and social media that it is surprising how little the average citizen knows about it, with some studies suggesting that there remains considerable confusion about what fracking actually means and what it entails. For example, most laypeople conceive of hydraulic fracturing as a more comprehensive set of procedures than what industry experts (and regulators) would (Wolske et al., 2013). Many laypeople also attribute some risks that are also common to other OG extractive techniques with which they have no issue (Ehrenberg, 2012) only to fracking or assume that it is a never-before tried technique, instead of something that, not including several newer aspects, has been used since the 1940s.12
The familiarity with fracking is still relatively limited, although has increased over time. For instance, Wolske et al. (2013) estimate that about 50-60% of poll respondents in the US are at least “somewhat aware” of fracking and that this awareness appears to be increasing. Boudet et al. (2014) national US poll shows that 39% had heard nothing at all about fracking; 16% “a
10Although this problem seems to be related mainly to wastewater disposal rather than the fracturing process
itself (Ehrenberg, 2012).
11In the US, extracting companies are not required to reveal the exact mix of chemicals they use for fracking,
something they often feel reluctant to do, because they each have their own formulas that they have developed over years of research. This reluctance to disclose these proprietary formulas is often misconstrued as the desire to cover up the use of toxic chemicals from the unsuspecting public (Kirker and Burger, 2011).
12It is its combined use with horizontal drilling that is more recent (only being done within the last decade) and
more revolutionary but fracking as such has indeed been used for decades now. The use of larger quantities of water is also something that di↵erentiates modern fracking from its older versions (Wolske et al., 2013).
little”; 22% “some” and only 9% “a lot”. In the United Kingdom the extensive media coverage of shale gas has resulted in 74% of the British public having heard of it (Whitmarsh et al., 2015). Some US polls suggest more familiarity with fracking at the state/local level than at national level when unconventional OG developments are active or proposed in those states (Kriesky et al., 2013; Kromer, 2015). However, Stedman et al. (2016) suggest higher levels of knowledge about the shale gas industry in the UK than in the US, even though there are many more developments in the latter. Overall, the literature agrees that the level of public awareness and knowledge is quite low, if increasing, and when respondents report they are aware of fracking, their level of knowledge is uneven (Graham et al., 2015). Socio-economic traits that tend to be behind higher degrees of awareness about fracking include being male, older, more educated, and richer.13 We expect the
same type of demographic e↵ects on individuals general knowledge about the OG industry in NL. Further fuelling the scope for confusion, scientific evidence is relatively inconclusive about some aspects (Ehrenberg, 2012) of the issue. Indeed, there is still a high level of scientific uncertainty surrounding the potential environmental impacts of shale gas (Vidic et al., 2013). On top of that, the current economic climate, characterized by low oil prices, makes it less clear that the benefits associated with fracking are worth the potential risks.
1.2
Previous works on attitudes towards fracking
Several demographic characteristics have been identified as drivers of attitudes towards fracking. For instance, women are more frequently against fracking (Theodori, 2009; Brasier et al., 2011; Wolske et al., 2013; Boudet et al., 2014; Davis and Fisk, 2014; Boudet et al., 2016; O’Connor and Fredericks, 2018; Lachapelle et al., 2018), just like they tend to be more wary of risks in general and environmental risks in particular (Xiao and Dunlap, 2007).14 We also expected males to be
less likely to feel neutral about fracking (Climek et al., 2013). Therefore, our first hypothesis is that males are generally more positive towards fracking in WNL.
Evidence on the influence of age, income, and formal education has been less consistent (Boudet et al., 2014). Older respondents tend to be more in favor of fracking, perhaps because they are usually found less concerned with environmental issues (Boudet et al., 2014; Davis and Fisk, 2014; Boudet et al., 2016). On the other hand, younger respondents might be better educated in general, likely also having more knowledge about climate change and other environmental risks and, therefore, they may be expected to be more aware of environmental risks and more supportive of renewable energies (Hayward, 2012; Zhou, 2015). In their Canadian study, Lachapelle et al. (2018) found, however, no significant e↵ect of age on attitudes towards fracking.
Income is an important variable in environmental public attitudes, with richer individuals being more concerned about environmental problems, since environmental quality appears to be in most instances a normal good (Franzen and Meyer, 2010; Franzen and Vogl, 2013; Zhou, 2015). However, others failed to detect statistically significant e↵ects of income on opposition towards
13See Wolske et al. (2013) for a list of surveys that found evidence of these e↵ects in the case of the US. 14However, Clarke et al. (2016) found gender not to be significant when they included distance and political
shale gas extraction (Boudet et al., 2014; Davis and Fisk, 2014).
Not only is environmental quality a normal good; rich respondents might, in principle, also be expected to need the economic benefits of fracking less than their less well-o↵ counterparts. The personal benefits derived from a certain activity tend to a↵ect the perception of the risks associated with it, which in this case would also likely a↵ect the attitudes towards fracking. This type of e↵ects have been documented in at least one Canada-wide survey,15 which focused on
gathering opinions about a fracking moratorium. In the case of NL, there might be a more positive view of the industry among those with higher incomes, since many of those in the higher income brackets would have in recent years benefitted directly or indirectly from the operations of the OG industry and would expect to also benefit it in the future. In any event, we hypothesize that richer individuals would be more likely to have reached a conclusion about their views on fracking and less likely, thus, to remain neutral or uncertain when asked about their position about it.
Like income, educational attainment is commonly associated with concern about the environ-ment (Zhou, 2015; Franzen and Meyer, 2010) and better educated respondents have been found less likely to support shale gas extraction (Jacquet, 2012; Jacquet and Stedman, 2013; Wolske et al., 2013; Boudet et al., 2014; Whitmarsh et al., 2015; Boudet et al., 2016). However, the opposite (Boudet et al., 2014) or no significant e↵ect has also been found (Clarke et al., 2016; Andersson-Hudson et al., 2016; Davis and Fisk, 2014; Lachapelle et al., 2018). Our working hypothesis is that more educated respondents would be less likely to be ambivalent about fracking in WNL.
We expected those respondents with more information/knowledge about fracking to be less supportive of the practice, following previous results from the US and Canada (Boudet et al., 2014; Andersson-Hudson et al., 2016; Boudet et al., 2016; O’Connor and Fredericks, 2018; Lachapelle et al., 2018) and definitely less likely to feel neutral about the issue.
Distance to the energy development area is usually a key predictor of public attitudes. On the one hand, the “Not In My Backyard” (NIMBY) phenomenon suggests a negative relation between distance and support. However, empirical work on public attitudes towards shale gas extraction has shown mixed results (Jacquet, 2012; Jacquet and Stedman, 2013; Boudet et al., 2014; Davis and Fisk, 2014; Whitmarsh et al., 2015; Clarke et al., 2016). As Ladd (2014) pointed out, fracking seems to be a double-edged sword for impacted communities, with respondents who reside closer to extraction sites exhibiting a more complex understanding of both the risks and benefits and incorporating them into their calculations about whether to support or oppose local developments. In fact, the NIMBY phenomenon has now evolved into di↵erent acronyms (‘Not in any backyard’, ‘Please in my backyard’), suggesting the complexity and heterogeneity of the e↵ect of geography on public attitudes (Boudet, 2011; Dokshin, 2016; Boudet et al., 2016).
We cannot, unfortunately, explore these e↵ects of attachment and identity, due to data lim-itations. However, we believe that analyzing the role of geographic distance still is important, especially because one key area where the shale gas is being targeted (WNL) is located far from the main population centres in the island. As previously mentioned, this part of Newfoundland
15For further details, check the EKOS research poll from October 2014
hosts the most important natural park on the island, suggesting a potential for strong feelings against fracking among the local population. On the other hand, and following, for instance, Davis and Fisk (2014), we expected those living in the urban areas of the province, located mainly on the other side of the insular part of NL, to be less supportive of fracking.
Institutional factors or ‘governance’ are also important shapers of public attitudes to emergent technologies and environmental risks. It is important to consider, for instance, the influence of trust in local regulators and in the environmental record and culture of the extracting companies, the opportunity for citizens to participate in decision-making about safety issues, the transparency of information, and the availability of knowledge and information from independent experts (Davis and Fisk, 2014; Graham et al., 2015). For example, in the UK, the debate about ownership of minerals and their governance has taken place at a national level, while in the US the land and minerals within belong to the landowner and governance (rules, regulations, etc.) are more often developed and implemented at the state/local level (Stedman et al., 2016).
Another governance/institutional factor is the requirement of a ‘social licence to operate’ shale gas developments, as the International Energy Agency has highlighted (IEA, 2012). The implicit assumption behind the notion of a social licence is that a better understanding of the risk and benefits of shale gas exploitation will promote stronger public support in a context a↵ected by the public’s opposition and concerns about the risk associated with shale gas (Whitmarsh et al., 2015). Social licence is seen as a community’s perceptions of the acceptability of a company and its local operations (Thomson and Boutilier, 2011). In this line, Whitton et al. (2017) show that the observed institutional governance systems in the US and UK, where room for citizen influence is limited, seem to imply an inherently lack social justice, procedural fairness, and ultimately, a social license to operate. We expect, knowledge/information to be positively associated to the perceived existence of social licence to operate and consequently support for fracking. Our hypothesis is that a stronger perception that operators enjoy a social licence to operate will be linked to stronger support for fracking in WNL.
Moreover, in terms of the reasons for opposing/supporting fracking, the empirical literature has often found, not surprisingly, that respondents who expect fracking to deliver economic benefits to their region are more supportive of the practice, while those who fear environmental or health issues are much less supportive of drilling (Theodori, 2009; Jacquet, 2012; Kriesky et al., 2013; Jacquet, 2014; Boudet et al., 2014; Graham et al., 2015; Whitmarsh et al., 2015; Andersson-Hudson et al., 2016; Boudet et al., 2016; Whitworth et al., 2017; Cotton and Charnley-Parry, 2018). For instance, Boudet et al. (2016) found that employment levels in the natural resources and mining sector in the respondents county, as well as residing in an area experiencing active OG development, significantly increase support for fracking. In general, spatial and community factors contribute to shaping support or opposition to shale gas development. However, some studies have found that both the economic positive and environmental negative perceptions often become less clear as a↵ected communities develop more experience of fracking activities (Anderson and Theodori, 2009; Brasier et al., 2011; Jacquet and Stedman, 2011). Our hypothesis is that higher weight of environmental reasons leads to stronger opposition to fracking. Similarly, more weight of economic
reasons will be linked to increased support for fracking.
2
Material and Methods
2.1
Data
In October 2014, an independent panel was appointed by NL ’s Minister of Natural Resources and tasked with conducting a public review of the socio-economic and environmental implications of hydraulic fracturing in WNL and making recommendations on whether hydraulic fracturing should be undertaken in that area of the province. As part of the process of information gathering associated with the Panel’s work, a survey (Hydraulic Fracturing in Western Newfoundland )16was
commissioned to MQO Research, a market research firm. This phone survey was administered to residents of the province of NL and aimed at studying their knowledge of and attitudes towards the energy industry in WNL and the issue of fracking in particular.
Item Number Per cent
In favor of exploring and extracting OG in WNL AND hydraulic fracturing 138 17 In favor of exploring and extracting OG in WNL, BUT NOT hydraulic fracturing 211 25 Oppose hydraulic fracturing in WNL BUT NOT exploring and extracting OG 125 15 Oppose hydraulic fracturing AND exploring and extracting OG in WNL 74 9 Consider myself to be neutral on the topic 89 11 I have not decided or I am unsure 197 24
Total 835 100
Table 1: About exploring and extracting OG and about fracking in WNL
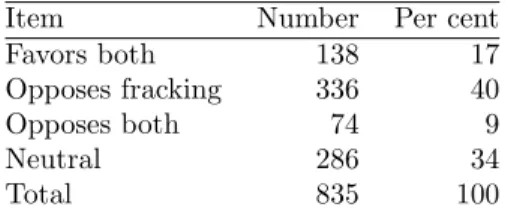
Respondents were asked about their views on further exploration for OG resources in WNL and about fracking in particular, as well as about their views of these types of activities in WNL. In Table 1, we show the distribution of the responses to the question about attitudes towards exploration and extraction of OG, fracking, and about these activities specifically in WNL. Note that the table shows weighted frequencies, so the figures are more representative of the general population of NL.
Most respondents who declared to have made up their minds about the issue felt that there should be further exploration. However, the prospect of fracking itself is much less palatable. About 30% of respondents do not consider it worth the risk. However, once again, a sizable proportion of respondents who said they did not know or refused to provide an answer.
Respondents’ feelings about OG exploring activity and extraction, as well as about hydraulic fracturing in WNL tend to be mixed. In fact, only some 17% of all respondents are in favor of both exploring and hydraulic fracturing, while just 9% oppose both. Four in ten respondents report
16The CARE (Collaborative Applied Research in Economics) Initiative (Memorial University of Newfoundland)
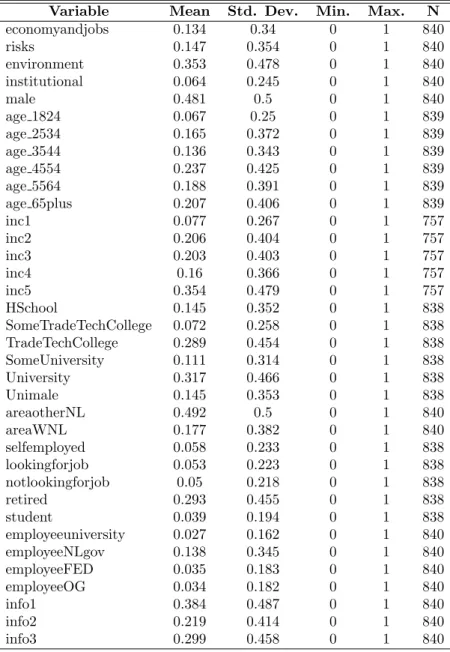
Variable Mean Std. Dev. Min. Max. N economyandjobs 0.134 0.34 0 1 840 risks 0.147 0.354 0 1 840 environment 0.353 0.478 0 1 840 institutional 0.064 0.245 0 1 840 male 0.481 0.5 0 1 840 age 1824 0.067 0.25 0 1 839 age 2534 0.165 0.372 0 1 839 age 3544 0.136 0.343 0 1 839 age 4554 0.237 0.425 0 1 839 age 5564 0.188 0.391 0 1 839 age 65plus 0.207 0.406 0 1 839 inc1 0.077 0.267 0 1 757 inc2 0.206 0.404 0 1 757 inc3 0.203 0.403 0 1 757 inc4 0.16 0.366 0 1 757 inc5 0.354 0.479 0 1 757 HSchool 0.145 0.352 0 1 838 SomeTradeTechCollege 0.072 0.258 0 1 838 TradeTechCollege 0.289 0.454 0 1 838 SomeUniversity 0.111 0.314 0 1 838 University 0.317 0.466 0 1 838 Unimale 0.145 0.353 0 1 838 areaotherNL 0.492 0.5 0 1 840 areaWNL 0.177 0.382 0 1 840 selfemployed 0.058 0.233 0 1 838 lookingforjob 0.053 0.223 0 1 838 notlookingforjob 0.05 0.218 0 1 838 retired 0.293 0.455 0 1 838 student 0.039 0.194 0 1 838 employeeuniversity 0.027 0.162 0 1 840 employeeNLgov 0.138 0.345 0 1 840 employeeFED 0.035 0.183 0 1 840 employeeOG 0.034 0.182 0 1 840 info1 0.384 0.487 0 1 840 info2 0.219 0.414 0 1 840 info3 0.299 0.458 0 1 840
being in favor of exploring for and extracting OG but are not in favor of hydraulic fracturing in WNL. More than three in ten respondents considered themselves to be neutral or undecided.
The summary statistics in Table 2 are calculated using sampling weights that make our results more representative of the population. This is because the sample age pyramid does not fully match the population age pyramid in NL, although some age brackets match very close their counterparts in the actual population structure. For instance, the NL Government has estimated proportions of 12% and 16% for the 35-44 and 55-64 age brackets in 2012 (NL Statistics Agency, 2012). Those figures are very close to those found in our sample. However, other age brackets are not so close to their population equivalents.17 Additionally, around 18% of respondents reside in WNL.
Most respondents in our sample earn income over $100,000 per year and 60% of them have trade/technical college or university degrees. When it comes to their employment status, some interesting patterns emerge. On the one hand, there is a high percentage of retired respondents (around 29%), while 54% of them are employed. It is also noteworthy that almost 14% of respon-dents work for NL government, and a small percentage (4%) are employed by the OG industry.
The reasons why respondents chose one of the response categories summarizing their opinion are dominated by economic and environmental concerns. Institutional reasons are less frequent (around 7%). In general, NL people do not think they are well informed about OG extractive activities (inf o1). On average, self-reported knowledge about this sector is less than 5 on a 1-10
scale. Self-reported knowledge about fracking activities (inf o3) is even poorer than the general
case. Curiously, the higher level of dispersion is observed in the case of this variable. Finally, the information is even worse when it comes to describe the OG extractive activities in WNL (inf o2).
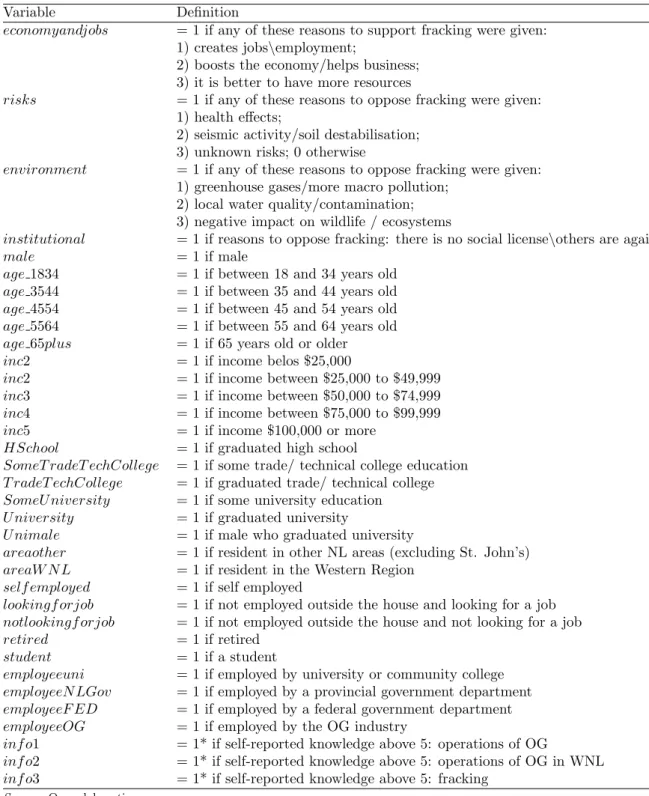
Guided by previous studies, we considered several groups of variables (defined in Table 3) to explain the views about OG exploration and extraction activities in WNL. The first group includes indicators of the types of reasons respondents said informed their attitudes towards frack-ing. Not surprisingly, impacts on economic development and job creation are prominent but also environmental concerns, health, and seismic risks, together with institutional reasons, are the most commonly stated types of arguments behind favoring/opposing extraction activities in WNL. The second group includes socio-demographic indicators: gender, age, income, education attainment, and employment status. Another set of variables with indicators of the geographical location of the respondents are included, in order to test for the NIMBY e↵ect. Finally, the respondents self-reported knowledge about exploring and extraction activities in WNL is also captured through three di↵erent categorical variables, including generic and more specific topics.
17For example, the population under 35, which is the reference age bracket in our regression models, seems to be
underrepresented in our sample (37% versus 23%). The 45-54 age bracket is overrepresented in the sample, by eight percentage points. In any case, note that figures are referred to di↵erent periods, so population figures could vary slightly for 2014.
Variable Definition
economyandjobs = 1 if any of these reasons to support fracking were given: 1) creates jobs\employment;
2) boosts the economy/helps business; 3) it is better to have more resources
risks = 1 if any of these reasons to oppose fracking were given: 1) health e↵ects;
2) seismic activity/soil destabilisation; 3) unknown risks; 0 otherwise
environment = 1 if any of these reasons to oppose fracking were given: 1) greenhouse gases/more macro pollution;
2) local water quality/contamination; 3) negative impact on wildlife / ecosystems
institutional = 1 if reasons to oppose fracking: there is no social license\others are against male = 1 if male
age 1834 = 1 if between 18 and 34 years old age 3544 = 1 if between 35 and 44 years old age 4554 = 1 if between 45 and 54 years old age 5564 = 1 if between 55 and 64 years old age 65plus = 1 if 65 years old or older inc2 = 1 if income belos $25,000
inc2 = 1 if income between $25,000 to $49,999 inc3 = 1 if income between $50,000 to $74,999 inc4 = 1 if income between $75,000 to $99,999 inc5 = 1 if income $100,000 or more
HSchool = 1 if graduated high school
SomeT radeT echCollege = 1 if some trade/ technical college education T radeT echCollege = 1 if graduated trade/ technical college SomeU niversity = 1 if some university education
U niversity = 1 if graduated university
U nimale = 1 if male who graduated university
areaother = 1 if resident in other NL areas (excluding St. John’s) areaW N L = 1 if resident in the Western Region
self employed = 1 if self employed
lookingf orjob = 1 if not employed outside the house and looking for a job notlookingf orjob = 1 if not employed outside the house and not looking for a job retired = 1 if retired
student = 1 if a student
employeeuni = 1 if employed by university or community college employeeN LGov = 1 if employed by a provincial government department employeeF ED = 1 if employed by a federal government department employeeOG = 1 if employed by the OG industry
inf o1 = 1* if self-reported knowledge above 5: operations of OG
inf o2 = 1* if self-reported knowledge above 5: operations of OG in WNL inf o3 = 1* if self-reported knowledge above 5: fracking
Source: Own elaboration.
*: Originally ordered in a 1 to 10 scale.
3
Methodology
Since there is no meaningful order that could be attached to the response categories in our depen-dent variable, a multinomial logit model was used to explain the responses.
Our multinomial model simplified the original categorical dependent variable as to indicate the choice made by respondents among four (rather than the original six) categories. This simplification involved the obvious equivalence of categories 2 and 3, which are really the same overall statement with only di↵erent order of the substatements.
For simplicity, Category 5 was merged with Category 6, so all ‘unsure’, ‘not responding’, and ‘undecided’ respondents were lumped together. A further simplification involved the independent variables, in particular the merging of age categories ‘18 to 24’ and ‘25 to 34’, so the base age category is in this case ‘18 to 34’.
Let Uij be the maximum utility18of respondent i when she stated option j, where j=1,2,3,4 is
given by the four simplified options described above. Then, this utility can be written as:
Uij= Vij(Xi) + "ij (1)
where Xi is the vector of exogenous variables (regressors) that a↵ects the respondent’s attitudes
and "ij are the error terms. The probability that respondent i chooses option j is given by
Pij= P r(Uij Uik) 8 k 6= j (2)
Combining these two equations yields
⇡ij= P r("ik Vij(Xi) Vik(Xi) + "ij) 8 k 6= j (3)
, which defines the probability that option j be selected as
⇡j= P r[y = j] (4)
Introduce four binary variables yj such that
yj=
(
1 if y = j
0 if y6= j (5)
Thus yj equals one if alternative j is the stated option and the remaining yk equal zero, so
exactly one of the y1, y2, y3 or y4 will be nonzero. The multinomial density for observation on
respondent i can then be written as: f (y) = ⇡y1 1 ⇥ ⇡ y2 2 ⇥ ⇡ y3 3 ⇥ ⇡ y4 4 = ⇧4j=1⇡ yj j (6)
18Or, equivalently, instead of utility one could envision a measure that represents how well the stated options
where the set of regressors Xi include respondent characteristics, yielding the probability that
respondent i chooses the jth option as:
⇡ij= P r(y = j) = Fj(Xi, ), j = (1, 2, 3, 4), i = 1, 2, , N (7)
By adopting the multinomial logit model, we more specifically asumme that the function that generates these probabilities is given by:
P r(y = j|X) = P4exp(X j|b) j=1exp(X j|b)
(8) and the objective is to estimate the three sets of coefficients j|bthat would make it possible to
predict the e↵ects of the regressors X on the probability that option j was chosen over the ‘base’ option b. From those estimates, several postestimation results in terms of marginal and discrete e↵ects and predicted probabilities can be derived to provide a notion of the quantitative e↵ects of each regressor on the probability of a respondent choosing each of the four options.
Our model relies on the assumption of independence of irrelevant alternatives ((McFadden, 1974; Cheng and Long, 2007). We used plain and seemingly unrelated estimation versions of a Hausman test (Hausman and McFadden, 1984) to test the validity of this assumption and failed to reject it.
4
Results
4.1
Multinomial logit regression
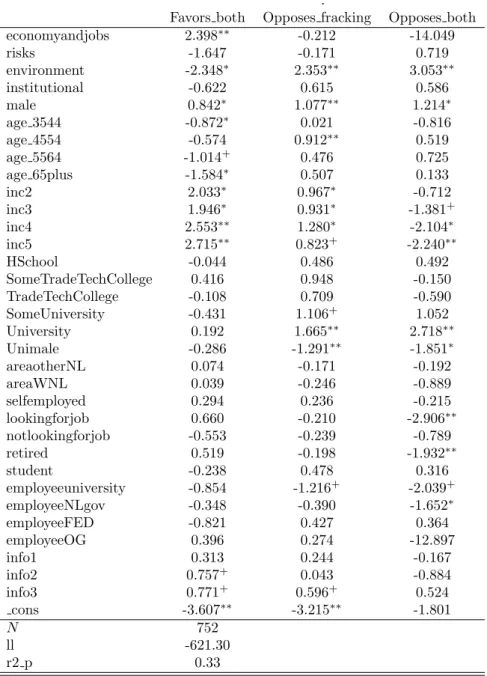
Table 5 reports the results of applying the multinomial logit model to the responses about public attitudes towards OG extraction in general, and in particular towards fracking, with the combina-tion of categories “dont know, “neutral response, and “undecided combined (as shown in Table 4) and held as the base outcome. Only a few coefficients are found significant but most of the results are in line with previously detected relationships between explanatory variables and responses about views on fracking and the activities of the OG sector.
Item Number Per cent Favors both 138 17 Opposes fracking 336 40 Opposes both 74 9
Neutral 286 34
Total 835 100
Beginning with the arguments for and against OG extraction, we find that economic consid-erations and environmental issues are the most significant issues. Respondents who identify OG extraction as a contributor to economic development and job creation (variable economyandjobs) are more likely to favor both conventional and unconventional extraction technologies. When respondents link fracking and other extraction methods to harmful impacts on ecosystems and natural resources (environment), respondents are less likely to favor both exploring technologies and more likely to oppose them. Surprisingly, neither health risks nor institutional factors have a significant impact on NL citizens views on fracking and conventional OG extraction technologies. Males are significantly more likely to support both further exploration and extraction and fracking in WNL than to be neutral about it (or unable/unwilling to provide a response). However, and illustrating how the interpretation of a multinomial logit can be confusing, males are also much more likely to choose the second or third option (both opposing fracking) than the base category (neutrality), so post-estimation analysis will be needed to get an idea about how gender a↵ects the choice between the first and the remaining options. Overall, the substantial e↵ect is that males are less likely than females to be undecided/neutral about these energy development issues.
Those respondents between 35 and 44 are less likely to favor both exploring-extracting and fracking in WNL than respondents under 35. Respondents in the next age category (45 to 54) are significantly more likely to favor exploration and extraction, while opposing fracking, than to feel neutral about these issues. Even older respondents are less likely to favor both items.
We found strong relationships linking income levels to attitudes towards energy development issues and fracking in particular. Richer respondents are significantly less likely to position them-selves as neutral and also less likely to oppose both exploration-extraction and fracking, while being significantly more likely to favor both processes. University educated respondents are sig-nificantly more likely than those without a high-school diploma to oppose both items or at least fracking. We also found that University-educated males are less likely to oppose fracking and both conventional and unconventional extraction technologies than women. The interaction between gender and education variables (identified by the interaction term Unimale) leads to this finding, which could be linked to the fact that there is a gender-based di↵erence between higher education degrees that lead to opposition to natural resource exploitation and those that have the opposite e↵ect on graduates.
However, the NIMBY phenomenon evidence is not clearcut, since no significant e↵ect of the variable areaWNL was detected in any of the di↵erent profiles analyzed. This result could be partially explained by the introduction of variables related to arguments to support or oppose fracking. The dichotomy between the e↵ects of considerations about income and employment status and those about the environment is likely capturing any possible proximity e↵ect.
Those su↵ering the consequences of the downturn in the economic cycle are, not surprisingly, less inclined to oppose both further development of energy sources in WNL and fracking. We find a significant e↵ect of variable lookingforjob, which is an indicator that the respondent is unemployed
.
Favors both Opposes fracking Opposes both economyandjobs 2.398⇤⇤ -0.212 -14.049 risks -1.647 -0.171 0.719 environment -2.348⇤ 2.353⇤⇤ 3.053⇤⇤ institutional -0.622 0.615 0.586 male 0.842⇤ 1.077⇤⇤ 1.214⇤ age 3544 -0.872⇤ 0.021 -0.816 age 4554 -0.574 0.912⇤⇤ 0.519 age 5564 -1.014+ 0.476 0.725 age 65plus -1.584⇤ 0.507 0.133 inc2 2.033⇤ 0.967⇤ -0.712 inc3 1.946⇤ 0.931⇤ -1.381+ inc4 2.553⇤⇤ 1.280⇤ -2.104⇤ inc5 2.715⇤⇤ 0.823+ -2.240⇤⇤ HSchool -0.044 0.486 0.492 SomeTradeTechCollege 0.416 0.948 -0.150 TradeTechCollege -0.108 0.709 -0.590 SomeUniversity -0.431 1.106+ 1.052 University 0.192 1.665⇤⇤ 2.718⇤⇤ Unimale -0.286 -1.291⇤⇤ -1.851⇤ areaotherNL 0.074 -0.171 -0.192 areaWNL 0.039 -0.246 -0.889 selfemployed 0.294 0.236 -0.215 lookingforjob 0.660 -0.210 -2.906⇤⇤ notlookingforjob -0.553 -0.239 -0.789 retired 0.519 -0.198 -1.932⇤⇤ student -0.238 0.478 0.316 employeeuniversity -0.854 -1.216+ -2.039+ employeeNLgov -0.348 -0.390 -1.652⇤ employeeFED -0.821 0.427 0.364 employeeOG 0.396 0.274 -12.897 info1 0.313 0.244 -0.167 info2 0.757+ 0.043 -0.884 info3 0.771+ 0.596+ 0.524 cons -3.607⇤⇤ -3.215⇤⇤ -1.801 N 752 ll -621.30 r2 p 0.33 +p < 0.10,⇤p < 0.05,⇤⇤p < 0.01
Table 5: Multinomial logit on four-category statements about exploration and extraction and fracking in WNL
and currently looking for a job. Similarly, retirees, who were more likely to expect a positive impact of fracking on WNL, are also significantly less likely to state their opposition to both items. The positive e↵ect on the other categories is, however, not statistically significant. Looking at specific types of employment, we find that Provincial Government employees are less likely to oppose both items as compared with employees of any other business (other than the Federal government or the OG industry). Perhaps not surprisingly, since just like Provincial Government employees their incomes are to a large extent linked to the public revenues generated by the OG industry, University19employees are less likely to oppose both the extraction of OG in WNL and fracking.
Respondents with a higher level of self-reported knowledge about the operations of the OG industry in WNL are substantially and significantly more likely to favor both further developments in that part of the province and also fracking. Moreover, those respondents with better knowledge about fracking are less likely to keep neutral about this unconventional technology.
4.2
Predicted probabilities for selected respondent profiles
Nonlinear models yield estimated marginal e↵ects of the explanatory variables that are not constant but, instead, depend on the values of all the variables in the model. For this reason, depending on where we measure the e↵ect of a variable the e↵ect on the probability of a given outcome of the dependent variable will be di↵erent.
For example, how much a little extra income a↵ects the probability that someone is in favor of further OG exploration depends not only on how rich that person is but also on her age, education level, and so on.
One way to deal with this issue is to report marginal e↵ects at the means, that is, for the individual with average values of all explanatory variables. This would enable one to consider the marginal e↵ect of extra income on the probability for the ‘average’ or ‘typical’. However, since all of the explanatory factors in our models are themselves categorical variables, our hypothetical ‘typical’ individuals can in fact be anything but. For example, a given real individual would fall in a given income category, rather than having an average probability of falling in each of the di↵erent income categories.
For this reason, we also report predicted probabilities for di↵erent respondent ‘profiles’. These are archetypes of respondent with plausible characteristics. For each of the St. John’s CMA (Cen-sus Metropolitan Area) and the WNL region, we look at four male and four female respondents with di↵erent combinations of education, age, and income.20 For each of the profiles, we calculate
the predicted probabilities that they choose each of the outcomes in the dependent variable anal-ysed. We report these results in the Appendices. Appendix A includes predictions for respondents from St. John’s and Appendix B includes respondents from WNL.
19The only university in the province is Memorial University of Newfoundland.
20In all cases, the rest of the predictors, all binary indicators, are set to the value zero for the prediction. That
means that the predictions are calculated for individuals who belong to the benchmark category of a categorical indicator. For example, they are employed (not students, not retired, etc.) by someone other than Memorial University, the provincial government or the OG industry and so on.
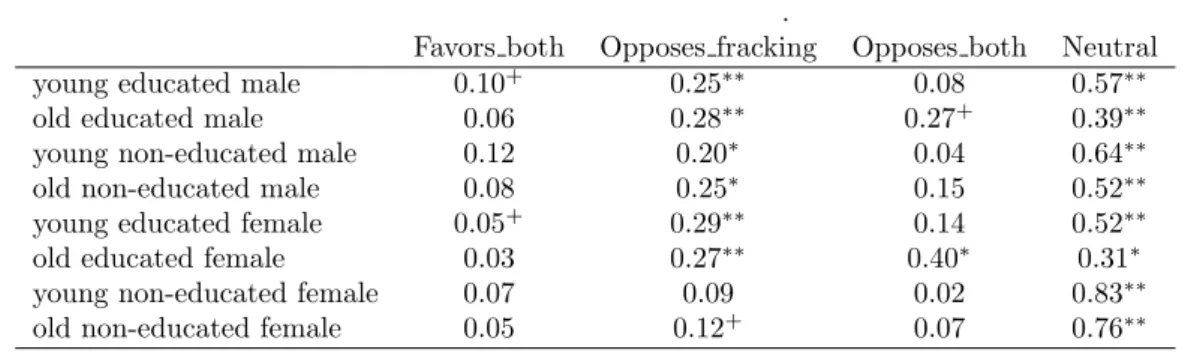
For example, we can see in Table A1 (Appendix A) that among all types of St. John’s re-spondents who earn a midrange income, the most common attitude towards OG exploration is general neutrality. However, the most likely type of respondent to be neutral about both types of activity considered are young (aged 35 to 44) uneducated (that is, without a completed higher education degree) females. This pattern seems to persist between Tables A1 and Table A6. On the other hand, the type of respondents most likely to favor both exploring and extracting oil and natural gas in WNL and hydraulic fracturing are, both in St. John’s and WNL and regardless of income level, young uneducated males, who would more likely expect to directly depend for their livelihood on the success of the OG extraction industry.
Only the most sizable predicted probabilities are reported as significantly di↵erent from zero. In many other cases, the predicted probability for a given outcome is so small that our model cannot reject the null hypothesis that it is zero.
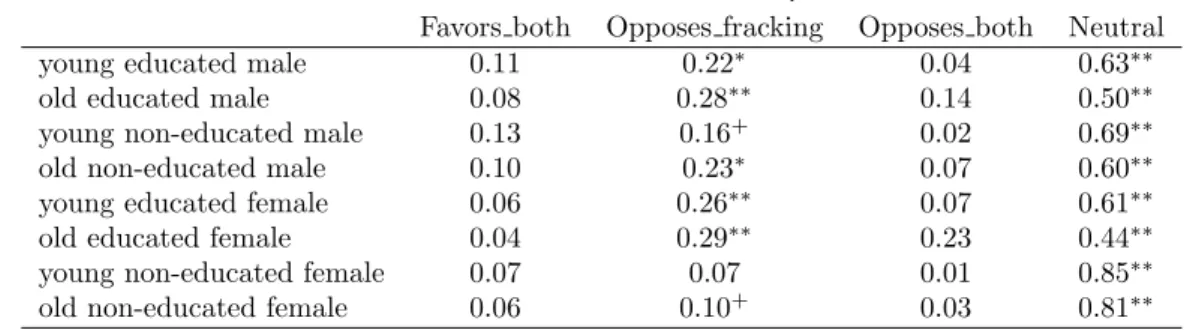
The estimates presented in Table 5, and the associated predicted probabilities shown in Ta-bles A1 to A6 do not reveal any significant evidence of the NIMBY e↵ect. The results in St. Johns and WNL are very close each other for all the socio-economic groups considered. Only older women (women older than 55) with university education who live in WNL present systematically higher probabilities to oppose fracking, especially when they earn lower incomes.
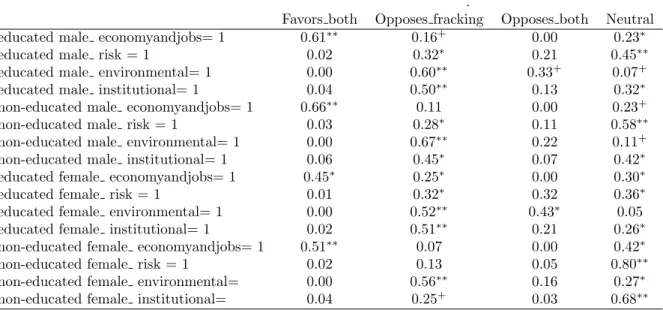
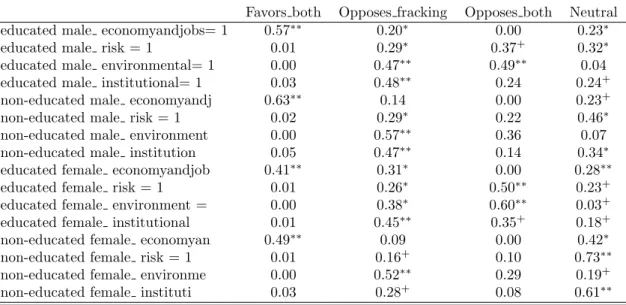
Tables A7 and A8 display predicted probabilities according to the main reasons that moti-vate support or opposition to fracking for respondents within the median income bracket. When comparing the results of West Newfoundland with those from St. John’s, we observe an indis-tinguishable pattern of predictions according to motives between the two regions in the sample: in both being concerned about the economy and job prospects makes respondents (particularly males and less educated respondents) very likely to favour both development options. However, we do see higher probabilities of opposing fracking (only) in WNL than in St. John’s for almost every socio-economic profile but particularly for those (except non-educated females) who declared a concern about the environment as a reason for their view towards the oil and gasdevelopment options. Therefore, in terms of attitudes to fracking, these more comprehensive postestimation re-sults in Appendix C do reveal a sort of NIMBY e↵ect. Additionally, respondents of all types from WNL are also clearly more likely to feel ambivalent (neutral ) about both development options. Conversely, they are also less likely to have stated an opposition to both development options.
It is those respondents who have environmental reasons in mind who lead to the higher proba-bilities to exclusively oppose fracking observed in WNL. As mentioned in previous sections, WNL contains Gros Morne National Park, a UNESCO World Heritage Site covering 1,805 square kilo-metres.21 The presence of this site likely explains to a large extent these higher probabilities of
opposing fracking in WNL because of environmental concerns.
5
Discussion
As most studies, we find that economic and environmental issues are the main drivers behind, respectively, support and opposition to fracking (Boudet et al., 2014; Davis and Fisk, 2014; Boudet et al., 2016; Howell, 2018). Since, overall, we find more opposition to than support for fracking, its environmental threat seems to be a more important issue than its potential economic benefits in shaping public perceptions around fracking. In this respect, NL public attitudes would be more similar to the European ones and di↵erent from the most common support in the US and some Canadian provinces (Thomas et al., 2017; Bomberg, 2017; O’Connor and Fredericks, 2018; Howell, 2018). Both the economy and the environment are key shapers of public attitudes regarding not only fracking but also renewable energy policies or even exportation of natural gas (Olson-Hazboun et al., 2018; Pierce et al., 2018). Additionally, economic compensations to local residents facing environmental damage in this kind of resource exploitation might be viewed with cynicism and not acceptable by local citizens (Howell, 2018). Consequently, environmental impacts should be carefully studied by not only companies or government institutions involved in the exploration and exploitation of shale gas but also by independent and trusted third-party institutions and researchers/journalists/communicators.
Turning to the nexus between knowledge on the fracking issue and support, we note that the self-reported levels of knowledge about fracking and OG extractive activities in WNL are quite low and we find somehow surprising that the more knowledgeable about fracking respondents declare to be the more likely they are to favor exploitation of both fracking and conventional OG industries, or to oppose fracking. In any case, this result suggests that more information leads to a lower likelihood to feel neutral about fracking.22 Contrary to some earlier findings but in line
with Howell (2018), our results imply that increasing public knowledge about fracking will not necessarily lead to more support but only a more definite stance against or in favor of fracking and a clearer public perception about that support/opposition. This could both favor public policy decisions more aligned with public perceptions and more support for those decisions.
A caveat in our study is that knowledge about fracking and OG is self-reported. Because of this, we cannot consider them fully accurate measures of the level and quality of that knowledge. The level and accuracy of knowledge shared by the citizens of the province would be a worthwhile topic for further research. Moreover, it would be very enriching to test the impact on public sector information campaigns on citizens attitudes towards fracking or other OG industry activities.
When it comes to institutional aspects for supporting or opposing fracking and OG, we find that, in general, NL citizens do not perceive that a social license is needed to exploit OG in the province (as shown by variable institutional only 7% declare to oppose fracking because of a lack of social license to exploit shale gas resources). This result is somewhat surprising when compared to others’ (Davis and Fisk, 2014; Whitton et al., 2017). Our respondents might not be fully aware of the meaning and implication on the concept of social license.
22Boudet et al. (2014), Howell (2018) and O’Connor and Fredericks (2018) among many others found that more
We find some weak evidence of a NIMBY e↵ect. Among those arguing that environmental impacts are relevant to the discussion the probability of opposing fracking is much higher in WLN than in St. John’s. This result suggests that concerns about environmental risks outweigh those related to the economic impacts from fracking in public perception, perhaps because Gross Morne National Park is viewed as a key source of economic activity in WNL. We feel, though, that future research should explore the factors behind public attitudes and proximity to development areas, especially in the case of NL. The conflicting debate around environmental risks and economic benefits is central to understand public attitudes, because the economy of this province is so dependent on the extraction of natural resources.
6
Conclusions
This research analyzes public perceptions about fracking in NL. Social acceptability emerges as a significant issue, since the location where prospections are planned is very close to Gros Morne National Park, a highly visible natural area in the province and a UNESCO World Heritage Site. As far as we know, this is the first academic study dealing with public perception about fracking in NL.
In this province, the public’s influence on political decision-making process seems to be more important than in some other Canadian regions. In New Brunswick, there appeared to be more sup-port for fracking than in British Columbia, and also more supsup-port than opposition to it (O’Connor and Fredericks, 2018). However, a ban was imposed only in the former. There seems to be di↵erent political sensitivities within Canada a↵ecting how public attitudes shape political action.
This research has contributed to define socio-demographic profiles of opposers/supporters of fracking and/or other OG exploitation activities. We find that males between 45 and 54 years old, with relatively high levels of income are more likely to oppose fracking activities only. This is a somewhat surprising finding, since it is women who, in general, tend to show more sensitivity towards environmental issues. On the other hand, individuals looking for a job, those in retirement, and NL government employees show a lesser extent probability to oppose both OG extraction technologies.
Moreover, this study contributes to rapidly expanding empirical literature on this topic in several ways. First, we extend the knowledge about public attitudes towards fracking in the Canadian context. Second, as shale gas developments were considered around one of the most environmentally valuable areas of NL, the study addresses the conflict between economic and environmental motivations and concerns surrounding fracking in a region where the conflict between both is central. Overall, this study suggests that the local context is a key issue for understanding public perceptions about new energy technologies
Finally, we expect that our results might help government officials channel the preferences of the provinces citizens onto policy development towards fracking in the future. At the time of the survey used to obtain the data we analysed, the NL government needed to reinforce its position about OG exploitation using fracking. In the future, the relevant conditions surrounding
this decision-making process might be altered. Our results suggest that, although for now a moratorium has been imposed, partly because the low price of oil does not make it worthwhile to bear the environmental costs and potential risks associated with fracking, future increase in oil prices might result in ambiguous opinion shifts about fracking. Higher oil prices would make fracking more profitable, on the one hand, and preservation of environmental quality more costly. However, since the fortunes of NL are closely tied to the price of oil too, higher prices would increase average incomes and make NL more willing to sacrifice income to preserve the environment. Any change in general incomes that is not linked directly to the profitability of the OG industry would, however, likely knock the balance between the environmental and economic concerns in such a way that the majority could start favoring fracking in the province, even in WNL.
Acknowledgements
The second and third authors gratefully acknowledge the hospitality of the Department of Eco-nomics of Memorial University of Newfoundland during the research during which this research was initiated. The Collaborative Applied Research in Economics initiative at this Department made available the survey data used in the analysis. This research did not receive any specific grant from funding agencies in the public, commercial, or not-for-profit sectors.
Declarations of interest
None
References
Abdalla, C. W. and J. R. Drohan (2010). Water withdrawals for development of Marcellus Shale gas in Pennsylvania: Introduction to Pennsylvania’s water resources. Technical report, Pennsylvania State University Cooperative Extension.
Adgate, J. L., B. D. Goldstein, and L. M. McKenzie (2014). Potential public health hazards, expo-sures and health e↵ects from unconventional natural gas development. Environmental Science & Technology 48 (15), 8307–8320.
Anderson, B. J. and G. L. Theodori (2009). Local leader’s perceptions of energy development in the Barnett shale. Southern Rural Sociology 24 (1), 113–129.
Andersson-Hudson, J., W. Knight, M. Humphrey, and S. O’Hara (2016). Exploring support for shale gas extraction in the United Kingdom. Energy Policy 98, 582 – 589.
Bamberger, M. and R. E. Oswald (2012). Impacts of gas drilling on human and animal health. New Solutions: a Journal of Environmental and Occupational Health Policy 22 (1), 51–77.
Bomberg, E. (2017). Fracking and framing in transatlantic perspective: a comparison of shale politics in the US and European Union. Journal of Transatlantic Studies. 15.(2), 101120. Boudet, H. (2011). From NIMYB to NIABY: Regional mobilization against liquefied natural gas
in the United States. Environmental Politics 20 (6), 786–806.
Boudet, H., D. Bugden, C. Zanocco, and E. Maibach (2016). The e↵ect of industry activities on public support for “fracking”. Environmental Politics 25 (4), 593–612.
Boudet, H., C. Clarke, D. Bugden, E. Maibach, C. Roser-Renouf, and A. Leiserowitz (2014). “Fracking“ controversy and communication: Using national survey data to understand public perceptions of hydraulic fracturing. Energy Policy 65, 57–67.
Brasier, K. J., M. R. Filteau, D. K. McLaughlin, J. Jacquet, R. C. Stedman, T. W. Kelsey, and S. J. Goetz (2011). Residents’ perceptions of community and environmental impacts from development of natural gas in the Marcellus Shale: a comparison of Pennsylvania and New York cases. Journal of Rural Social Sciences 26 (1), 32–61.
Cheng, S. and J. S. Long (2007). Testing for IIA in the multinomial logit model. Sociological Methods & Research 35 (4), 583–600.
Clarke, C. E.and Budgen, D., P. Hart, R. C. Stedman, J. B. Jacquet, D. T. N. Evensen, and H. S. Boudet (2016). How geographic distance and political ideology interact to influence public perception of unconventional oil/natural gas development. Energy Policy 97, 301–309.
Climek, M., L. Brou, M. Means, and K. Goidel (2013). Fracking and polarization of public opinion. Public Policy Research Lab, Louisiana State University. Retrieved from: http://sites01. lsu. edu/wp/pprl/(accessed on 04.06. 14).
Colborn, T., C. Kwiatkowski, K. Schultz, and M. Bachran (2011). Natural gas operations from a public health perspective. Human and ecological risk assessment: An International Jour-nal 17 (5), 1039–1056.
Cotton, M. and I. Charnley-Parry (2018). Beyond opposition and acceptance: Examining public perceptions of the environmental and health impacts of unconventional oil and gas extraction. Current Opinion in Environmental Science & Health 3, 8 – 13.
Davis, C. and J. M. Fisk (2014). Energy abundance or environmental worries? Analyzing public support for fracking in the United States. Review of Policy Research 31 (1), 1–16.
Dokshin, F. (2016). Whose backyard and what’s at issue? Spatial and ideological dynamics of local opposition to fracking in New York State, 2010 to 2013. American Sociological Review 81 (5), 921–948.
Ehrenberg, R. (2012). The facts behind the frack: Scientists weigh in on the hydraulic fracturing debate. Science News 182 (5), 20–25.
Franzen, A. and R. Meyer (2010). Environmental attitudes in cross-national perspective: A mul-tilevel analysis of the ISSP 1993 and 2000. European Sociological Review 26 (2), 219–234. Franzen, A. and D. Vogl (2013). Two decades of measuring environmental attitudes: A comparative
analysis of 33 countries. Global Environmental Change 23 (5), 1001 – 1008.
Graham, J. D., J. A. Rupp, and O. Schenk (2015). Unconventional gas development in the USA: Exploring the risk perception issues. Risk Analysis 35 (10), 1770–1788.
Hausman, J. and D. McFadden (1984). Specification tests for the Multinomial Logit Model. Econo-metrica 52 (5), 1219.
Hayward, B. (2012). Children, Citizenship and Environment Nurturing a Democratic Imagination in a Changing World. London: Routledge.
Holahan, R. and G. Arnold (2013). An institutional theory of hydraulic fracturing policy. Ecological Economics 94, 127 – 134.
Howarth, R. W., R. Santoro, and A. Ingra↵ea (2011). Methane and the greenhouse-gas footprint of natural gas from shale formations. Climatic Change 106 (4), 679–690.
Howell, R. A. (2018). UK public beliefs about fracking and e↵ects of knowledge on beliefs and support: A problem for shale gas policy. Energy Policy 113, 721–730.
IEA (2012). Golden rules for a golden age of gas, world energy outlook, special report on uncon-ventional gas. Technical report, IEA/OECD.
Israel, A. L., G. Wong-Parodi, T. Webler, and P. C. Stern (2015). Eliciting public concerns about an emerging energy technology: The case of unconventional shale gas development in the United States. Energy Research & Social Science 8, 139–150.
Jacquet, J. (2014). Review of risks to communities from shale energy development. Environmental Science & Technology 48 (15), 8321–8333.
Jacquet, J. and R. Stedman (2011). Natural gas landowner coalitions in New York State: Emerging benefits of collective natural resource management. Journal of Rural Social Sciences 26 (1), 62– 91.
Jacquet, J. B. (2012). Landowner attitudes toward natural gas and wind farm development in northern pennsylvania. Energy Policy 50, 677 – 688. Special Section: Past and Prospective Energy Transitions - Insights from History.
Jacquet, J. B. and R. C. Stedman (2013). Perceived impacts from wind farm and natural gas development in northern Pennsylvania. Rural Sociology 78 (4), 450–472.
Jenner, S. and A. J. Lamadrid (2013). Shale gas vs. coal: Policy implications from environmental impact comparisons of shale gas, conventional gas, and coal on air, water, and land in the United States. Energy Policy 53, 442 – 453.
Kirker, K. A. and R. Burger (2011). Just the fracking facts. University of Pittsburgh Swanson School of Engineering. Eleventh Annual Freshman Conference. April 9. available at http://region8water.colostate.edu/PDFs/1267.pdf.
Kriesky, J., B. Goldstein, K. Zell, and S. Beach (2013). Di↵ering opinions about natural gas drilling in two adjacent counties with di↵erent levels of drilling activity. Energy Policy 58, 228 – 236. Kromer, M. (2015). Public perceptions of hydraulic fracturing in three Marcellus Shale states.
Issues in Environmental Policy 20, 1–12.
Lachapelle, E., S. Kiss, and E. Montpetit (2018). Public perceptions of hydraulic fracturing (frack-ing) in Canada: Economic nationalism, issue familiarity, and cultural bias. The Extractive Industries and Society.
Ladd, A. (2014). Environmental disputes and opportunity-threat impacts surrounding natural gas fracking in Lousiana. Social Currents 1 (3), 293–311.
Mart´ınez-Espi˜neira, R. (2016). Econometric analysis of the Public Opinion Survey. A Report Submitted to CARE and the Independent Panel Tasked with Reviewing the Socio-Economic and Environmental Implications of Hydraulic Fracturing in Western NL. Appendix P of Panels Final Report, January 2016. Available at: http://nlhfrp.ca/final-report/.
McFadden, D. (1974). The measurement of urban travel demand. Journal of Public Eco-nomics 3 (4), 303–328.
NAS (2012). Induced seismicity potential in energy technologies. Technical report, National Academy of Sciences.
O’Brien, N. L. and K. W. Hipel (2016). A strategic analysis of the New Brunswick, Canada fracking controversy. Energy Economics 55, 69 – 78.
O’Connor, C. and K. Fredericks (2018). Citizen perceptions of fracking: The risks and opportunities of natural gas development in canada. Energy Research & Social Science 42, 61 – 69.
Olive, A. (2016). What is the fracking story in Canada? The Canadian Geographer / Le G´eographe canadien 60 (1), 32–45.
Olson-Hazboun, S. K., P. D. Howeb, and A. Leiserowitzc (2018). The influence of extractive activities on public support for renewable energy policy. Energy Policy 123 (1), 117–126. Osborn, S., A. Vengosh, N. Warner, and R. Jackson (2011). Methane contamination of drinking
water accompanying gas-well drilling and hydraulic fracturing. Proceedings of the National Academy of Sciences of the United States of America 108 (20), 8172–8176.
Pierce, J. J., H. Boudetb, C. Zanoccob, and M. Hillyarda (2018). Analyzing the factors that influence U.S. public support for exporting natural gas. Energy Policy 120, 666–674.
Stedman, R. C., D. Evensen, S. O’Hara, and M. Humphrey (2016). Comparing the relationship between knowledge and support for hydraulic fracturing between residents of the United States and the United Kingdom. Energy Research & Social Science 20, 142 – 148.
Theodori, G. L. (2009). Paradoxical perceptions of problems associated with unconventional nat-ural gas development. Southern Rnat-ural Sociology 24 (3), 97–117.
Thomas, M., N. Pidgeon, D. Evensen, T. Partridge, A. Hasell, C. Enders, B. H. Harthorn, and B. M. (2017). Public perceptions of hydraulic fracturing for shale gas and oil in the United States and Canada. WIREs Clim Change 8 (null).
Thomson, I. and R. G. Boutilier (2011). Social license to operate. In P. Darling (Ed.), SME Mining Engineering Handbook, pp. 1779–1796. Littleton, CO: Society for Mining, Metallurgy and Exploration.
Vidic, R. D., S. L. Brantley, J. M. Vandenbossche, D. Yoxtheimer, and J. D. Abad (2013). Impact of shale gas development on regional water quality. Science 340 (6134).
Whitmarsh, L., N. Nash, P. Upham, A. Lloyd, J. Verdon, and J.-M. Kendall (2015). UK public perceptions of shale gas hydraulic fracturing: The role of audience, message and contextual factors on risk perceptions and policy support. Applied Energy 160, 419–430.
Whitton, J., K. Brasier, I. Charnley-Parry, and M. Cotton (2017). Shale gas governance in the United Kingdom and the United States: Opportunities for public participation and the impli-cations for social justice. Energy Research & Social Science 26, 11 – 22.
Whitworth, K. W. D. L. E., T. Mackay, A. Hernandez, M. K. Martin, J. Lopez, M. Small, P. Win-kler, and M. Valerio (2017). Exploring perceptions of fracking and environmental health in a 3-county population in South Texas. Journal of Epidemiology Research 3 (1), 61–68.
Willits, F. K., A. E. Lulo↵, and G. L. Theodori (2013). Changes in residents; views of natural gas drilling in the Pennsylvania Marcellus Shale 2009-2012. Journal of Rural Social Sciences 28 (3), 60–75.
Wolske, K., A. Ho↵man, and L. Strickland (2013). Hydraulic fracturing in the state of Michigan. Public perceptions of high-volume hydraulic fracturing & deep shale gas development. Graham Sustainability Institute Integrated Report Series.
Xiao, C. and R. E. Dunlap (2007). Validating a comprehensive model of environmental concern cross-nationally: A U.S.-Canadian comparison. Social Science Quarterly 88 (2), 471–493. Zhou, M. (2015). Public environmental skepticism: across national and multilevel analysis.
Appendix A
Predicted probabilities for St. John’s
Note: ‘old’ denotes age 55 takes value one, young denotes age 35 takes value one; ‘educated’ denotes University takes value one.
.
Favors both Opposes fracking Opposes both Neutral young educated male 0.10+ 0.25⇤⇤ 0.08 0.57⇤⇤
old educated male 0.06 0.28⇤⇤ 0.27+ 0.39⇤⇤
young non-educated male 0.12 0.20⇤ 0.04 0.64⇤⇤
old non-educated male 0.08 0.25⇤ 0.15 0.52⇤⇤
young educated female 0.05+ 0.29⇤⇤ 0.14 0.52⇤⇤
old educated female 0.03 0.27⇤⇤ 0.40⇤ 0.31⇤
young non-educated female 0.07 0.09 0.02 0.83⇤⇤ old non-educated female 0.05 0.12+ 0.07 0.76⇤⇤
+p < 0.10,⇤p < 0.05,⇤⇤p < 0.01
Table A1: Predicted probabilities for St. John’s respondents: income between $50,000 and $74,999.
.
Favors both Opposes fracking Opposes both Neutral young educated male 0.09 0.24⇤⇤ 0.15 0.52⇤⇤
old educated male 0.05 0.22⇤ 0.42⇤ 0.31⇤ young non-educated male 0.12 0.19⇤ 0.07 0.61⇤⇤
old non-educated male 0.08 0.22⇤ 0.25 0.45⇤⇤
young educated female 0.05 0.26⇤⇤ 0.24+ 0.45⇤⇤
old educated female 0.02 0.20⇤ 0.56⇤⇤ 0.22+
young non-educated female 0.07 0.09+ 0.03 0.81⇤⇤
old non-educated female 0.05 0.12+ 0.12 0.71⇤⇤
+p < 0.10,⇤p < 0.05,⇤⇤p < 0.01
.
Favors both Opposes fracking Opposes both Neutral young educated male 0.20⇤ 0.22⇤⇤ 0.03 0.55⇤⇤
old educated male 0.14+ 0.28⇤⇤ 0.13 0.45⇤⇤
young non-educated male 0.23+ 0.16+ 0.02 0.59⇤⇤
old non-educated male 0.18 0.23⇤ 0.06 0.53⇤⇤ young educated female 0.11⇤ 0.27⇤⇤ 0.06 0.55⇤⇤
old educated female 0.07 0.31⇤⇤ 0.22+ 0.40⇤⇤
young non-educated female 0.13 0.07+ 0.01 0.79⇤⇤
old non-educated female 0.11 0.11+ 0.03 0.75⇤⇤
+p < 0.10,⇤p < 0.05,⇤⇤p < 0.01
Table A3: Predicted probabilities for St. John’s respondents: income of $100,000 or more.
Appendix B
Predicted probabilities for WNL
.
Favors both Opposes fracking Opposes both Neutral young educated male 0.11 0.22⇤ 0.04 0.63⇤⇤
old educated male 0.08 0.28⇤⇤ 0.14 0.50⇤⇤ young non-educated male 0.13 0.16+ 0.02 0.69⇤⇤
old non-educated male 0.10 0.23⇤ 0.07 0.60⇤⇤ young educated female 0.06 0.26⇤⇤ 0.07 0.61⇤⇤
old educated female 0.04 0.29⇤⇤ 0.23 0.44⇤⇤
young non-educated female 0.07 0.07 0.01 0.85⇤⇤
old non-educated female 0.06 0.10+ 0.03 0.81⇤⇤
+p < 0.10,⇤p < 0.05,⇤⇤p < 0.01