HAL Id: hal-01849601
https://hal.archives-ouvertes.fr/hal-01849601v2
Preprint submitted on 24 Jul 2019
HAL is a multi-disciplinary open access
archive for the deposit and dissemination of
sci-entific research documents, whether they are
pub-lished or not. The documents may come from
teaching and research institutions in France or
abroad, or from public or private research centers.
L’archive ouverte pluridisciplinaire HAL, est
destinée au dépôt et à la diffusion de documents
scientifiques de niveau recherche, publiés ou non,
émanant des établissements d’enseignement et de
recherche français ou étrangers, des laboratoires
publics ou privés.
Communities in directed graphs: Finding directed
community structures using triads
Félicité Gamgne Domgue, Tsopze Norbert, René Ndoundam
To cite this version:
Félicité Gamgne Domgue, Tsopze Norbert, René Ndoundam. Communities in directed graphs: Finding
directed community structures using triads. 2019. �hal-01849601v2�
Rubrique
Communities in directed graphs
Finding directed community structures using triads
Gamgne Domgue Félicité, Tsopze Norbert, René Ndoundam
IRD UMI 209 UMMISCO, Université de Yaoundé I Yaoundé,Cameroun
felice.gamgne@gmail.com, felicite.gamgne@uy1.uninet.cm tsopze@uy1.uninet.cm
ndoundam@gmail.com
ABSTRACT. Community detection in directed networks appears as one of the most relevant topics in
the field of network analysis. One common theme in some formalizations is that flows should tend to stay within communities and could be centered round core nodes called "kernels". Hence, we expect triads to play an important role in the detection of that kind of community. Triads for directed graph are directed sub-graphs of3nodes involving at least2links between them. To identify communities
in directed networks, this paper proposes an undirected edge-weighting scheme based on directed triads. We also propose a new metric on quality of the communities that is based on the triad density of communities. To validate our approach, an experiment was conducted on some networks which show that it has better performance on triad-based density over some state-of-the-art methods.
RÉSUMÉ. La détection des communautés dans les graphes orientés constitue un domaine crucial
de l’analyse des réseaux. Dans une communauté, les noeuds sont plus densément connectés entre eux, et peuvent être centrés autour d’autres noeuds “coeurs”appelés "Kernels". Nous estimons que les triades orientés sont d’un rôle capital dans la détection des communautés engendrées par un ensemble de noeuds. Une triade dans un graphe orienté est un sous-graphe de3noeuds impliqués
dans au moins2liens. Afin d’extraire les communautés, nous proposons une méthode de transfor-mation du graphe orienté en non orienté et valué, en se basant sur les triades orientées. Et nous proposons une nouvelle mesure de qualité basée sur la densité en triades dans les communautés. La validation de cette approche par des expérimentations sur des réseaux montre qu’elle découvre des communautés plus significatives, de densité en triades plus importantes que d’autres méthodes de l’état de l’art.
KEYWORDS : Networks Analysis, Directed graphs, Kernel, Community detection, Triad
1. Introduction
A recurrent research theme in Network analysis is community detection. In directed networks, it appears as one of dominant research works, because of the direction of links that should be preserved. For instance, clusters in the directed hyperlink structure of the Web correspond to sets of web pages that share some common topics. Similarly, commu-nities in a social network with non-symmetric links (e.g., twitter) correspond to individu-als with common interests or friendship relationships. Fortunato [2] extends communities definition to be considered as separate entities with their own autonomy. Community assignment methods for directed graphs [8] focus either on link structure or semantic properties to detect communities. The connectivity between nodes is often used alone to define metrics measuring the “quality ”of the assigned groups. Common metrics measure either the density of links within a group through modularity or the density of triangles through Weighted Community Clustering (WCC). These techniques implemented for di-rected networks sometimes ignore link directionality during their clustering process [8]. In order to improve the segmentation quality, the generic weighting model that converts a directed graph into an undirected weighted graph and takes into account both density and semantic features, has been proposed in this work. This paper extends [31], in which we introduce the notion of Kernel Degree as a combination of Neighborhood Overlap (NO) and Triad Weight (TW). Our specific weighting scheme is based on extending the idea that, within “good”communities, information can be centralized by kernels and attain-able in a community more easily than between communities. Therefore, our approach, considering semantic sight, is able to express the idea of detecting groups of nodes with homogeneous in-link structure (e.g., citation-based clusters) through triads, and give the possibility to kernel nodes to own more common neighbors. The main question to assess the performance of the proposed algorithm may arise such as: How can we profitably use triads to quantitatively discover communities in a directed networks ? What advantages does the development of a community discovery method based on kernel have over other methods?
The specific contributions of our paper are:
– We propose a pattern-based clustering scheme that points up triadic closure of struc-tures.
– We introduce a new concept called Kernel Degree using information about directed triads to improve community detection in directed networks.
The paper is organized as follows. Section 2, structured in two paragraphs, presents in the first one a brief list of applications related to directed network clustering and in the second one a detailed description of triad concept such as addressed by other methods with limits of their contributions, then, an introduction to related works on kernels community detec-tion is exhibited. In Secdetec-tion 3, we formally introduce and define several concepts used into the proposed clustering method; therefore, a description of the proposed technique is detailed in three steps: preprocessing, extraction kernel and migration. To validate our ap-proach and the choice of any concept pointed up into section 3, Section 4 is an experiment study through some metrics (d-modularity and triad density) that shows the performance of our method, over some other state-on-the-art methods. Section 5 concludes this work.
2. Related works
2.1. Community detection in directed networks
Finding clusters in directed networks is a challenging task with several important ap-plications in a wide range of domains. Many methods and algorithms have been proposed by the wider research community to deal with the clustering in directed networks. Some of them include extensions of approaches that have been previously applied in undirected networks while others propose new ways as to how edge directionality can be utilized in the clustering task. The formers [13,18] convert a directed graph into bipartite, undirected and weighted one, this enabling to utilize the richness and complexity of existing methods to find communities in undirected graphs. Some hierarchical methods [1, 9] based on the optimization of the so-called modularity measure [10] focus on the idea that networks with inherent community structure usually deviate from random graphs. Considering a specific partition of the network into clusters, modularity measures the number of edges that lie within a cluster compared to the expected number of edges of a null graph (or configuration model), i.e., a random graph with the same degree distribution [8]. The modularity measure in the case of directed networks has been many times extended and demonstrated in [10] to be expressed as:
Qd= 1 2mΣij(Aij − kout i kjin 2m )δ(ci, cj) (1)
Yet, Fortunato [2] describes how this measure has a limit resolution, the difficulty for the measure to extract small scale communities. To make up for this limit, Gautier and Lancichinetti [6, 7] proposed to inform some parameters about either the number of com-munities or whether the method should extract small comcom-munities or not. These parame-ters can greatly affect the accuracy of an approach if the values provided by the user are incorrect. Moreover results could not be satisfactory in triad-based clustering from real-world networks, if the user parametrizes community size to 2 vertices. Malliaros et al. [8] describe some quality measures in detail and also present their extensions to directed net-works (e.g.Qd). They confirm that these techniques ignore important information about
link direction and miss their semantic. In order to enhance one of the fundamental prop-erties of real networks, namely homophily, which is the tendency of neighboring nodes to share the same centre of interest, some authors have focused on the triads.
2.2. Triad-based methods
Triads, initially studied by authors Wasserman and Faust in [16] in social network analysis was introduced by Serrour B. et al. [19] to identify communities of different types. Triads are considered as wedges, i.e paths of length2 by [5]. Thus, a triad can be
integrated into a triangle. In [11], the authors define a “good”community to be a group of nodes that is dense in terms of triangles through Weighted Community Clustering (WCC) measure. In directed graphs, the process of extracting semantic structures should take into account either “in”or “out”directionality of links for meaningful interpretation. Therefore, it becomes interesting to specify those of nodes centred around kernels (set of influential nodes inside a group) according to one direction. Then, kernel community detection methods are considered as seed-centric approaches [4] because of the influence of nodes centralizing information. Using triads enlarges the possibility to consider low degree nodes instead of high degree nodes called “hub nodes”. That way, low degree nodes will not yet be isolated or sparse at the end of the community detection process.
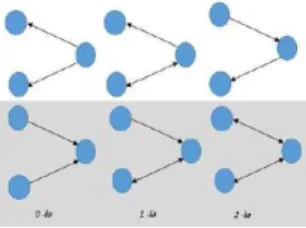
Figure 1: Basic structures of our kernel community model, opened triads. In the same way, Tsourakakis in [14] initiated the study of degree labelled triangle. He argues that low degree vertices form fewer triangles than higher degree vertices. At this stage, to make up this limit, the objective of this new approach is to cluster low degree nodes so that they should be more linked together around a kernel and could access more easily to central retained information. So it takes into account in-links to the kernel and vertices with low degree.
Some methods, like Wang’s approach [15] explored the problem of detecting com-munity kernels, in order to either exhibit different influence and different behaviour of vertices inside a structure for easily interpreting results, then uncovering the hidden com-munity structure in large social networks. However, he does not consider topological criteria in their method. To make up for this limit, the proposed approach integrates topo-logical structure based on triads and conducts to semantic community structures.
Unlike the modularity, the new Triad Density measure implemented in this work (see Definition 3) exhibits triad-based structure of the resulting partition. And we focus on kernels because they represent community core and lead to meaningful structures. In this paper, a triad is a set of3 vertices linked through at least 2 edges. In undirected networks,
there is only two types of triad, a path of length2 and a triangle. In directed networks,
there are many types as shown in Figure 1. This work focuses on in-seed-centric [4] approach because of the influence of nodes centralizing information, a good pattern close relationship and ability to concentrate information between nodes. This is not the case for all types of directed triads. As an example, in a blog readership network, there are two types of "bloggers": "writers" who generate influential blogs read by many others, and "readers" who read a lot but seldom write anything for others to read.
3. Community detection method
This method makes use of centric-based approaches through extracting subgraphs in-duced by co-parent structures, called Kernel. Seed-Centric approaches for Community Detection in Complex NetworksG = (V, E) generally follows these principal steps [4].
– Seed computation;
– Seed local community computation;
– Community computation out from the set of local communities computed in step 2. The algorithm for finding structures we propose here makes use of an introduced cen-trality measure Kernel Degree based on triads cardinality, as described in the following section.
This method is structured in three steps: (i)Preprocessing step, (ii)Kernel extraction,
Figure 2: General architecture of the proposed approach.
some basic concepts in Section 3.1. An overview of its general architecture is presented in Figure 2.
(a) Extract for Twitter social net-work [15].
(b) Example of triads in which there is an edge between kernel vertices
viandvj
(c) Example of a citation pattern
Figure 3: Examples of structures expressing triads
In this method, we consider a Community as a set of vertices centred round kernel, and accessing easily to the central information retained by that kernel. Otherwise, a com-munity seems to be a subgraph yielded by kernel. Like this, we consider the number of communities as one of the metrics of quality partition evaluation in experiments.
3.1. Basic terminology and concepts
Considering a given directed graphG = (V, E) with n = |V | the number of vertices
andm = |E| the number of edges. An edge eij connects vertexvi with vertexvj. We
Definition 1. . (The Kernel Degree). Let the kernelK be a set of central vertices. The
Kernel degree of a pair of verticesviandvjis:
Kij= |∆|∆ij| j| ∗ |Γin j ∩Γ in i | |Γin j ∪Γini |−θ WhereΓin
i stands for the in-Neighbourhood set for a vertexvi. We use∆ij to
repre-sent a set of triad involving bothviandvj according to the scheme presented in Figure
3b, and∆j to represent a set of triad in whichvj is involved. vj is the target vertex of
links.
The first term is based on triads, and promotes the Triad Weight through a kernel; Given two verticesvi andvj, a standard way to compute the percentage of triads they
form together is to compute the ratio between the total number of triads in which the pair of vertices is included (numerator) and the total number of triads in which vertexvi is
contained (denominator).
And the second term promotes the Neighbourhood Overlap ofvi andvj vertices. It
concerns a Jaccard Index variant [32], which consists in measuring neighbourhood sim-ilarity of two vertices so that they could belong to the same kernel. Unlike the Jaccard Index which does not consider the connectivity between the nodes because it just com-putes the common neighbours of 2 verticesvi andvj, Neighbouhood overlap integrates
the fact that there could be or not an edge betweenviandvj. The numerator of the ratio is
computed by intersecting their adjacency in-neighbour lists in order to count the number of their common neighbours. That is why we use theθ parameter in the denominator for
comparison of2 similar kinds of neighbor sets. In fact, in the numerator, one vertex can
belong to the in-neighbourhood of another, and vice versa.θ can take different values 0, 1 and 2, depending on the connectivity of vi andvj vertices. Intuitively, Kernel degree
measures the strength or weight of the kernel vertex similarity. –θ = 0 if (vi, vj) /∈ E and (vj, vi) /∈ E
–θ = 1 if (vi, vj) ∈ E and (vj, vi) /∈ E
–θ = 2 if (vi, vj) ∈ E and (vj, vi) ∈ E
Definition 2. (Kernel). Kernel is a set of vertices with the same neighbourhood, such as
these neighbours expand inward the kernel, according to the Kernel DegreeKijgradually
until a threshold.
The Kernel is formally defined as -K = {v1, ..., vi, ..., v|K|}, vi∈ V
-∀vi, vj∈ K , Γiin≃ Γjin,
-∀i 6= j\vi, vj ∈ K, Kij > σ.
The threshold valueσ is expressed in the section 3.3 below.
Definition 3. . (Triad Density) The Triad Density of a partition is a ratio that conceals
difference between real number of triads in that partition and maximal possible number of triads in the whole graph.
T riadDens = Σ
n i|∆Ci|
(3 |V |)
Where the numerator expresses the number of triads from the overall communities, and the denominator denotes that combination value equals to (|V |−3)!3!|V |! , with |∆Ci|
being the number of triads in the communityCi andn, the number of communities.
T riadDens = 0 if vertices are isolated or if |V | < 3. Otherwise, T riadDens = 1 if the
graph is complete, i.e there is bidirectional edge between every pair of vertices.
3.2. Preprocessing
It consists in transforming the directed graph into an undirected and weighted graph. It spreads out into two subtasks: Computing a pruned central list of vertex degree, and computing kernel matrix corresponding to the undirected and weighted graph.
3.2.1. In-degree central list computing
This step consists in determining a set, which is a list of vertex in-degree centralities, and put it in decreasing order; that list is called Centralities List(CL). So that those
with maximal in-degree are more eligible than those with a fair in-degree. Then, pruning from the listin–pendant and in–isolated vertices i.e. those of nodes with an in –degree
below thein–degree graph average, as inspired by Steven L. and al. [30] who defined
apendant as vertex with a single neighbour which has degree 1. This filtering step
improves performance and allows simplifying assumptions later when deciding whether to include a vertex into a kernel. For instance, in a citation network, anin–pendant or in–isolated vertex corresponds to an author whose the area search does not interest other
researchers, so removing these nodes with an in-degree below2 improves the processing
speed and produces more semantic results later.
For illustration, we will use an extract for Twitter social network [15], as shown in Figure 3a. Its contains14 nodes and 32 edges. The number of communities is visibly 2. The CL
contents is: CL = [′AlGore′, ′BarackObama′, ′AshtonKutcher′,′DemiM oore′,
′OprahW inf rey′] because they have an in-degree above 2.
3.2.2. Kernel Matrix computing
This step consists firstly in computing kernel degree values for every pair(vi, vj) ∈
CL (See def.1 above). Figure 3b clearly presents vertices vi andvjinvolved in a closed
triad. Secondly, it consists in constructing a Kernel Degree square matrixK of Kijwithn
lines andn columns, where n = |CL| is the CL pruned list size, i.e deprived of nodes with
in-degree below thein–degreeaverage. The matrix K = (Kij). Network on Figure 3a
shows values ofK as:
K = 0 1.6 0.057 0.0635 0.267 1.6 0 0.0143 0.0158 0.32 0.057 0.0143 0 0.595 0.012 0.0635 0.0158 0.595 0 0.013 0.267 0.32 0.012 0.013 0 .
The computed matrix is represented through a structure called Kernel Dictionary
(KDict), that would be used in the kernel extracting approach as defined in the next
section. The size of KDict is (n∗n)−n2 . The parametern is removed because the Kii
di-agonal values are null and the valuation is divided by2 because of the symmetric matrix
(Kij = Kji). KDict is in decreasing order of Kijand its computation materializes the
end of the preprocessing. Formally,KDict = [((vi, vj), Kij)]. The kernel dictionary
formed from network in Figure 3a is the list of sorted items from triangular matrixK. KDict = [((‘DemiMoore’, ‘OprahWinfrey ’), 1.6), ((‘AlGore ’, ‘BarackObama ’), 0.595
), ((‘AshtonKutcher ’, ‘OprahWinfrey ’),0.32 ), ((‘AshtonKutcher ’, ‘DemiMoore ’),0.267),
((‘Barack-Obama ’, ‘OprahWinfrey ’),0.0158 ), ((‘AlGore ’, ‘OprahWinfrey ’), 0.0143 ),
((‘Barack-Obama ’, ‘AshtonKutcher ’),0.013 ), ((‘AlGore ’, ‘AshtonKutcher ’), 0.012 )].
3.3. Kernel extracting approach
Let us remember that a kernel in this paper is a set of nodes owning a common central in-degree overlapping neighbourhood. This task of extracting kernels focuses first on determining those of nodes more eligible to belong to kernel via interclass inertia, and thereafter, on constructing kernels via a threshold computation.
3.3.1. Interclass inertia computation
Given that the clustering main goal is to form homogeneous groups together, the mea-sure used here is Inter-class Inertia, and the list of the inter-class inertia values is named
I. This list is based on KDict vector. In fact, high inter-class inertia values indicate that
objects tend to be more dissimilar, and consequently should belong to distinct groups. So, it divides objects into two groups, those eligible to belong to a kernel and those not eli-gible. The delimitation of two groups is done by a comparison of values from Inter-class Inertia List with a computed Standard Deviationσ on I. This way, vertex pairs (i, j)
whose Inter-class Inertia value is larger thanσ are more eligible to belong to kernels. The
Inter-class Inertia between2 sub-groups G1andG2is expressed as
I(G1, G2) = |G1|(µ1− µ)2+ |G2|(µ2− µ)2 (2)
|G1| and |G2| are respectively the number of edges in groups G1 andG2. µ1, µ2,
andµ are respectively the Kernel Degree average for G1,G2 and G. Figure 3a
Net-work presents distinct groupsG1 andG2 respectively as the following, and the
corre-sponding Inter-class Inertia of KDict as : forG1 = {(DemiMoore, OprahWinfrey)} and
G2= {(AlGore, BarackObama), (AshtonKutcher, OprahWinfrey), (AshtonKutcher,
Demi-Moore), (BarackObama, DemiDemi-Moore), (AlGore, DemiDemi-Moore), (BarackObama, Oprah), (AlGore, OprahWinfrey), (BarackObama, AshtonKutcher), (AlGore, AshtonKutcher)}, the Inter-class Inertia for these groups is1.987. Then, the following pair of nodes in KDict
list moves fromG2 to G1, and their contents become: G1 = {(DemiMoore,
Oprah-Winfrey), (AlGore, BarackObama)} andG2 = {(AshtonKutcher, OprahWinfrey),
(Ash-tonKutcher, DemiMoore), (BarackObama, DemiMoore), (AlGore, DemiMoore), (Barack-Obama, Oprah), (AlGore, OprahWinfrey), (Barack(Barack-Obama, AshtonKutcher), (AlGore, Ash-tonKutcher)}, and the Inter-class Inertia for these groups is1.705. We change the G1and
G2contents and so on; this leading to the Inter-class Inertia listI = [ 1.987, 1.705, 1.359,
1.162, 0.844, 0.627, 0.439, 0.297, 0.186, 0.131]. This step concludes by computing a
threshold helpful for kernel extraction process, as detailed in the next section.
3.3.2. Kernel extraction
To compute Kernels, we focus on a threshold, which is the standard deviation from interclass inertia list. So, each vertex must decide if it could belong to the key membership (the kernel initiator vertex belonging to the pair with the highest corresponding Inter-class Inertia). Inspired by properties of real-life networks [3] based on a power-law degree distribution, the basic idea behind the metric is that within a community, vertices should have a high concentration of triads among themselves, than with vertices outside of the community.
To select kernel nodes through this second phase, some metric inherent to vertex cen-trality have been studied: Common neighbours [28], Distance (Cosinus, Euclidian...), Jaccard Index [29], geodesic (short path) [9], Clustering Coefficient [27]. The retained
metrics in this paper combined through Kernel Degree to strengthen the similarity of ker-nel vertices are: the "common neighbours" corresponding to triads in which many nodes are involve and the "Jaccard Index" variant (which are Triad Weight, and the Neighbour-hood Overlap, the left term and right term respectively of the Kernel Degree formula in Definition 1). Their combination leads to scalable results. Because our empiric tests on metric taken separately show the superiority of Kernel Degree on various networks, as evaluated in section 4.2. Besides, at the bottom of Section 3.3.3, it is demonstrated that the proposed metric is a function of clustering coefficient and interpretations are described.
The phase begins by initiating kernels with distinct pair of vertices possessing highest corresponding Inter-class Inertia, through the mileage of the KDict list. Given that an initiating kernel vertexr of a kernel t between the initiating pair of vertices {r, u}. If a
vertexp in KDict is coupled to another one q with whom the Kernel Degree Kpqis lower
than its Kernel DegreeKpr with the initiating kernel vertexr, it immediately migrates
to that kernelt. So the kernel t will be made of {r, u, p}. Then those already belonging
to the kernel will not be treated in the future steps. The vertices belonging to the kernel own the almost same neighbours. The approach proposed here makes use of a new con-cept Kernel DegreeKij as defined in Definition 1, that measures the strength of a kernel
gradually from a threshold. This concept is based on the triadic membership for emphasis the semantic proximity that links kernel members conducting to efficient centralization of information over the network. We focus on triads cardinality that is the number of neigh-bours two nodes own. Instead of optimizing the partition quality of the whole graph, we focus on Kernel computation that is based on Kernel Degree maximization, a local mean to judge a kernel partition quality.
We require that the kernel fulfils the following properties:
1) Every kernel contains distinct pair of vertices with inter-class inertia upper than a threshold.
2) The kernel vertices have higher Kernel Degree values, proportionally to the de-gree distribution of the graph.
3) Given an initiating pair(i, j) and a border vertex k in a kernel, the
neighbour-hood overlap cardinality of(i, j) must be higher than the neighbourhood overlap
cardi-nality of any neighbourt of (i, j, k). Formally, Given ∀(i, j)\i, j ∈ CL, and k ∈ K, | Γi,j∩ Γk |≥| Γi,j∩ Γt|, where Γi,j= Γi∩ Γj.
3.3.3. Standard deviationσ.
Unlike the well-known meaning of the standard deviation, we could make the analysis that the higher the standard deviationσ computed from a set nodes, the more likely they
possess the almost common neighbourhood. As a matter of fact, as illustrated in Figure 6, a lower standard deviation indicates that these vertices have a quasi-null common-neighbourhood cardinality. Because of the power-law degree distribution in real-life net-works, very little nodes get a high in-degree widely above the in-degree average. We make the assumption that according to [26], there tend to be a few “hub”vertices with a very high degree and great number of vertices with a much lower degree. In the case of directed graphs, the concept of hub vertices depend on the in-degree or the out-degree value. This paper stresses on in-degree vertices, meaning that they receive more informa-tion from the other vertices than “non-hub”vertices. The standard deviainforma-tion is expressed as
σ =r 1 nΣ
n
whereµ = 1 nΣ
n
i=1xi indicatessi average (or mean), andxi indicates every element of
the interclass inertia array. A kernel is initially structured by a pair of vertices, and ex-pands progressively. During this phase, vertices which are in the neighbourhood of kernel members with a Kernel Degree value aboveσ, are associated to the kernel. This leading
to an expansion of the starting kernel. Their impact to the remaining of the entire graph is null, because they would not belong to others communities. We make use of a denoted Key-vertex which is the first vertex in each pair ofKDict. In fact, each eligible key-vertex
is integrated into a new kernel, after consulting its non-existence anywhere in the list of kernel vertices. This merging step improves performance and allows simplifying assump-tions later when deciding whether to choose the favourite kernel by a non-kernel vertex (the kernel not belonging to a kernel).
The first kernel from Figure 3a network will be extended by ‘Ashton Kutcher’because it is in the neighbourhood of the other nodes with corresponding inertia of1.359, 1.162
respectively above the thresholdσ. Now the first kernel becomes compounded of ‘Demi
Moore’, ‘Oprah Winfrey’and ‘ Ashton Kutcher’while the second kernel remains the same.
Relationship between the clustering coefficient and Kernel Degree. Clustering
co-efficient studied by Latapy M. [27] is a measure of the degree to which nodes in graph tend to cluster together. Two versions of this measure exist: the global and the local. The Kernel Degree metric focus on the second one. Thus, the local clustering coefficient for directed graphs is given as
Ci=
|{ejk: vj, vk ∈ Γini , ejk∈ E}|
ki(ki− 1)
(4) Wherekiis the number of neighbours of a vertexvi. Let| Γini |, the numerator of the
fraction in Equation 5, be the number of links between the vertices (pointing tovi) within
the neighbourhood ofvi. Let|∆i| the denominator of the fraction be the number of triads
involvingvi(the number of subgraphs with2 edges and 3 vertices, one of which is viand
such that the other points tovi). Then we can also define the clustering coefficient as
Ci =
|Γin i |
|∆i|
(5) This equation is a rewrite of the previous one.
Then we can deduce|∆j| = |Γin
j |
Ci . From the Kernel Degree definition shown in the
definition 1, we have the following equivalence:|∆ij| = |Γinj ∩ Γini |. According to the
equation 5, we deduce that|∆1
j|=
Cj
|Γin j |
.
Thus, replace every term in the formula of the Kernel Degree to obtain the following equation: Kij= Cj( 1 |Γin j | ∗ |Γ in j ∩ Γ in i |2 |Γin j ∪ Γini | − θ ) (6)
This function indicates that the Kernel Degree tightly depends on clustering coefficient of a central vertexvj, this, being the central vertex of the eligible vertices list. Thus, it
favours the optimal value of Kernel Degree, otherwise it improves the degree of clustering nodes into the kernel. This formula clearly illustrates the neighbour-based similarity of nodes of a kernel.
The implementation for kernel communities is presented in Algorithm 1, which ex-tracts a list of kernels namedListK, from the overall nodes of the graph. .
Algorithm 1 Kernels extraction
Require: Directed graphG = (V, E)
Require: KDict vector of vertex pairs associated to their kernel degree
Require: I inter-class inertia vector //corresponding to the vector I in the explanation //above.
Ensure: Structured-by-key Kernels set calledListK
1: Initialisation :Sk= σ , ListK = ∅;
2: for each itemu ∈ I do
3: (p, q) ←− pair of vertices corresponding to the item u in KDict //p = (vi, vj) //and q =
Kijin accordance with description of KDict in Section 3.2.2
4: Key ←− {}
5: ifu >= Sk then
6: for each distinct elementpj∈ p do
7: ifpj∈ Key then/
8: Key ←− {pj}
9: Remove eachKey vertex
10: else
11: for each itemi ∈ p do
12: ifi ∈ p class Such as Ipq>= Skthen
13: Key ←− Key ∪ {i}
14: end if
15: end for
16: end if
17: ListK ←− ListK ∪ {Key}
18: end for
19: end if
20: end for
21: Return ListK
Let us illustrate this idea through an example. Consider the network in Figure 3a. The standard deviation value for that network isσ = 0.62. It is the threshold on which
kernels are to be built. The model computes the first kernelK1initialized by nodes ‘Demi
Moore’and ‘Oprah Winfrey’for which the associated inertia inI is 1.987 ≥ 0.62;
there-after, the vertex ‘Ashton Kutcher’integratesK1, inducing like this a kernel of 3 vertices;
the second kernelK2 is initialized by ‘Al Gore ’and ‘Barack Obama ’for which the
as-sociated inertia inI is 1.705 ≥ 0.62. The process is repeated on the other i values in I for which I[i] ≥ σ; and if the corresponding KDict[i] pair nodes are already keys or
associated values of keys, they are just omitted.
3.4. Community computing process
After extracting kernels, the other nodes not into the kernels, called non-kernels ver-tices, remain. The process of generating global communities (communities containing both kernels and non-kernels vertices) consists in migrating non-kernels vertices to the kernel with whom they have a maximal number of links, as defined in the Formula(7).
It is an iterative optimization process of the number of connection each non-kernel vertex owns with the kernel.
Node Community Index (NCI). This measure we defined corresponds to an extent
membership function. It consists in determining the membership of a vertex, accord-ing to its maximum number of "in-connections" (incomaccord-ing edges) to the kernel or "out-connections" (outgoing edges fromx) and the number of nodes in the kernel.
A vertexx migrates to kernel K if K = argmaxl(N CI(x, Kl)) where l is a kernel
number; thenN CI is defined as N CI : x × K −→ R+such as:
N CI(x, K) = mout(x, K) min(mout(x), nK)
(7)
where mout(x, K) is the number of outgoing edges from x pointing to a kernel K,
mout(x) is the total number of outgoing edges from x or its out-neighbourhood
cardinal-ity, andnKis the kernel size, i.e the number of vertices in the kernel. The pseudo-code of
this migration approach is described in the following algorithm 2. It presents in line 1 the initialization of Communities namedGi by their corresponding kernelKi computed in
the preceding kernel extraction step (see Section 3.3.2). From line 2 to line 6, the method computes for each non-kernel node its Node Community Index (NCI) and puts it in the kernel (or growing community) whoseN CI is maximal. In line 7, results which are
global communities (communities not growing, but definitely computed) are produced.
Algorithm 2 Algorithm implementation for non-kernels vertices migration
Require: Communities KernelsListK = {K1, K2, ..., Kt}
Require: N onKernelSet = {G.nodes\ ∪ Ki} //nodes x of G not belonging to any Ki
Ensure: Global CommunitiesGK ={G1, G2, ..., Gt}
1: ∀i ∈ {1, ..., t} , Gi←− Ki
2: forx ∈ NonKernelSet do
3: ComputeN CI(x, Gi) for each Gi
4: G∗←− argmax(N CI(x, G i))
5: G∗←− G∗∪ {x}
6: end for
7: Return GK
Non-kernel vertices for the Figure 3a Network are listed below: shallowend, ab-hubbu,ryzgo, 106andpark, 3atma, brycob, 303nomad, ritajohnsonn,BizPlanUSA.
As far as the complexity of the method is concerned, in view of the size of the graph withn the number of vertices and m the number of edges, the task for extracting kernel
in Algorithm 1 is theoretically analyzed as following: The preprocessing step complexity is linear, i.eO(m). The data structures implemented in the work require respectively
the following space complexity: KDict requires in the worst case O(m) if the graph
is complete, whileK matrix computation requires O(n2). Like this, the global space
complexity is inO(n2+ m). The time complexity required to find one kernel is O(nm)
and to find the set of global kernels isO(nm2). The migration step running and time
complexity are both inO(n). Like that, we estimate the overall approach complexity to O(nm2).
4. Empirical evaluation and Experiments
In this section, we show experiment results. We evaluate a variety of models on two main tasks: Triad density of the partition and modularity evaluation. In order to evaluate kernels, the study of the kernel degree measure will be made on the illustration on Figure 3a network as shown in Figure 6, and testified through some criteria as described in Sect. 4.1 below; and the experiments wouldn’t focus on Kernel Degree metric, but on three criteria : partition Triad Density referenced byT riadDens, partition quality through
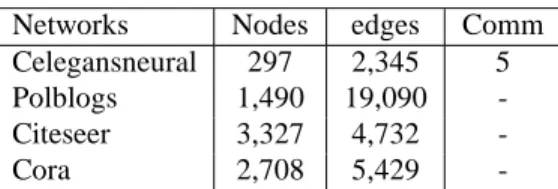
Table 1: Characteristics of the test graphs
Networks Nodes edges Comm
Celegansneural 297 2,345 5
Polblogs 1,490 19,090
-Citeseer 3,327 4,732
-Cora 2,708 5,429
-d-modularityQd defined in Formula(1) and the number of communities each partition
of experimented datasets get. Experiments were performed on aDELL Computer with
Windows8.1 OS 64 bytes, Intel Pentium Core Duo CPU of 4.2Ghz and 7GoofRAM .
In term of software, we used Python7.1 for the implementation of our solution and Gephi 0.9.11[25] andR2[24] for visualization of graph structures. We start by describing the four datasets from real life graphs used in the experiments.
4.1. Datasets
In the following experiments, we have used neural network, blog network and two paper citation networks. Information about each graph can be found in Table 1.
Celegansneural network. The file celegansneural.gml describes a weighted, directed
network representing the neural network of C. Elegans. The weighted parameter is not taken into account in this work. There are297 nodes and by 2, 345 links. This dataset
possesses5 communities as obtained by Tianbao [17].
Political Blog Network. This is a directed and unconnected network of hyperlinks
between a set of weblogs about US politics, recorded by Adamic and Glance [1]. In this network, there are totally1, 490 nodes and 19, 090 links. Seeing that the new approach
is based on connected networks, the largest connected subgraph with highest number of links and nodes is the one taken into account throughout the execution of the approach.
Paper Citation Networks. We use the Cora paper citation network and the Citeseer
paper citation network processed by Getoor et al3. There are totally2, 708 nodes and 5, 429 links in Cora network, and 3, 327 nodes and 4, 732 links in Citeseer network.
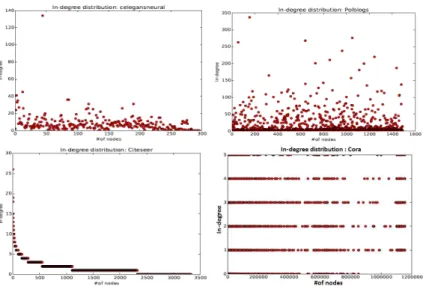
Phenomenon described by these datasets follow a power-law in-degree distribution except the in-degree distribution in Cora network. The scatter plots for in-degree valua-tion of nodes are presented in Figure 5. In fact, a small number of vertices possess a high in-degree value, implying that a small amount of nodes have high quasi-common neigh-bourhood cardinality, while larger nodes have less common nodes. Yet, the in-degree in Cora dataset follows a rather uniform distribution with in-degree no larger than 5. We suspect such a distribution is due to the small scale of the Cora dataset which leads to many references, and therefore inlinks, to be inside the dataset.
The goal of experiments is to demonstrate the robustness and the scalability of the method as the numbers of authors quoting an article favours to delimit a topic area through a pioneer area (the centre node or set of nodes). In other words, our goal is to evaluate if our new Kernel Degree based metric yields the link semantic of communities in directed networks, in accordance with triad-based community definition. The empirical evaluation of the new approach, for showing its performance, is compared to some of the other state-of-the-art methods: Walktrap [22], Edge Betweenness [9], Label Propagation [23] and Louvain [1]. Their IgraphR package implementation were used.
1. http://www.aaai.org/ocs/index.php/ICWSM/09/paper/view/154 2. https://www.R-project.org
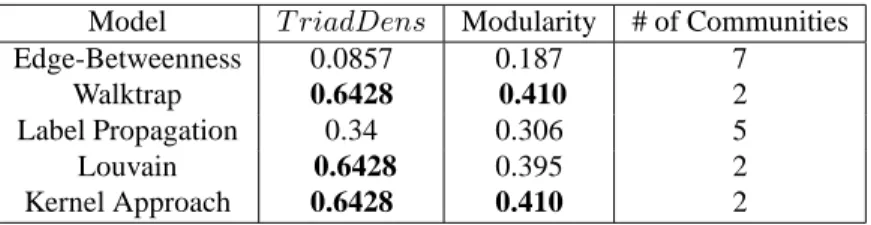
Illustration from Figure 3a network. To illustrate the results of new approach, based
on Figure 3a Network, Table 4 shows some results and compares them to Kernel Degree based approach. Thus the Kernel Degree approach and Walktrap method present the same results on the triad density and the modularity with the same number of communities, contrary to Louvain method, although detecting2 communities, computes a modularity of 0.395. Label and Edge Betweenness methods compute respectively 5 and 7 communities
with lowest triad density and modularity values. Visibly, our approach extracts better and expected structure on this Figure 3a illustration, than the other methods, as pointed up in Figure 4.
4.2. Kernel degree metric and threshold
σ
evaluation
To appreciate the powerfulness of the Kernel Degree formula, lets consider for exam-ple two networks to make this idea more concrete: Looking at Figure 3a Network and Celegansneural network, for better visualization of results, Kernel Degree computes the similarity strength between kernel vertices; in other words, it determines the kernel power. Both Triad Weight and Neighbourhood Overlap (Definition 1) are associated to reinforce this similarity. Because, when taken separately, the expected results are not purchased, as presented in the Table 2. In fact, for the Figure 3a Network, results are the same regardless of the criteria (2 communities with the same triad density and same modularity). But for
the Celegansneural network, using separately Neighbourhood Overlap or Triad Weight leads to results (91 and 73 communities respectively) far from expected one as
demon-strated by Klymko and Tianbao [5, 17] who also detect 5 communities. Furthermore,
taken separately, they lead to a computation of weak values of triad density, contrary to the new composite kernel degree metric which computes a better triad density of0.711,
which is closed to triad density value of0.78 obtained by Klymko.
As far as the thresholdσ is concerned, the empirical experiments show that when
taking values of the interclass inertia less thanσ, expected results are not purchased. For
illustration, as can be seen from the Table 3, our approach performs the best in both datasets. The Figure 3a Network, for the first case (I[eij] > σ) contains 2 communities
with a triad density of0.6428, and Celegansneural 5 communities with a high value of
triad density equals to0.711; contrary to the second case ( I[eij] < σ ) for which Figure 3a
Network just contains1 community with a low triad density of 0.417 and Celegansneural 103 communities with 0.065 triad density value. This result means that the Figure 3a
Network partition is not well structured for this second case. Figure 4 illustrates the comparison of these bothσ considerations. Higher inter-class inertia values indicate better
kernel based-triad structures and therefore, finding vertices with similar neighbours whose inter-class inertia values are upper than threshold provides a method for extracting the underlying kernel structure. The Figure 6 shows the analysis made on the idea according to which the more the inter-class inertia is upper than a thresholdσ, the more the kernel
degree values are large, meaning better triad-based structures.
4.3. Performance on Community Detection
The community detection performances for different models on the four datasets are given in Tables 5, 6, 7 and 8. The Figure 3a Network contains visibly2 communities as
shown on the Figure 4; Celegans dataset is used to illustrate the new approach methodol-ogy and its hidden idea. In fact, with this dataset, the expected number of communities andT riadDens metrics are evaluated, based on 5 communities and 0.78 for triad density
Table 2: Using metric Comparison.
Metric Figure 3a Network Celegansneural
#Comm T riadDens #Comm T riadDens
Kernel-degree 2 0.64 5 0.711
Neighbourhood Overlap 2 0.64 91 0.20
Triad Weight 2 0.64 73 0.254
Table 3:σ choice evaluation.
Inertia Criteria Figure 3a Network Celegansneural
#Comm T riadDens #Comm T riadDens I[eij] > σ 2 0.6428 5 0.711
I[eij] < σ 1 0.417 103 0.065
Figure 4: Graphical visualization of datasets on threshold evaluation for Figure 3a Net-work. On the left, the first case (I[eij] < σ) produces one community, on the right, the
second case (I[eij] > σ) produces two communities
Table 4: Community detection performance on the Twitter illustration dataset, where the best performances are in bold.
Model T riadDens Modularity # of Communities
Edge-Betweenness 0.0857 0.187 7
Walktrap 0.6428 0.410 2
Label Propagation 0.34 0.306 5
Louvain 0.6428 0.395 2
Figure 5: In-degree distribution on dataset nodes.
(a) Threshold based on Figure 3a network
(b) Threshold based on Cele-gansneural network
(c) Threshold based on Extract from Polblog network
Table 5: Community detection performance on the Celegansneural dataset, where the best performances are in bold.
Model T riadDens Modularity #of Communities
Edge-Betweenness 0.0004 0.081 194
Walktrap 0.0458 0.363 21
Label Propagation 0.0135 0.0027 29
Louvain 0.608 0.379 6
Kernel Approach 0.711 0.393 5
For the Celegansneural network (see Table 5): Edge Betweenness approach focus on links between nodes by searching the central edge (geodesic) meaning the bridge linking two communities. It detects194 communities, with the weakest T riadDens (0.0857).
Contrary to the other models, the kernel degree based-model confirms the5 communities
detected by [5], with a higherT riadDens (0.711) almost the same like the triad density
of partition of Klymko which is equals to0.689; likewise, the higher modularity (0.393)
proves its performance on the partition quality.
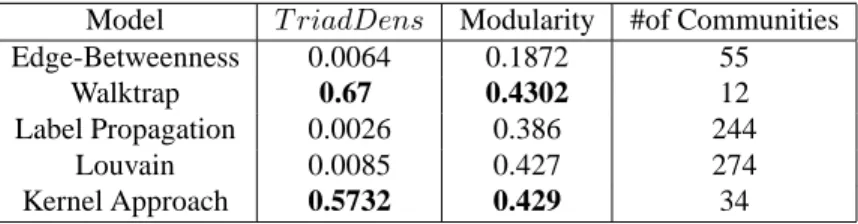
As far as Label Propagation method is concerned, a node moves from one community to another if, its neighbours belong to that community. Hence, for the polblogs network, it computes the high community number (244) with the weakest T riadDens (0.0026).
Walktrap and Kernel-degree methods perform in all of the criteria: they produce small communities (12 and 34 respectively), with highT riadDens of (0.67 and 0.5732
respec-tively) and the best modularity value of0.4302 and 0.429 respectively as shown in the
Table 6. This result indicates that models of "what is a growing-community" is somehow in agreement with the notion of kernel optimization of Kernel-degree measure. But Walk-trap performs the best, because partition is structured as unconnected modules, indicating that it captures the so-called "outliers" by [20], which are anomalous nodes (belonging to none communities). Meanwhile Louvain method results are not so interesting with a
T riadDens of 0.0085.
In the Table 7, through results presented for Citeseer dataset, Kernel degree based-model produces higher values of modularity and triad density. As shown in Figure 7, Citeseer dataset presents higher modularity, thus underwriting that this kind of network with a power-law distribution is characterized by better link density, one of the criteria of the kernel degree-based approach. Its second criteria, triad density, is underlined in Figure 8. There, Citeseer dataset presents a good exponential progression on its triad density and indicates that for the kernel degree-based approach, triad density is upper, contrary to the other datasets and other approaches.
The null modularity values for the other methods in the table 7 illustrates more the kind of scorpus that our method performs on. In fact, contrary to the other datasets, Citeseer follows the best power law distribution, because it possesses hub node(node with Table 6: Community detection performance on the Polblogs dataset, where the best per-formances are in bold.
Model T riadDens Modularity #of Communities
Edge-Betweenness 0.0064 0.1872 55
Walktrap 0.67 0.4302 12
Label Propagation 0.0026 0.386 244
Louvain 0.0085 0.427 274
Table 7: Community detection performance on the Citeseer dataset, where the best per-formances are in bold.
Model TriadDens Modularity #of Communities
Edge-Betweenness 0.0 0.5344 738
Walktrap 0.0 0.811 593
Label Propagation 0.0 0.491 842
Louvain 0.079 0.886 466
Kernel Approach 0.407 0.8907 121
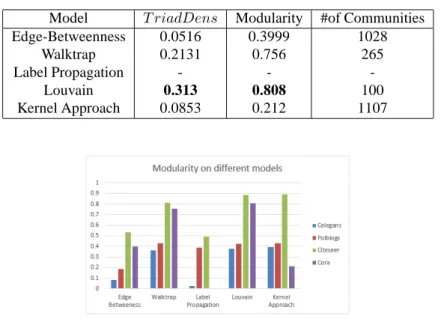
Table 8: Community detection performance on the Cora dataset, where the best perfor-mances are in bold.
Model T riadDens Modularity #of Communities
Edge-Betweenness 0.0516 0.3999 1028
Walktrap 0.2131 0.756 265
Label Propagation - -
-Louvain 0.313 0.808 100
Kernel Approach 0.0853 0.212 1107
Figure 7: Link Density (modularity) as a criteria of network type.
a higher degree distant from the other node degree), as presented in citeseer subfigure of Figure 5. Tsourakakis [14] confirms the plausibility of these results by its argumentation that low degree nodes form fewer triangles than higher degree nodes; and according to Durak [21], citation networks are dominated by heterogeneous triangles; like this, triads are included into triangle. So results on Citeseer, a citation network type, seem to be valid for these both precedent demonstrations.
For Cora network, results shown in Table 8 guarantee that the new scheme is based on power-law distribution in datasets, as the type of graph taken into account here, based on the in-degree value of nodes. As Cora follows a uniform in-degree distribution, results do not perform well; label propagation method fails on this dataset, indicating the fact that nodes already belong to communities containing their whole neighbours, thus most of these vertices do not need to move from one community to another; in the same way, the kernel degree-based approach produces weak results, denoting the kind of graphs its performs on, those characterized by power-law distribution.
These weak results for Louvain method compared with the proposed approach on the overall of datasets indicates that it focuses only on density of links in the community without no interest on the topology or semantic based on triads into the communities. The Kernel degree based approach performs the best in all the cases except on the triad density for Cora network. These results also illustrate that most of the time, it is beneficial to use both triad weight and neighbourhood overlap measures simultaneously, establishing Kernel Degree formula, to valorize the similarity kernel vertices in a directed network.
Furthermore, an efficient report made from table of results is that the more the number of communities is low the more triad density and modularity values are great. In our future studies, we will show the relative effects of metrics on the number of communities or vice versa.
5. Conclusion and Future Work
This paper has described a simple kernel scheme to improve the detection of commu-nities in directed networks, through triad density. It focuses on kernels which are seed nodes centralizing information through their in-degree valuation. Based on the defini-tion of community as a subgraph induced by kernel vertices, the new scheme basis are triads, based on the semantic relationship between kernel nodes with their neighbours. Thus, we have defined a metric called Kernel Degree, for computing the similarity be-tween kernel nodes. When the new metric is used, we obtained better triad density and modularity values on some datasets, those following the power-law degree distribution of nodes. Our model captures semantic communities based on both criteria: density of links and topology of vertices in the graph meaning communities with higher triad den-sity. We compared the modularity values for each model on the result partition, and we find a substantial improvement in the triad density measure, with appreciable changes in the traditional community detection metrics such as modularity.
The model complexity constitutes a main criteria of effectiveness for any method. With the increasing ways on information access by the era of digital, it becomes important to extend this method to parallel processing, in order to manipulate very large-scale real networks. Likewise, it is possible to apply weighted graphs to reinforce the strength of the kernel, for more community detection results near the real life, as we will study in our future works.
6. References
[1] BLONDEL, V.D., GUILLAUME, J.L., LAMBIOTTE, R. , LEFEBVRE, E.“ Fast unfolding of communities in large networks.” Journal of statistical mechanics: theory and experi-ment,vol. 10, P10008, 2008.
[2] FORTUNATO, S., “ Community detection in graphs” Physics Reports, vol. 486(3), pp. 75-174, 2010.
[3] S. KANAWATI, R., “Détection de communautés dans les grands graphes d’interactions (multi-plexes): Etat de l’art.” hal-00881668, v2,, 2013.
[4] S. KANAWATI, R., “Seed-centric approaches for community detection in complex networks.” In International Conference on Social Computing and Social Media, pp. 197-208, Springer International Publishing, (2014)
[5] KLYMKO, C., GLEICH, D.F , KOLDA, T.G, “Using Triangles to Improve Community Detec-tion in Directed Networks” Conference Stanford University, 2014.
[6] KRINGS, G. , BLONDEL, V.D. “ An upper bound on community size in scalable community detection.” arXiv preprint:1103.5569, 2011.
[7] LANCICHINETTI, A. , FORTUNATO, S., “ Community detection algorithms : a comparative analysis.” Physical review E, vol. 80(5), 2009.
[8] MALIAROS, F.D., “ Clustering and community detection in directed networks: A survey.” arXiv 1308.0971 vol. 2013.
[9] NEWMAN, M.E., “ Detecting community structure in networks.” The European Physical Jour-nal B-Condensed Matter and Complex Systems, vol. 38(2), pp. 321-330, 2004.
[10] NICOSIA, V., MANGIONI, G. , MALGERI, M., “ Extending the definition of modularity to directed graphs with overlapping communities.” Journal of Statistical Mechanics: Theory and Experiment, 2009.
[11] PRAT-PÉREZ, A., “ Shaping communities out of triangles” In CIKM 12, pp. 1677-1681, 2012.
[12] PRAT-PÉREZ, A. , DOMINGUEZ-SAL, “ High quality, scalable and parallel community de-tection for large real graphs.” Proceedings of the 23rd International Conference on World Wide Web.,pp. 225–236. WWW’14. New York, NY, USA: ACM, 2014.
[13] SATULURI, V. , PARTHASARATHY, “Symmetrizations for clustering directed graphs.” In Proceedings of the 14th International Conference on Extending Database Technology, pp. 343-354, ACM, 2011.
[14] TSOURAKAKIS, C.E., “ Fast counting of triangles in large real networks without counting: Algorithms and laws.” In 2008 Eighth IEEE International Conference on Data Mining, pp. 784-793, 2008.
[15] WANG, L., “ Detecting Community Kernels in Large Social Networks.” IEEE 11th Interna-tional Conference on Data Mining, pp. 608-617, 2011.
[16] WASSERMAN, S. , KATERIN, F., “ Social networks analysis : Methods and applications.” Physics reports,486, pp. 75–174. 1994
[17] TIANBAO, Y., YUN, C. , SHENGHUO, Z., “Directed network community detection: A pop-ularity and productivity link model.” In SIAM Data Mining’10, 2010.
[18] ZHOU, D., HOFMAN, T. , SCHLKOPF, “ Semi-supervised learning on directed graphs.” In Advances in neural information processing systems, vol. pp. 1633-1640, 2004.
[19] SERROUR, B. , ARENAS, S, “Detecting communities of triangles in complex networks using spectral optimization.” Computer Communications, 34, pp. 629–634, 2011.
[20] ESTER, M. , KRIEGEL, H , SANDER, J., “A density-based algorithm for discovering clusters in large spatial databases with noise.” Computer Communications, 96, pp. 226-231, 1996. [21] DURAK, N. , PINAR, A , KOLDA, T., “Degree relations of triangles in real-world networks
and graph models.” Proceedings of the 21st ACM international conference on Information and knowledge management, 96, pp. 1712–1716, 2012.
[22] PONS, P. , LATAPY, M, “Computing communities in large networks using random walks.” International Symposium on Computer and Information Sciences, 96, pp. 284–293, 2005. [23] RAGHAVAN, U. N.. , ALBERT, R., “Near linear time algorithm to detect community
struc-tures in large-scale networks.” Physical review E, vol. 96, pp. 036106, 2007.
[24] TEAM, R. CORE, “R: A language and environment for statistical computing. R Foundation for Statistical Computing.” , 2013.
[25] BASTIAN, M. , HETMANN, J, “An Open source software for exploring and manipulating networks.” ICWSM, 96, pp. 361–362, 2009.
[26] LESKOVEC, J. , KLEINBERG, J , FALOUTSOS, C, “Graphs over time: densification laws, shrinking diameters and possible explanations.” In Proceedings of the eleventh ACM SIGKDD international conference on Knowledge discovery in data mining, pp. 177–187, 2005.
[27] LATAPY, M. , MAGNIEN, C. , DELVECCHIO, N., “Basic notions for the analysis of large two-mode networks.” Social networks, vol. 30(1), pp. 31–48, 2008.
[28] XU, Y. , XU, HUA. , ZHANG, D., “A novel disjoint community detection algorithm for social networks based on backbone degree and expansion.” , vol. 42, pp. 8349–8360, 2015. [29] STEINHAEUSER, K. , CHAWLA, N., “Community detection in a large real-world social
network.” ,In Social computing, behavioral modeling, and prediction vol. 42, pp. 168–175, 2008.
[30] STEVEN, L. , MARTIN, M., “Close communities in social networks: boroughs and 2-clubs.” Social Netw. Analys. Mining, vol. 6, pp. 20:1–20:16, 2016.
[31] GAMGNE, D.F. , TSOPZE, N. , NDOUNDAM, R. , AHOUANDJINOU, A.R.M,“Finding directed community structures using triads.” Proceedings de la Conference sur la Recherche en Informatique CRI’17, ENSP Yaoundé 2017.
[32] TAN,PANG-NING, STEINBACH, M. , KUMAR, V.,“Introduction to Data Mining.” ISBN 0-321-32136-7, 2005.