HAL Id: hal-02794520
https://hal-univ-tours.archives-ouvertes.fr/hal-02794520
Submitted on 19 Jun 2020
HAL is a multi-disciplinary open access
archive for the deposit and dissemination of
sci-entific research documents, whether they are
pub-lished or not. The documents may come from
teaching and research institutions in France or
abroad, or from public or private research centers.
L’archive ouverte pluridisciplinaire HAL, est
destinée au dépôt et à la diffusion de documents
scientifiques de niveau recherche, publiés ou non,
émanant des établissements d’enseignement et de
recherche français ou étrangers, des laboratoires
publics ou privés.
Wood excavation, construction, and architecture in two
Reticulitermes subterranean termites
L. Berville, E. Darrouzet
To cite this version:
L. Berville, E. Darrouzet. Wood excavation, construction, and architecture in two Reticulitermes
subterranean termites. Insectes Sociaux, Springer Verlag, 2019, 66 (3), pp.403 - 411.
�10.1007/s00040-019-00696-x�. �hal-02794520�
Wood excavation, construction, and architecturein two Reticulitermes subterranean termites
1
2
Laurence Berville, Eric Darrouzet*
3
4
IRBI, UMR CNRS 7261, University of Tours, Parc de Grandmont, 37200 Tours, France
5
*Corresponding author: eric.darrouzet@univ-tours.fr
6
7
Abstract:
8
Collective constructions are marvels of complexity, composed of networks of tunnels and chambers.
9
However, it is difficult to study subterranean nests without using invasive techniques because the nests are built
10
within pieces of wood and/or in the soil. Using computerized tomography scans and medical imaging software
11
(OsiriX), we were able to observe nest creation, constructions, and architecture of two subterranean termite
12
species. We monitor the nests’ growth in three dimensions built by two Reticulitermes species: R. grassei, a
13
species native to Europe, and R. flavipes, an invasive species introduced from North America, over a
several-14
month period. Doing so, we wanted to know whether the construction of the nest could participate to the
15
invasive success of R. flavipes. Although the two species displayed some similarities (i.e., nest creation, chamber
16
size, and levels of wood consumption), only R. flavipes built interior structures. Some of these structures
17
changed over time and thus might play a role in the trade-off between wood consumption, colony protection, and
18
environmental homeostasis.19
20
Significance Statement21
Nest architectures and their management is one of the triumphs of social animals such as social insects. The
22
functional analysis of those structures composed of networks of tunnels and chambers could help to understand
23
the biology and ecology of their builders. Excavation, consumption and nest design are important parameters in
24
explaining a number of interesting biological traits such as the establishment of invasive species. Some recent
25
studies have introduced X-ray tomography as a tool to analyze insect architectures. We employed this
non-26
invasive technique to observe nest creations, construction and evolution in time, and resolve three-dimensional
27
nest architecture. We analyzed a native and an invasive subterranean termite species. Interestingly, only the
28
invasive species built specific interior structures which change over time. Our study leads to a hypothesis of
29
optimal chamber number, which balances colony wood consumption against nest functionality. The
30
constructions could play a role for environmental homeostasis that seems not necessary for the native species.
31
32
Keywords: animal architecture, tomography, Reticulitermes flavipes, R. grassei, self-organized structures, social
33
insects
34
35
Manuscript Click here to access/download;Manuscript;Manuscript
Berville-Darrouzet 19.03.2019.docx Click here to view linked References
Introduction
36
Animals can create controlled microhabitats using self-made structures. The most impressive are the nests of
37
social insects (i.e., ants, bees, wasps, and termites). Some termite mounds rise higher than 10 meters, which is
38
more than 1,000 times the height of a worker. Even more intriguing is that such nests are produced without
39
individual workers using any sort of collective “blueprint” (Buhl et al. 2005; Deneubourg and Franks, 1995).
40
Social insects have achieved remarkable ecological success and dominance (Hölldobler and Wilson, 1990),
41
perhaps due in part to their nests, which provide benefits in terms of defense, shelter (Traniello and Leuthold,
42
2000), controlled microclimatic conditions (e.g., air composition [ants: Bollazzi et al. 2012], temperature and
43
humidity [termites: Ruelle 1964]), structure, and, in some cases, food. Indeed, certain subterranean termite
44
species also consume the wood in which they live (Grassé 1984). These species serve as excellent models for
45
studying nest development as they must trade-off between food consumption (wood) and environmental
46
homeostasis. Part of this process is controlling the number and size of both tunnels and chambers. Thus, nest
47
architecture may play an important role in regulating colony activity.
48
However, subterranean lifestyle makes it difficult to characterize nest structure. Previous studies, which
49
analyzed nest architectures in several insect species, have largely employed destructive methods such as
50
fragmentation (Bouillon 1964), step-by-step excavation (King and Spink 1969; Rabeling et al. 2007; Tschinkel
51
1999), the tracing of radioisotope-labeled foragers (Spragg and Paton 1980), or casts (i.e., latex [Garner 1953],
52
cement [Bollazzi et al. 2012; Ruelle 1964], orthodontic plaster, wax, aluminum, zinc, or lead [Tschinkel 2010,
53
2011]). However, these approaches can only yield a temporal and/or spatial snapshot of the nest. They cannot
54
provide information about structural dynamics, such as the growth of tunnel networks, nor can they be used to
55
follow nest creation, wood consumption, and/or building activity over time. More recent studies, though, have
56
begun utilizing computerized tomography (CT) scans to non-invasively visualize and characterize the
57
architecture of social insect nests (ants [Halley et al. 2005; Khuong et al. 2016; Minter et al. 2012; Monaenkova
58
et al. 2015]; bees [Greco et al. 2006]; termites [Darrouzet 2013; Eom et al. 2015; Fuchs et al. 2004; Himmi et al.
59
2014, 2016; Perna et al. 2008a,b]; wasps [Darrouzet 2013]; and hornets [Darrouzet 2013; Rome et al. 2015]).
60
Using CT scans, it is possible to reconstruct a 3D structure via a series of 2D images; the structure’s inhabitants
61
are unharmed, even after several scans. Thanks to the images’ high-contrast resolution, structural differences in
62
physical density can be distinguished (see Sup. file Video 1). The ability of structures to block the X-ray beam
63
can also be characterized. Nevertheless, despite their potential, longitudinal studies using CT scans have only
64
been carried in ants (Linepithema humile: 7 or 8 scans over 6 months [Halley et al. 2005] and Lasius flavus: 8
65
scans over 48 h [Minter et al. 2012]). Their use may be tempered by the tool’s main limitation: scanner size. It is
66
impossible to analyze large structures.
67
An important requirement for the management of invasive species is to identify biological and
68
ecological factors that influence their ability to establish and spread within a new environment, and how they
69
present a significant advantage against native species. For example, Reticulitermes flavipes and R. grassei are
70
subterranean termite species which live in sympatry along the French Atlantic coast, where their colonies exhibit
71
important differences in their social organization, behavior, and breeding system (Perdereau et al. 2010, 2011,
72
2015). R. grassei is native to southwestern Europe (France and Spain). R. flavipes, in contrast, is an invasive
73
species that is native to the eastern United States but that has spread to South America (Aber and Fontes 1993;
74
Su et al. 2006) and Europe (Dronnet et al. 2006; see Evans 2013 for a review). Both species belong to the family
75
Rhinotermitidae and, as such, share certain traits. Some studies demonstrated that R. flavipes has some
76
advantages against R. grassei. For example, interspecific competition showed that R. flavipes was dominant over
77
R. grassei, and this invasive species foraged over a greater distance than R. grassei colonies (Perdereau et al,
2011). Consequently, this competitive asymmetry may enable R. flavipes to become dominant in the
79
environment. Interestingly, the main difference between the two species concerns their capacity to produce
80
secondary neotenic reproductives. Genetic studies revealed that all French R. flavipes colonies produce more
81
neotenics than R. grassei colonies (Leniaud et al, 2011). In such conditions, its interspecific superiority, its lack
82
of intraspecific aggression, the production of numerous neotenics and large extensive colonies, seem to be some
83
of the reasons for R. flavipes invasive success. Among these factors, nest-building dynamics, nest shapes and
84
sizes, wood consumption dynamics are largely unknown for both species. However, information on nest
85
dynamics is essential to understand the wood consumption dynamic and to assess the efficacy of the strategies
86
used to control invasive termite infestations (Forschler 1994). For example, they both eat and live in
non-87
decomposed wood. They are initially single-piece nesters, but they eventually move to a new piece of wood
88
when their original nests have been completely consumed (Evans 2013). Both produce large subterranean
89
colonies and are therefore ideal species for studying wood consumption.
90
In this study, we sought to discover if both Reticulitermes species build interior structures and thereby
91
to discover the relationship between these constructions and the volume and dynamic of wood consumed. Doing
92
so, we wanted to know whether the construction of the nest could participate to the invasive success of R.
93
flavipes. As such species seems to produce larger colonies and numerous neotenics, we supposed that (1) wood
94
consumption would be greater in the invasive species (to feed numerous individuals and more particularly
95
neotenics), (2) R. flavipes workers would have greater capacities to build the nest, and consequently (3) nest
96
structures from both species could present some differences in size and shape. Moreover, our study leads to a
97
hypothesis of optimal chamber number, which balances colony wood consumption against nest functionality.
98
We hypothesis that a cumulative Weibull distribution or a sigmoid function will appropriately models the
99
biological process at work.
100
To test these hypotheses, we used CT scans to characterize nest creation, construction, and architecture
101
as well as wood consumption over a ten-month period in experimental fragment colonies of both species in the
102
same experimental conditions. More specifically, we exploited CT scans to investigate (1) nest construction
103
dynamics, (2) wood consumption, and (3) intercolonial variation in both.
104
105
Materials and Methods
106
Colony rearing conditions
107
Reticulitermes colonies were collected from wood fragments and pine tree stumps in the St. Trojan
108
forest on Oléron Island (Charente-Maritime, France). They were identified to species using cuticular
109
hydrocarbon profiles (Bagnères et al. 1990, 1991). For the duration of the experiment, colonies were kept at
110
26 °C in full darkness. We then filled plastic boxes (18 x 12 x 7 cm) with moist Fontainebleau sand (very fine,
111
homogeneous granularity); sand depth was 2 mm. We added a block of untreated pine (12 x 4 x 4 cm) as a food
112
source. The sand was moistened every day. Four fragment colonies of R. grassei and six fragment colonies of R.
113
flavipes were introduced into separate boxes; each contained 900 workers and was taken from a different
field-114
collected colony.
115
116
Computerized X-ray tomography scan analysis
117
To monitor wood consumption, each plastic box was subject to CT scans(120 keV, 180 mAs) using a
118
Phillips Brillance CT 40 medical scanner, made available to us by the Neuroradiology Department at the Tours
119
Hospital (Tours, France). We obtained a series of virtual vertical “slices” through the box (thickness of 0.67 mm,
120
increments of 0.33 mm) (Fig. 1a and Sup file 1). The boxes were scanned before the termites were introduced
121
(T0) and then at regular intervals post introduction (Sup file 1): at 13 days (T1), 20 days (T2), 51 days (T3), 65
122
days (T4), 100 days (T5), 202 days (T6, Sup file video 1), and 258 days (T7).
123
Then, we analyzed each series of CT scans (DICOM standard; Fig. 1a, Sup file video 1) using OsiriX v.
124
4.19 image processing software (Darrouzet, 2013; Rosset et al. 2004), which is designed to allow 3D volumes to
125
be reconstructed from large sets of multidimensional and multimodality images (Fig. 1b,c and Sup file video 2).
126
Areas of wood consumption, which we called “regions of interest” (ROIs), were identified manually on each
127
image and measured (Fig. 1a). We thus obtained precise information about ROI size, shape, and boundaries. We
128
were also able to observe nest architecture over time, namely changes in tunnels (interior and exterior), chamber
129
number, wood consumption volume, and interior structures. One of the R. grassei colonies died between T5 and
130
T6, but we used the data available from T0 to T5.
131
132
Statistics
133
Our statistical analyses were performed using SigmaStat (v. 10.0.054). In all cases, data normality was
134
first assessed using Kolmogorov-Smirnov tests. In the results, means are presented with standard errors. To
135
compare the locations where the two species initially attacked the wood pieces, t-tests (normally distributed data)
136
and Mann-Whitney rank sum tests (non-normally distributed data) were used. To assess differences in chamber
137
volume and number across time for the two species, two-way repeated measures ANOVAs was used; a
138
posteriori pairwise comparisons were performed using Holm-Sidak tests.
139
To test if the data is suitable for a regression analysis we used a Kolmogorov-Smirnov test for a
140
normally distributed population and a constant variance test by computing the Spearman rank correlation
141
between the absolute values of the residuals and the observed value of the dependent variable. To gauge the
142
ability of the regression equation to predict the dependent variable, an ANOVA (F test) was performed. To
143
provide a measure of how well the number of chamber is dependent of the volume consumed, the coefficient of
144
determination (r2) was used.
145
146
Results147
Nest creation148
During the nest-creation period (T1 and T2), there was no clear pattern in the way the termites attacked
149
the wood (Mann-Whitney U Statistic, P=0.33): they targeted both the bottom face of the block (R. grassei, n=50;
150
R. flavipes, n=34) and the exposed faces of the block (R. grassei, n=50; R. flavipes, n=14). The first exterior
151
tunnels, made of sand, wood, and fecal pellets, were observed after 51 days; these afforded protection to the
152
termites. From that point on, it was rare to observe an attack that was not associated with a sand tunnel (R.
153
grassei, n=9; R. flavipes, n=6), as most of the new chambers were initiated from inside the tunnels (R. grassei,
154
n=215; R. flavipes, n=684), or via the extension of other chambers (R. grassei, n=188; R. flavipes, n=253). The
155
two species did not differ in their overall approach (T3 and T7; t= -0.994; P=0.359) (Fig. 2).
156
157
Wood consumption
158
As they ate through the wood, the termites generated living space for themselves. We identified 1,829
159
ROIs across the 10 study colonies; their mean size was 0.43 cm3 (range: 0.0004 - 10.25 cm3). Most ROIs were
160
small (50% < 0.111 cm3 and 90% < 1.196 cm3) (Fig. 3).
161
At each time point, the two termite species had equivalent chamber numbers (two-way repeated
162
measures ANOVA: F=1.287, df=1, P=0.289) after accounting for differences in the factor times (F=0.648, df=7,
163
P=0.714). Both species appeared to go through three phases of wood consumption (Fig. 4; F=37,945, df=7,
164
P<0.001): there were no differences in chamber number at T0, T1, and T2 (phase one), at T3 and T4 (phase two),
165
and at T5, T6, and T7 (phase three). During the first phase, a small number of new chambers were made. During
166
the second phase, chamber creation accelerated. During the third phase, chamber creation declined (Fig. 4). By
167
the end of the experiment, both species had generated almost the same number of chambers. R. flavipes nests
168
contained between 33 and 64 chambers, while R. grassei nests contained between 24 and 53 chambers (Fig. 4).
169
There also did not appear to be interspecific differences in wood consumption over time (T0 to T7;
two-170
way repeated measures ANOVA: F= 0.774, P=0.404). At the end of the experiment (i.e., after 258 days), R.
171
flavipes colonies had eaten 15.10 – 43.66 cm3 of wood, corresponding to a mean 15.51% ± 2.068 of total wood
172
block volume (Fig. 4). R. grassei had eaten 21.19 – 32.26 cm3 of wood, corresponding to a mean 14.2% ± 1.83
173
of total wood block volume (Fig. 4). While the volume of wood consumed was equivalent between species at
174
each time point, the mean consumption across time for species was different (two-way repeated measures
175
ANOVA: F=73,347, P<0.001). Within species, all pairwise comparisons between time points were statistically
176
significant, except during the first stage (T0 vs. T1, T0 vs. T2, and T1 vs. T2) and for T3 versus T4 (Fig. 4).
177
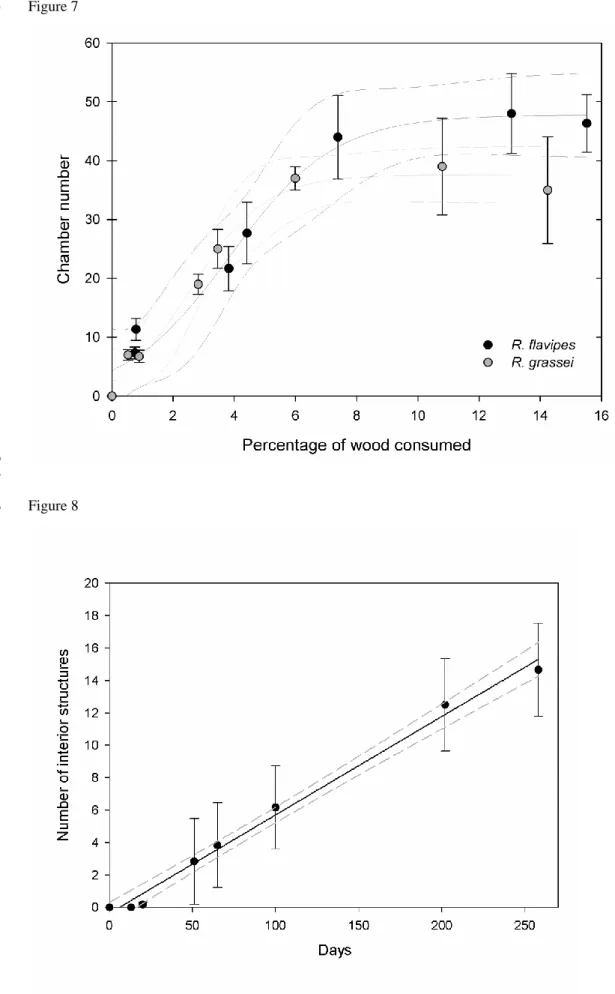
Chamber number was related to the percentage of wood volume consumed in both species (R. flavipes: r2=0.979,
178
F=65.07, P=0.0008; R grassei: r2=0.984, F=84.27, P=0.0005; Fig. 5). The best fit for the data was a
four-179
parameter non-linear regression model with f(x) = y0+a/(1+exp(-(x-x0)/b)). The equations were as follows:
180
𝑅. 𝑔𝑟𝑎𝑠𝑠𝑒𝑖 𝑦 = −2.2 +
39.80
1 + 𝑒
− 𝑥−3.85 1.24181
𝑅. 𝑓𝑙𝑎𝑣𝑖𝑝𝑒𝑠 𝑦 = −0.22 +
47.98
1 − 𝑒
− 𝑥−3.85 1.72182
183
with x = percentage of wood volume consumed, y= chamber number, a = the minimum value that can be
184
obtained (i.e. when x=0) and b = Hill’s slope of the curve. An Anova was used accordingly, demonstrating that
185
the volumes of wood consumed by both species contribute to the prediction of the number of chamber observed
186
in the nests.187
188
189
Interior structures190
Only R. flavipes seemed to have the ability to generate and modify interior architectural structures such
191
as pillars, ceilings/floors, tunnels, and inner/outer walls (Fig. 2). The timing was colony specific: the first
192
example of such structures occurred after 20 days in one colony (Fig. 8), but after 258 days in another colony.
193
By the end of the experiment, a mean of 14.5 ± 7 interior structures were present in R. flavipes nests. Although
194
there was marked intercolonial variability, there was a strong correlation between the number of days that had
195
passed and the number of such structures (r2=0.992, Anova F=747.39, P=0.0001; Fig. 8). There was a significant
196
relationship between the number of interior structures and the number of chambers (r2=0.974; F=50.45;
197
P=0.0012; Fig. 9). The best fit for the data was a four-parameter equation (Weibull distribution), where x=the
198
number of constructions:
199
200
201
Discussion
202
This study used CT scans (X-ray tomography) to provide the first detailed quantitative descriptions of
203
Reticulitermes nests dynamics. We obtained new information about nest creation, the dynamics of wood
204
consumption, the creation of chambers and tunnel networks, and shifts in interior architecture. Because initial
205
conditions were standardized (i.e., wood block size and colony size), we were able to characterize and compare
206
these features over time.
207
More specifically, we collected data on two sympatric Reticulitermes species, one native and one
208
invasive, which has helped enhance our understanding of their natural histories. First, we saw no interspecific
209
differences in the volume of wood consumed or in the number of chambers created. Second, we observed three
210
phases of wood consumption. Over the first 25 days of the experiment (Phase 1), wood consumption was low.
211
Then, the first exterior tunnels appeared, wood consumption accelerated, and a large number of small chambers
212
were created (Phase 2). Finally, 200 days into the experiment, the speed of wood consumption remained
213
unchanged, but a slightly smaller number of chambers were generated. However, these chambers were either
214
larger or the product of fusion.
215
By eating wood and engaging in building activity over a several-month period, termites can create
216
networks of interconnected galleries and chambers in which they live and through which they can travel (Grassé
217
1984, also see Sup file video 1 and 2). Within the nest, termites are also protected from predators and climatic
218
extremes. Nonetheless, a major challenge remains: sufficient ventilation (Ohashi et al. 2012). Air quality within
219
the nest can be compromised by colony respiration, namely the production and release of CO2 (Risch et al.
220
2012). In general, ventilation systems are passive, driven by temperature or velocity gradients in air currents
221
(Wenzel 1990). Indeed, termites are well known for their ability to regulate nest conditions, including
222
temperature and humidity (Lüscher 1955; Korb and Linsenmair 2000; Korb 2003; see also Turner 2001 for a
223
review). The construction of different interior structures could help enhance air flow and thus improve air
224
quality. To this end, nest configurations might need to remain dynamic. The small size of most of the chambers
225
observed in this study could be the product of a trade-off between wood consumption, colony defense, and
226
environmental homeostasis. As colonies grow, old chambers can be rearranged and new chambers can be
227
created: here, we observed that some chambers increased in size or fused.
228
One of our notable results is that, although both species displayed similar levels of wood consumption
229
and created exterior tunnels, only R. flavipes built interior structures. These included pillars, ceilings/floors, and
230
walls (Fig. 1b). Like Cubitermes species (Perna et al. 2008a), R. flavipes could adjust interior nest architecture
231
by adding and modifying the number of interior structures, depending on chamber number or wood
232
consumption. Ceilings and floors appeared in the largest chambers, and some old entrances were sealed off.
233
Since colonies were given just one piece of wood, termites were forced to eat where they lived. Consequently,
234
for R. flavipes, such structures may be part of the trade-off between wood consumption, colony defense, and
235
environmental homeostasis. In our experiment, however, exterior temperature and humidity were kept constant,
236
and the termites were enclosed in boxes, preventing any air movement. Although both species were collected
237
from the same area and thus experienced the same environmental conditions, it could be that R. grassei, the
238
native species, did not build interior structures because laboratory conditions were acceptable. Perhaps this was
239
not the case for R. flavipes, the invasive species, which may have needed to manage nest ventilation. Perna et al.
240
(2008a) showed that, in Cubitermes species, final nest topology reflects a compromise between efficiency and
241
defense. The same could be true in Reticulitermes species. Furthermore, it could be that R. flavipes utilizes
242
interior structures to help defend against predators in its native range within North America and that this
243
behavior was conserved within its introduced range in France. However, R. flavipes’ potential natural predators
244
remain unidentified.
245
Another hypothesis for the interspecific difference in the use of interior structures could be linked to the
246
production of neotenics. More specifically, R. flavipes may produce more neotenics than R. grassei: Leniaud et
247
al. (2011) observed that, after one year, 100% of R. flavipes groups (composed of workers) had produced
248
neotenics, while just 63% of R. grassei groups had done the same. Compared to R. grassei, R. flavipes produced
249
significantly more offspring because female numbers and productivity were both higher. Here, consequently, our
250
R. flavipes colonies may have been more densely populated than our R. grassei colonies after just a few months.
251
Higher densities could have led to higher CO2 concentrations and thus triggered the implementation of a
252
ventilation system mediated via interior structures. It is also conceivable that R. flavipes neotenics are more
253
sensitive to certain environmental conditions, requiring more intensive nest management. Unfortunately, because
254
we did not assess the characteristics of our colonies at the end of the study, additional research is needed to test
255
these hypotheses.
256
In our study, there was noticeable intercolonial variation in nest configuration (Sup File 1), even though
257
nests presumably share the same functional purpose and both colony numbers and wood consumption levels
258
were similar. There were no interspecific differences in chamber organization. Nest initiation was also similar.
259
Although the colonies attacked the wood block at different locations, all their entrance cavities were excavated in
260
the springwood and the network expanded along the wood’s microstructure. This pattern is evident on CT scans
261
(Fig 1c) because the degree of X-ray absorption is correlated with wood density, which is greatest for the annual
262
growth rings (Himmi et al. 2016). We found that both termite species generally excavated tunnels and chambers
263
in softer wood (Sup file 2). This particular behavior is known to be affected by wood chemistry (Abe and
264
Higashi 1991) and nutritional value (Shellman-Reeve 1994). Only a few tunnels crossed harder wood to reach
265
softer areas, which allowed nest development.
266
Taken together, our results suggest that R. grassei and R. flavipes differ in their nest-building design.
267
This study confirms that both the environment and the termites themselves can influence the expression of
268
extended phenotypes, such as nest configuration. Although substrate quality (e.g., winter/summer wood) can
269
influence nest architecture making them nest specific, while, building behavior is species specific. This study
270
also underscores the utility of CT scans as a non-invasive technique for following wood consumption and nest
271
architecture in termites over time and the expression of extended phenotypes. Indeed, the types of data it yields
272
could be used in future research efforts to model nest construction dynamics.
273
274
Acknowledgments
275
We gratefully acknowledge J. Pearce for her English revisions. We would like to thank S. Dupont for
276
rearing the termite colonies in the laboratory and D. Herbreteau for letting us use the CT scanner at Tours
277
Hospital.278
279
References280
Abe T, Higashi M (1991) Cellulose centred perspective on terrestrial community structure. Oikos 60:127–133
281
Aber A, Fontes LR (1993). Reticulitermes lucifugus (Isoptera,Rhinotermitidae), a pest of wooden structures, is
282
introduced into the South American Continent. Sociobiology 21:335-339.
283
Bagnères A-G, Clément J-L, Blum M, Severson R, Joulie C, Lange C (1990). Cuticular hydrocarbons and
284
defensive compounds of Reticulitermes flavipes (Kollar) and R. santonensis (Feytaud): polymorphism
285
and chemotaxonomy. J Chem Ecol 16:3213–3244
286
Bagnères A-G, Killian A, Clément J-L, Lange C (1991). Interspecific recognition among Termites of the genus
287
Reticulitermes. Evidence for a role for the cuticular hydrocarbons. J Chem Ecol 17:2397-2420
288
Bollazzi M, Forti LC, Roces F (2012). Ventilation of the giant nests of Atta leaf-cutting ants: Does underground
289
circulating air enter the fungus chambers? Insectes Soc. 59(4):487–498
290
Bouillon A (1964). Structure et accroissement des nids d’Apicotermes Holmgren (Isoptere, Termitinae).
295-291
326pp. In: Etudes sur les termites Africains. A. Bouillon (Eds), Université de Léopoldville.
292
Buhl J, Deneubourg JL, Grimal A, Theraulaz G (2005). Self-organized digging activity in ant colonies. Behav
293
Ecol and Socio 58(1):9–17
294
Darrouzet E (2013). Les insectes bâtisseurs : nids de termites, de guêpes et de frelons. Connaissances & Savoirs
295
(Eds).
296
Deneubourg JL, Franks NR (1995). Collective control without explicit coding: The case of communal nest
297
excavation. J Insect Behav 8(4):417–432
298
Dronnet S, Lohou C, Christidès J-P, Bagnères A-G (2006). Cuticular hydrocarbon composition reflects genetic
299
relationship among colonies of the introduced termite Reticulitermes santonensis Feytaud. J Chem Ecol
300
30:1027–1042
301
Eom Y-H, Perna A, Fortunato S, Darrouzet E, Theraulaz G, Jost C (2015). Network based model of the growth
302
of termite nests. Phy Res E 92(6): 062810
303
Evans TA, Forschler BT, Kenneth G (2013). Biology of invasive Termites: A worldwide review. Annu Rev
304
Entomol 58:455-74
305
Forschler BT (1994), Fluorescent spray paint as a topical marker on subterranean termites (Isoptera:
306
Rhinotermitidae). Sociobiology, 24, pp. 27–38
307
Fuchs A, Schreyer A, Feuerbach S, Korb J (2004). A new technique for termite monitoring using computer
308
tomography and endoscopy. Inter J Pest Manag 50(1):63–66
309
Garner M R (1953). The Preparation of Latex Casts of Soil Cavities for the Study of Tunneling Activities of
310
Animals. Science, 118(3066):380–381
311
Grassé PP (1984). Termitologia. Fondation des sociétés - Construction. Tome2. Paris: Masson.
312
Greco M, Bell M, Spooner-Hart R, Holford P (2006). X-ray computerized tomography as a new method for
313
monitoring Amegilla holmesi nest structures, nesting behaviour, and adult female activity. Entomol Exp
314
et App 120(1):71–76
315
Halley JD, Burd M, Wells P (2005). Excavation and architecture of Argentine ant nests. Insectes Soc. 52(4):350–
316
356
317
Himmi SK, Yoshimura T, Yanase Y, Oya M, Torigoe T, Imazu S (2014). X-ray tomographic analysis of the
318
initial structure of the royal chamber and the nest-founding behavior of the drywood termite Incisitermes
319
minor. J Wood Science 60(6):453–460
320
Himmi SK, Yoshimura T, Yanase Y, Mori T, Torigoe T, Imazu S (2016). Wood anatomical selectivity of
321
drywood termite in the nest-gallery establishment revealed by X-ray tomography. Wood Science Tech
322
50(3):631–643
323
Hölldobler B, Wilson E (1990). Colony Odor and Kin Recognition. In The Ants (pp. 197–199).
324
Khuong A, Gautrais J, Perna A, Sbaï C, Combe M, Theraulaz G (2016). Stigmergic construction and
325
topochemical information shape ant nest architecture. PNAS 113(5):201509829
326
King EG, Spink WT (1969). Foraging Galleries of the Formosan Subterranean Termite, Coptotermes
327
formosanus, in Louisiana. An Entomol Soc Am 62(3):536–542
328
Korb J, Linsenmair KE (2000) Thermoregulation of termite mounds: what role does ambient temperature and
329
metabolism of the colony play? Insectes Soc. 47:357-363
330
Korb J (2003). Thermoregulation and ventilation of termite mounds. Naturwissneschaften 90:212-219
331
Leniaud L, Darrouzet E, Dedeine F, Ahn K, Huang Z, Bagnères A-G (2011). Ontogenic potentialities of the
332
worker caste in two sympatric subterranean termites in France. Evol Dev 13:138–148
333
Lüscher M, (1955). Der Sauerstoffverbrauch bei Termiten und die Ventilation des Nestes bei Macrotermes
334
natalensis (Haviland). Acta Trop 12:289-307
335
Minter NJ, Franks NR, Robson Brown KA (2012). Morphogenesis of an extended phenotype: four-dimensional
336
ant nest architecture. J Royal Soc Interface 9(68):586–595
337
Monaenkova D, Gravish N, Rodriguez G, Kutner R, Goodisman MD, Goldman, DI. (2015). Behavioral and
338
mechanical determinants of collective subsurface nest excavation. J. Exp. Biol. 218, 1295-1305.
339
doi:10.1242/jeb.113795.
340
Ohashi M, Domisch T, Finér L, Jurgensen MF, Sundström L, Kilpeläinen J, Risch AC, Niemelä P (2012). The
341
effect of stand age on CO2 efflux from wood ant (Formica rufa group) mounds in boreal forests. Soil
342
Biol. Biochem 52:21–28
343
Perna A, Jost C, Couturier E, Valverde S, Douady S, Theraulaz G (2008a). The structure of gallery networks in
344
the nests of termite Cubitermes spp. revealed by X-ray tomography. Naturwissenschaften 95(9) :877–884
345
Perna A, Valverde S, Gautrais J, Jost C, Solé R, Kuntz P, Theraulaz G (2008b). Topological efficiency in
three-346
dimensional gallery networks of termite nests. Physica A: Stat Mech App 387(24):6235–6244
347
Perdereau E, Bagnères AG, Dupont S, Dedeine F. (2010). High occurrence of colony fusion in a European
348
population of the American termite Reticulitermes flavipes. Insectes sociaux, 57(4), 393-402.
349
Perdereau E, Dedeine F, Christidès JP, Dupont S, Bagnères AG. (2011). Competition between invasive and
350
indigenous species: an insular case study of subterranean termites. Biological Invasions, 13(6),
1457-351
1470.
352
Perdereau E, Bagnères AG, Vargo EL, Baudouin G, Xu Y, Labadie P, Dupont S, Dedeine F. (2015).
353
Relationship between invasion success and colony breeding structure in a subterranean termite. Molecular
354
ecology, 24(9), 2125-2142.
355
Rabeling C, Verhaagh M, Engels W (2007). Comparative study of nest architecture and colony structure of the
356
fungus-growing ants, Mycocepurus goeldii and M. smithii. J Insect Sci 7(40):1–13
357
Risch AC, Anderson TM, Schütz M (2012). Soil CO2 emissions associated with termitaria in Tropical savanna:
358
evidence of hot-spot compensation. Ecosystems 15:1147–1157
359
Rome Q, Muller FJ, Touret-Alby A, Darrouzet E, Perrard A, Villemant C (2015). Caste differentiation and
360
seasonal changes in Vespa velutina (Hym.: Vespidae) colonies in its introduced range. J App Entomol
361
139(10):771–782
362
Rosset A, Spadola L, Ratib OJ (2004). OsiriX: An Open-Source Software for Navigating in Multidimensional
363
DICOM Images. Digit Imaging 17:205
364
Ruelle J (1964). L’Architecture du nid de Macrotermes natalensis et son sens fonctionnel. In A. Bouillon (Ed.),
365
Etudes sur les termites Africains. Université de Léopoldville.
366
Shellman-Reeve JS (1994) Limited nutrients in a dampwood termite: nest preference, competition and
367
cooperative nest defence. J Anim Ecol 63:921–932
368
Spragg WT, Paton R (1980). Tracing, Trophallaxis and Population Measurement of Colonies of Subterranean
369
Termites (Isoptera) Using a Radioactive Tracer. An Entomol Soc Am 73(6):708-714
370
Su NY, Ye WM, Ripa R, Scheffrahn RH, Giblin-Davis RM (2006). Identification of Chilean Reticulitermes
371
(Isoptera: Rhinotermitidae) inferred from three mitochondrial gene DNA sequences and soldier
372
morphology. An Entomol Soc Am 99(2): 352-363
373
Traniello JFA, Leuthold RH (2000). Behavior and Ecology of Foraging in Termites. In: Abe Takuya, Bignell
374
David Edward, Higashi Masahiko, editors. Termites: Evolution, Sociality, Symbioses, Ecology.
375
Dordrecht: Springer Netherlands. Kluwer Academic Publishers; 2000. p. 141–68
376
Tschinkel WR (1999). Sociometry and sociogenesis of colony-level attributes of the Florida harvester ant
377
(Hymenoptera: Formicidae). An Entomol Soc Am 92(1):80-89
378
Tschinkel WR (2010). Methods for casting subterranean ant nests. J Insect Sc 10(1)
379
Tschinkel WR (2011). Back to basics: sociometry and sociogenesis of ant societies (Hymenoptera: Formicidae).
380
Myrmecol News 14:49-54
381
Turner JS (2001). On the mound of Macrotermes michaelseni as an organ of respiratory gas exchange. Phys
382
Biochem Zool 74(6):798-822
383
Wenzel JW (1990). Nest design and secondary functions of social insect architecture. In G.Veeresh, B. Mallick,
384
C. Viraktamath (Eds.), Social insects and the environment (pp. 657–658).
385
386
387
Legends:
388
Figure 1. Two-dimensional DICOM scans of Reticulitermes nests. Locations in which wood had been consumed
389
(regions of interest: ROIs) were traced manually (dotted line below). Their areas were then calculated (white
390
shapes below).
391
392
Figure 2. On the left is a three-dimensional image showing the exterior tunnels performed by R. flavipes
393
termites. In the center and on the right are two-dimensional images of interior structures (red circle: cap; orange
394
oval: wall; yellow circle: pillar) made with sand. Softer wood (i.e., of lower density) is black or gray, while
395
harder wood (i.e., of higher density) is white.
396
397
Figure 3. Three-dimensional images of R. grassei nests, where sand-based and wood-based structures can be
398
distinguished (yellow vs. brown, respectively). Here, areas in which wood is present (i.e., based on density
399
values) have been artificially removed to allow the chambers (white) to be more easily observed.
400
401
Figure 4. Percentage of attacks at different locations on the wood blocks for the two termite species. The
402
percentages were calculated using all the observations from all the colonies. The “outer sides” were the exposed
403
faces of the block. The “underside” was the face in contact with the ground. “Interior” indicates chambers built
404
from an earlier chamber. “After tunneling” indicates attacks initiated from within a sand tunnel that targeted the
405
sides of the block.
406
407
Figure 5. Species-specific distributions of ROI volume
408
409
Figure 6. Boxplots of chamber number (light gray bars), volume of wood consumed (dark gray bars), and the
410
percentage of the total wood consumed (dark line) over time in nests built by R. grassei (upper graph) and R.
411
flavipes (lower graph). Within the boxes, the solid white lines are the means and the solid black lines are the
412
medians.
413
414
Figure 7. Relationship between chamber number and the percentage of wood consumed for R. grassei (gray)
415
and R. flavipes (black). The solid lines represent the best-fit regression lines, and the dotted lines indicate the
416
95% confidence intervals.
417
418
Figure 8. Number of interior structures built by R. flavipes over time (means ± SE). The solid black line is the
419
best-fit regression line, and the dotted gray lines indicate the 95% confidence interval.
420
421
Figure 9. Relationship between chamber number and interior structure number for R. flavipes (means ± SE). The
422
solid black line is the best-fit regression line, and the dotted gray lines indicate the 95% confidence interval.
423
Figure 1
425
426
427
Figure 2428
429
430
Figure 3431
432
433
Figure 4
434
435
436
437
Figure 5438
439
440
441
Figure 6
442
443
444
Figure 7
445
446
447
Figure 8448
449
450
451
Figure 9