HAL Id: hal-03124451
https://hal.archives-ouvertes.fr/hal-03124451
Submitted on 28 Jan 2021
HAL is a multi-disciplinary open access
archive for the deposit and dissemination of
sci-entific research documents, whether they are
pub-lished or not. The documents may come from
teaching and research institutions in France or
abroad, or from public or private research centers.
L’archive ouverte pluridisciplinaire HAL, est
destinée au dépôt et à la diffusion de documents
scientifiques de niveau recherche, publiés ou non,
émanant des établissements d’enseignement et de
recherche français ou étrangers, des laboratoires
publics ou privés.
transcriptome through oocyte-specific promoter usage
Changwei Yu, Nevena Cvetesic, Vincent Hisler, Kapil Gupta, Tao Ye, Emese
Gazdag, Luc Negroni, Petra Hajkova, Imre Berger, Boris Lenhard, et al.
To cite this version:
Changwei Yu, Nevena Cvetesic, Vincent Hisler, Kapil Gupta, Tao Ye, et al.. TBPL2/TFIIA complex
establishes the maternal transcriptome through oocyte-specific promoter usage. Nature
Communica-tions, Nature Publishing Group, 2020, 11, pp.6439. �10.1038/s41467-020-20239-4�. �hal-03124451�
TBPL2/TFIIA complex establishes the maternal
transcriptome through oocyte-specific promoter
usage
Changwei Yu
1,2,3,4
, Nevena Cvetesic
5
, Vincent Hisler
1,2,3,4
, Kapil Gupta
6
, Tao Ye
1,2,3,4
,
Emese Gazdag
1,2,3,4
, Luc Negroni
1,2,3,4
, Petra Hajkova
5
, Imre Berger
6
, Boris Lenhard
5
,
Ferenc Müller
7
, Stéphane D. Vincent
1,2,3,4,8
✉ & László Tora
1,2,3,4,8
✉
During oocyte growth, transcription is required to create RNA and protein reserves to achieve
maternal competence. During this period, the general transcription factor TATA binding
protein (TBP) is replaced by its paralogue, TBPL2 (TBP2 or TRF3), which is essential for RNA
polymerase II transcription. We show that in oocytes TBPL2 does not assemble into a
canonical TFIID complex. Our transcript analyses demonstrate that TBPL2 mediates
tran-scription of oocyte-expressed genes, including mRNA survey genes, as well as specific
endogenous retroviral elements. Transcription start site (TSS) mapping indicates that TBPL2
has a strong preference for TATA-like motif in core promoters driving sharp TSS selection, in
contrast with canonical TBP/TFIID-driven TATA-less promoters that have broader TSS
architecture. Thus, we show a role for the TBPL2/TFIIA complex in the establishment of the
oocyte transcriptome by using a specific TSS recognition code.
https://doi.org/10.1038/s41467-020-20239-4
OPEN
1Institut de Génétique et de Biologie Moléculaire et Cellulaire, 67404 Illkirch, France.2Centre National de la Recherche Scientifique (CNRS), UMR7104,
67404 Illkirch, France.3Institut National de la Santé et de la Recherche Médicale (INSERM), U1258, 67404 Illkirch, France.4Université de Strasbourg,
67404 Illkirch, France.5Imperial College London, South Kensington Campus, London SW7 2AZ, UK.6Max Planck Bristol Centre for Minimal Biology,
University of Bristol, Cantock’s Close, Bristol BS8 1TS, UK.7Institute of Cancer and Genomic Sciences, College of Medical and Dental Sciences, University of
Birmingham, Birmingham B15 2TT, UK.8These authors contributed equally: Stéphane D. Vincent, László Tora. ✉email:[email protected];[email protected]
123456789
R
egulation of transcription initiation by RNA polymerase II
(Pol II) is central to all developmental processes. Pol II
transcription requires the stepwise assembly of
multi-protein complexes called general transcription factors (GTFs)
and Pol II
1. The evolutionary conserved TFIID complex plays a
major role in transcription initiation as it is the first GTF to
initiate the assembly of the pre-initiation complex (PIC) by
recognising the core promoter
2. TFIID is a large multiprotein
complex composed of the TATA box-binding protein (TBP) and
13 TBP-associated factors (TAFs) in metazoa
3. The model
sug-gesting that transcription is always regulated by the same
tran-scription complexes has been challenged in metazoans by the
discovery of cell-type-specific complexes containing specialised
GTF-, TBP- or TAF-paralogs
4. Two TBP paralogues have been
described in vertebrates: TBPL1 (TBP-like factor; TLF, also
known as TRF2) has been identified in all metazoan species
5–10,
while TBPL2 (also known as TRF3 or TBP2) has only been
described in vertebrates
11,12. Remarkably, while Tbpl1 and Tbpl2
mutants display embryonic phenotypes in non-mammalian
species
7–10,12,13, Tbpl1 and Tbpl2 loss of function in mouse
results in male and female sterility, respectively
14–16, suggesting
that in mammals, these two TBP-like proteins are involved in
cell-specific transcription. While TBPL2 shares a high degree of
identity (92%) within the conserved saddle-shaped C-terminal
DNA-binding core domain of TBP
17, the C-terminus of TBPL1 is
more distant with only 42% identity
12. As a consequence TBPL2,
but not TBPL1, is able to bind canonical TATA box sequences
in vitro
5,12,18. The N-terminal domains of the three vertebrate
TBP-related factors do not show any conservation. All three
vertebrate TBP-related factors can interact with the GTFs TFIIA
and TFIIB, and can mediate Pol II transcription initiation
in vitro
12,13,18–20. However, how alternative initiation complexes
form, how they regulate cell-type-specific transcription and how
they recognise promoter sequences remain unknown.
Mapping of the transcription start sites (TSSs), at single
nucleotide by Cap Analysis of Gene Expression (CAGE) revealed
two main modes for transcription start site (TSS) usage
21.
Transcription initiation within a narrow region, called “sharp” (or
focused) TSS-type, is common in highly active, tissue-specific
gene promoters containing TATA boxes. While transcription
initiation with multiple initiation positions within an about 100
bp region, called “broad” TSS promoter architecture
21, is more
characteristic to ubiquitously expressed and developmentally
regulated genes (reviewed in ref.
22). During zebrafish maternal to
zygotic transition, it was described that two TSS-defining
gram-mars coexist, in core promoters of constitutively expressed genes
to enable their expression in the two regulatory environments
23.
Maternally active promoters in zebrafish tend to be sharp, with
TATA-like, AT-rich (W-box) upstream elements guiding TSS
selection, while embryonically active broad promoter
archi-tectures of the same genes appear to be regulated by nucleosome
positioning. Although a number of germ cell-specific, as well as
somatic transcriptional regulators, have been well characterised
during folliculogenesis (reviewed in ref.
24), the exact actors and
mechanisms required for setting up the oocyte-specific
tran-scriptome have not yet been identified in vertebrates.
Female germ cells develop during oogenesis leading to the
formation of a highly differentiated and specialised cell, the
oocyte. In females, oocytes enter meiosis during embryonic life.
Quiescent primordial follicles composed of meiotically arrested
oocytes at the late diplotene stage and surrounded by granulosa
cells are formed perinatally in mice (reviewed in ref.
24). Shortly
after birth, some primordial follicles enter folliculogenesis and
undertake a growth phase during which a specific oocyte-specific
transcriptome is set up, and oocytes increase their size until the
pre-antral follicular stage
25. A remarkable feature of oocytes is the
very high expression of retrotransposons driven by Pol II
tran-scription. These elements are interspersed with repetitive
ele-ments that can be mobile in the genome. One of the three major
classes of retrotransposons in mammals is the long terminal
repeat (LTR) retrotransposons derived from retroviruses, also
known as endogenous retroviruses (ERVs) that is subdivided in
three sub-classes: ERV1, ERVK and endogenous retrovirus-like
ERVL-MaLR (mammalian apparent LTR retrotransposons)
(reviewed in ref.
26). Transcription of mobile elements in specific
cell types depends on the presence of a competent promoter
recognition transcription machinery and/or the epigenetic status
of the loci where these elements have been incorporated.
Remarkably, MaLRs encode no known proteins, but
MaLR-dependent transcription is key in initiating synchronous
devel-opmentally regulated transcription to reprogramme the oocyte
genome during growth
27.
Remarkably, during oocyte growth, TBP protein is absent and
replaced by TBPL2
28. Indeed, TBP is only expressed up to the
primordial follicular oocytes and becomes undetectable at all
subsequent stages during oocyte growth. In contrast, TBPL2 is
highly expressed in the growing oocytes, suggesting that TBPL2 is
replacing TBP for its transcription initiating functions during
folliculogenesis
28. In agreement with its oocyte-specific
expres-sion, a crucial role of TBPL2 for oogenesis was demonstrated in
Tbpl2
−/−females, which show sterility due to defect in secondary
follicle production
16,29. In the absence of TBPL2,
immuno-fl
uorescent staining experiments showed that elongating Pol II
and histone H3K4me3 methylation signals were abolished
between the primary and secondary follicle stage oocytes,
sug-gesting that Pol II transcription was impaired
16. Initially, TBPL2/
TRF3 was suggested to be expressed during muscle
differentia-tion
30, but this observation was later invalidated
16,29. Altogether,
the available data suggested that TBPL2 is playing a specialised
role during mouse oocyte development. However, how does
TBPL2 regulate oocyte-specific transcription and what is the
composition of the associated transcription machinery, remained
unknown.
Here, we demonstrate that in oocytes TBPL2 does not assemble
into a canonical TFIID complex, while it stably associates with
TFIIA. The observation that the oocyte-specific deletion of Taf7, a
TFIID-specific TAF, does not influence oocyte growth and
maturation, corroborates the lack of TFIID in growing oocytes.
Our transcriptomics analyses in wild-type and Tbpl2
−/−oocytes
show that TBPL2 mediates transcription of oocyte-expressed
genes, including mRNA destabilisation factor genes, as well as
MaLR ERVs. Our transcription start site (TSS) mapping from
wild-type and Tbpl2
−/−growing oocytes demonstrates that
TBPL2 has a strong preference for TATA-like motif in gene core
promoters driving specific sharp TSS selection. This is in marked
contrast with TBP/TFIID-driven TATA-less gene promoters in
preceding stages that have broad TSS architecture. Our results
show a role for the TBPL2-TFIIA transcription machinery in a
major transition of the oocyte transcriptome mirroring the
maternal to zygotic transition that occurs after fertilisation,
completing a full germline cycle.
Results
Oocyte-specific TBPL2/TFIIA complex distinct from TFIID.
To characterise TBPL2-containing transcription complexes, we
prepared whole-cell extracts (WCE) from 14 days postnatal (P14)
mouse ovaries and analysed TBPL2-associated proteins by
anti-mTBPL2 immunoprecipitation (IP) coupled to label-free mass
spectrometry (Fig.
1
a and Supplementary Fig. 1a, b). To
deter-mine the stoichiometry of the composition of the
immunopre-cipitated complexes, normalised spectral abundance factor
a
d
b
g
h
e
c
f
Tg(Zp3-Cre/+);Taf7
flox/∆*
500 µm ovary WCE flowthrough #1 flowthrough #2 IP anti-TAF7 (d) IP anti-TAF10 (e) IP anti-TBPL2 (f)Tg(Zp3-Cre/+);Taf7
flox/+*
500 µm 0.0 0.1 0.2 0.3 0.4 0.5 0.6 0.7 0.8 TBPL2 TBP TA F1 TA F2 TAF3 TAF4A TAF4 B TA F5TAF6 TAF7 TAF7L TAF8 TAF11 TAF13 TAF9 TAF9B TAF10 TAF12 TAF5L TAF6L
SUPT7L SF3B3 SF3B5 SUPT20 SUPT3 TA
D A1 TRRAP TFIIA −αβ ALF TFIIA −γ TFIIB NSAF
anti-TBPL2 IP (flowthrough #2)
0.0 0.2 0.4 0.6 0.8 1.0 1.2 1.4 1.6 1.8 2.0 2.2 2.4 2.6 TBPL2 TBP TAF1 TA F2 TAF3 TAF4A TAF4 BTAF5 TAF6 TAF7 TAF7L TAF8 TAF11 TAF13 TAF9 TAF9B TAF10 TAF12 TAF5L TAF6L
SUPT7L SF3B3 SF3B5 SUPT20 SUPT3 TA
DA 1 TRRAP TFIIA −αβ ALF TFIIA −γ TFIIB NSAF
anti-TAF10 IP (flowthrough #1)
0 1 2 3 4 5 6 7 8 9TBPL2 TBP TAF1 TAF2 TAF3 TAF4A TAF4B TAF5 TAF6 TAF7 TAF7L TAF8 TAF11 TAF13 TAF9 TAF9B TAF10 TAF12 TAF5L TAF6L
SUPT7L SF3B3 SF3B5 SUPT20 SUPT3 TA
D A1 TRRAP TFIIA −αβ ALF TFIIA −γ TFIIB NSAF
anti-TAF7 IP (ovary WCE)
NSAF 0.0 0.2 0.4 0.6 0.8 1.0 1.2 1.4 1.6
TBPL2 TBP TAF1 TAF2 TAF3 TAF4A TAF4B TAF5 TAF6 TAF7 TAF7L TAF8 TAF11 TAF13 TAF9 TAF9B TAF10 TAF12
TFIIA
−αβ ALF
TFIIA
−γ
TFIIB
anti-TBP IP (ovary WCE)
TBPL2 TBP TFIID-TAFs shared-TAFs SAGA TFIIA TFIIB 0.00 0.02 0.04 0.06 0.08 0.10 0.12 0.14 0.16 0.18 0.20 0.22 0.24 0.26TBPL2 TBP TAF1 TAF2 TAF3 TAF4A TAF4B TAF5 TAF6 TAF7 TAF7L TAF8 TAF11 TAF13 TAF9 TAF9B TAF10 TAF12
TFIIA −αβ ALF TFIIA −γ TFIIB NSAF
anti-TBPL2 IP (ovary WCE)
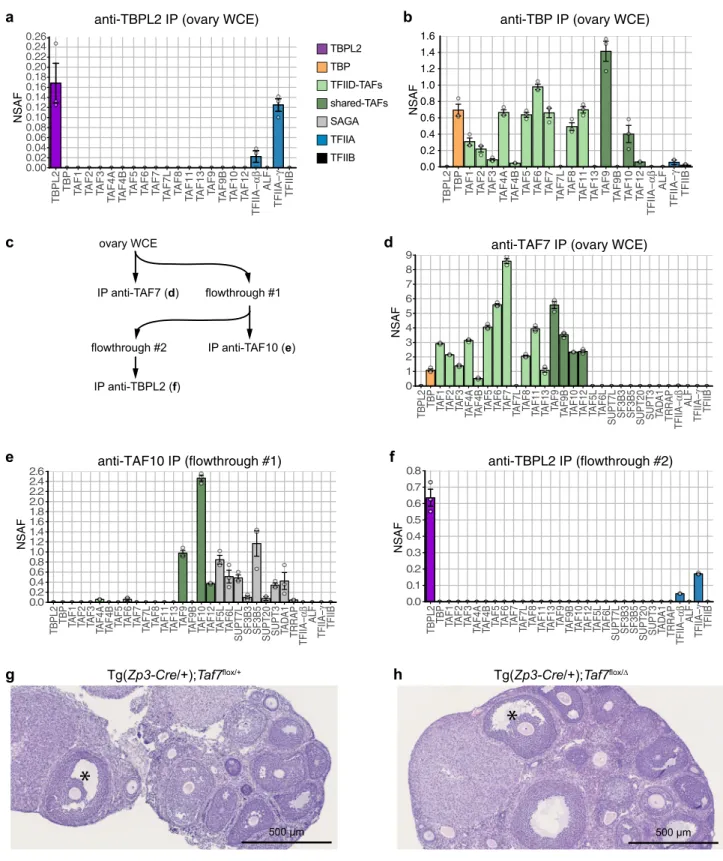
Fig. 1 TBPL2 does not assemble in a TFIID-like complex in growing oocytes. a Anti-TBPL2 immunoprecipitation followed by mass spectrometry (IP-MS) analysis from three biological replicates of mouse ovarian whole-cell extracts (WCE). The colour code for the different proteins or complexes is indicated on the right. NSAF; normalised spectral abundance factor. b Anti-TBP IP-MS from ovarian WCE (three technical triplicates). The colour code is the same as in (a). c–f Sequential IP-MS experiment from ovarian WCE (three technical triplicates). The strategy of the sequential immunoprecipitation (c), anti-TAF7 IP-MS (d), followed by an anti-TAF10 IP-MS (e) and then an anti-TBPL2 IP-MS (f). The colour code is the same as in (a). g, h Representative views of haematoxylin and eosin-stained ovaries sections from control (g) and oocyte-specific Taf7 mutant (Tg(Zp3-Cre/+);Taf7flox/∆, h) ovaries (analyses of three
sections from three biological replicates). The presence of antral follicles is indicated by an asterisk. Scale bars: 500µm. In (a, b, d–f) grey dots indicate replicates and error bars,+/− standard error of the mean.
(NSAF) values were calculated
31. In the anti-TBPL2 IPs, we
identified TFIIA-αβ and TFIIA-γ subunits as unique GTF
sub-units associated with TBPL2 (Fig.
1
a and Supplementary Data 1).
As ovaries contain many other non-oocyte cell types that express
TBP, in parallel from the same extracts we carried out an
anti-TBP IP. The mass spectrometry of the anti-anti-TBP IP indicated that
TBP assembles into the canonical TFIID complex in non-oocyte
cells (Fig.
1
b and Supplementary Data 2). As growing oocytes
represent only a tiny minority of ovary cells, we further tested the
TBPL2-TFIIA interaction by a triple IP strategy (Fig.
1
c): first, we
depleted TAF7-containing TFIID complexes with an anti-TAF7
IP; second, the remaining TFIID and SAGA complexes, which
contain also shared TAFs
32, were depleted with an anti-TAF10 IP
using the anti-TAF7 IP flow-through as input; third, we
per-formed an anti-TBPL2 IP on the anti-TAF7/anti-TAF10
flow-through fraction (Fig.
1
d–f and Supplementary Data 3). The
analysis of this third consecutive IP further demonstrated that
TBPL2 forms a unique complex with TFIIA-αβ, and TFIIFA-γ,
but without any TFIID subunits.
To further analyse the requirement of TFIID during oocyte
growth, we carried out a conditional depletion of the
TFIID-specific Taf7 gene during oocyte growth using the Zp3-Cre
transgenic line
33(Supplementary Fig. 1c–g). Remarkably, TAF7 is
only detected in the cytoplasm of growing oocytes
(Supplemen-tary Fig. 1c). The oocyte-specific deletion of Taf7 did not affect
the presence of secondary and antral follicles and the numbers of
collected mature oocytes after superovulation (Fig.
1
g, h and
Supplementary Fig. 1f). The lack of phenotype is not due to an
inefficient deletion of Taf7, as TAF7 immunolocalization is
impaired (Supplementary Fig. 1d, e), and as oocyte-specific Taf7
mutant females are severely hypofertile (Supplementary Fig. 1g).
The observations that TBP is not expressed in growing oocytes,
and that the oocyte-specific deletion of Taf7 abolishes the
cytoplasmic localisation of TAF7, but does not influence oocyte
growth, show that canonical TFIID does not assemble in the
nuclei of growing oocytes. Thus, our results together demonstrate
that during oocyte growth a stable TBPL2-TFIIA complex forms,
and may function differently from TBP/TFIID.
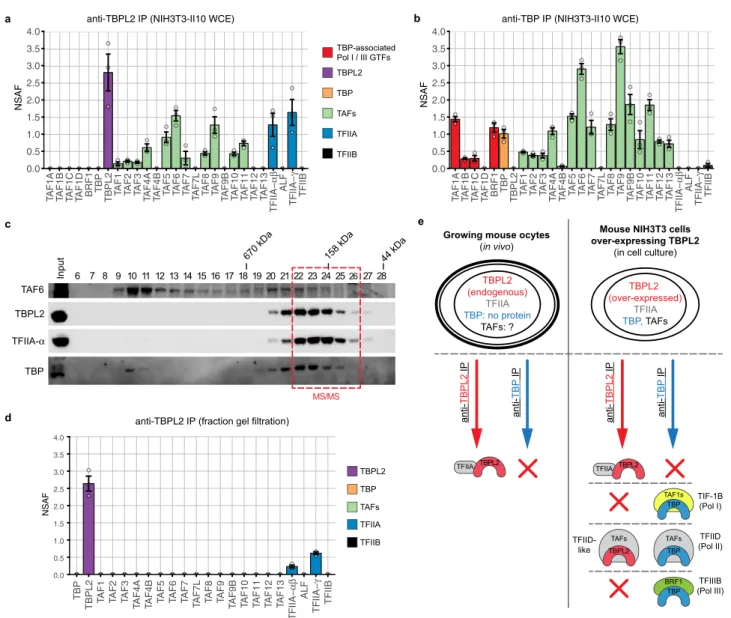
In order to further characterise the composition of the
TBPL2-TFIIA complex, we took advantage of NIH3T3 cells artificially
overexpressing TBPL2 (NIH3T3-II10 cells
28). In this context
where TBP and TAFs are present, TFIID is efficiently pulled
down by an anti-TBP IP, but no interaction with TFIIA could be
detected (Fig.
2
b). Interestingly, the anti-TBPL2 IP showed that
the artificially expressed TBPL2 can incorporate in TFIID-like
complexes as TAFs were co-IP-ed (Fig.
2
a); however, with much
lower stoichiometry (NSAF values) than that of TBP (Fig.
2
b). In
contrast, strong interaction with TFIIA-αβ and TFIIFA-γ were
detected, suggesting that the TBPL2-TFIIA complex can be
formed in the NIH3T3-II10 cells and that TBPL2, to the contrary
to TBP has the intrinsic ability to interact with TFIIA.
Remarkably, in spite of the high similarity between the core
domains of TBP and TBPL2, no interaction with Pol
I-associated SL1 (TAF1A-D) and Pol III-I-associated TFIIIB
(BRF1) complexes
34could be detected in the anti-TBPL2 IPs
either in NIH3T3-II10 cells or in ovary WCEs (Fig.
2
a and
Supplementary Data 1). In contrary, in the same extracts TBP
associates with these Pol I and Pol III complexes (Fig.
2
b and
Supplementary Data 2), suggesting that TBPL2 is not involved in
Pol I and Pol III transcription initiation in the growing oocytes.
To analyse whether TBPL2 associates with TFIID TAFs and
TFIIA in the same complex, we performed a gel filtration analysis
of NIH3T3-II10 WCE. The profile indicated that most of the
TBPL2 and TFIIA could be found in the same fractions (22–26)
eluting around 150–200 kDa, while TBPL2 protein was below the
detection threshold of the western blot assay in the
TAF6-containing fractions 9–15 (Fig.
2
c). To verify that TBPL2 and
TFIIA are part of the same complex in fractions 22–26, we IP-ed
TBPL2 from these pooled fractions and subjected them to mass
spectrometric analysis. Our data confirmed that in these fractions
eluting around 170 kDa, TBPL2 and TFIIA form a stable complex
that does not contain any TAFs (Fig.
2
d and Supplementary
Data 4). Thus, all these experiments together demonstrate that
TBPL2/TFIIA form a stable complex in oocytes, where TBP is not
expressed and TBPL2/TFIIA is the only promoter recognising
transcription complex that could direct Pol II transcription
initiation (see the summary of all the IPs in Fig.
2
e).
TBPL2-dependent oocyte transcriptome. To characterise the
growing oocyte-specific transcriptome and its dependence on
TBPL2, we have performed a transcriptomic analysis of wild-type
(WT) and Tbpl2
−/−oocytes isolated from primary (P7) and
secondary (P14) follicles (Figs.
3
,
4
and Supplementary Fig. 2,
Supplementary Data 5). We observed the downregulation of a
high number of oocyte-specific genes, out of which Bmp15 and
Gdf9 served as internal controls
35,36, as they were already
described to be regulated by TBPL2
16(Fig.
3
a, b and
Supple-mentary Fig. 2a). The principal component analysis showed that
the four distinct RNA samples clustered in individual groups and
that the main explanation for the variance is the genotype, and
then the stage (Supplementary Fig. 2b). Comparison of the
RNA-level fold changes between mutant and WT oocytes showed that
in Tbpl2
−/−, there is a massive downregulation of the most highly
expressed transcripts, both at P7 and P14 (Supplementary
Fig. 2c). The Pearson correlation between the P7 and P14 fold
change datasets for transcripts expressed above 100 normalised
reads was close to 0.8 (Supplementary Fig. 2c), indicating that
Tbpl2 loss of function similarly altered RNA levels at P7 and
P14 stages. We, therefore, focused on the P14 stage for the rest of
the study.
In WT P14 oocytes transcripts corresponding to 10791 genes
were detected. Importantly, many of these detected transcripts
have been transcribed at earlier stages and are stored in growing
oocytes
37. As there is no Pol II transcription in Tbpl2
−/−growing
oocytes
16, RNAs detected in the Tbpl2
−/−mutant oocytes
represent mRNAs transcribed by a TBP/TFIID-dependent
mechanism and deposited into the growing oocytes
indepen-dently of TBPL2 activity at earlier stages, i.e., at the primordial
follicular stage, where TBP is still expressed. The proportion of
genes (1396) upregulated following Tbpl2 deletion (Fig.
3
c) can be
explained by two mutually not exclusive ways: (i) the
conse-quence of the normalisation to the library size resulting in a slight
overestimation of upregulated transcripts, and underestimation of
downregulated transcripts and/or (ii) by transcript buffering
mechanisms due to mRNA stabilisation
38. Validation of the
upregulation of some candidate transcripts levels (Supplementary
Fig. 2d, e) strongly supports the latter hypothesis (but see also the
next paragraph).
Nevertheless, we detected 1802 significantly downregulated
transcripts in the Tbpl2
−/−oocytes (Fig.
3
c). The downregulation
of key genes known to be expressed during oocyte growth, such as
Bmp15, Eloc, Fgf8, Gdf9 and Zar1
35,36,39, were confirmed by
RT-qPCR (Supplementary Fig. 2f, g). These results suggest that
TBPL2 has an important role in gene expression in the growing
oocytes. Gene Ontology (GO) analyses of the biological process of
the identified downregulated categories of genes (Supplementary
Data 6) indicated that many genes, involved in meiosis II and
distinct cell cycle processes, were significantly downregulated
(Supplementary Fig. 2h). The most enriched molecular function
GO category was “poly(A)-specific ribonuclease activity”
contain-ing many genes codcontain-ing for factors or subunits of complexes
contributing to deadenylation/decapping/decay activity in
eukar-yotes (Fig.
3
d) (i.e., CCR4-NOT, PAN2/PAN3
40; DCP1A/DCP2
41or BTG4
39). In good agreement with the transcriptome analyses,
transcripts coding for these “poly(A)-specific ribonuclease
activity” factors were significantly downregulated in Tbpl2
−/−mutant P14 oocytes when tested by RT-qPCR (Fig.
3
e and
Supplementary Fig. 2i). Thus, in P14 oocytes TBPL2 is regulating
the transcription of many genes coding for factors, which are in
turn crucial in regulating the stability and translation of the
mRNA stock deposited during early oogenesis, as well as
transcription of meiosis II- and cell cycle-related genes to prepare
the growing oocytes for the upcoming meiotic cell division.
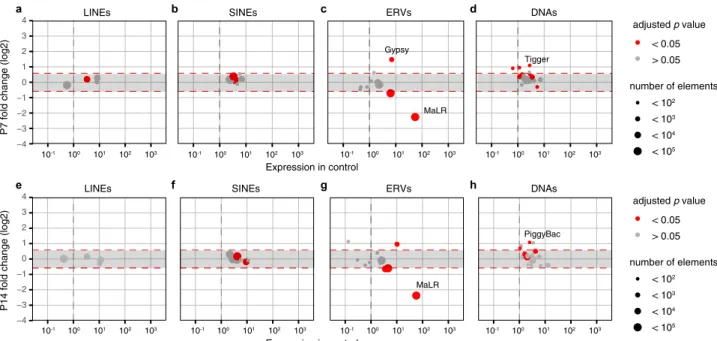
A remarkable feature of oocytes is the very high expression of
retrotransposons driven by Pol II transcription (see
“Introduc-tion”). As expected, in WT P7 and P14 oocytes, the expression of
ERVs was found to be the most abundant
27,42(Supplementary
Fig. 3a–c). Importantly, the transcription of the vast majority of
MaLR elements was the most affected in Tbpl2
−/−mutant
oocytes at P7 and P14 (Fig.
4
). Among them, three highly
expressed members, MT-int, MTA_Mm and MTA_Mm-int, were
dramatically downregulated in P7 and P14 Tbpl2
−/−mutant
oocytes (Supplementary Fig. 3d, e). As in P14 oocytes, TBPL2
depletion is reducing transcription more than fourfold from
MaLR ERVs, which often serve as promoters for neighbouring
genes
27,42, TBPL2 could seriously deregulate oocyte-specific
transcription and consequent genome activation.
This demonstrates that TBPL2 is orchestrating the de novo
restructuration of the maternal transcriptome and that TBPL2 is
crucial for indirectly silencing the translation of the earlier
deposited TBP-dependent transcripts.
Growing mouse ocytes (in vivo)
Mouse NIH3T3 cells over-expressing TBPL2
(in cell culture)
TBPL2 (endogenous) TFIIA TBP: no protein TAFs: ? TBPL2 (over-expressed) TFIIA TBP, TAFs anti-TBP IP anti-TBPL2 IP TBP TAFs TBPL2 TAFs TFIIA TBPL2 anti-TBP IP anti-TBPL2 IP TFIIA TBPL2 TFIID (Pol II) TFIID-like TBP TAF1s TIF-1B (Pol I) TBP BRF1 TFIIIB (Pol III) Input 6 7 8 9 10111213141516171819 20 21 22 23 24 252627 28 TAF6 TBPL2 TBP TFIIA-α
670 kDa 158 kDa 44 kDa
MS/MS 0.0 0.5 1.0 1.5 2.0 2.5 3.0 3.5 4.0 TBP TBPL2 TAF 1 TAF 2 TAF 3 TAF 4A TAF 4B TAF 5 TAF 6 TAF 7 TAF 7L TAF 8 TAF 9 TAF 9B
TAF10 TAF11 TAF12 TAF13
TFIIA −αβ ALF TFIIA −γ TFIIB NSAF TBPL2 TBP TAFs TFIIA TFIIB c e d a b
anti-TBPL2 IP (fraction gel filtration)
TBPL2 TBP TAFs TFIIA TFIIB TBP-associated Pol I / III GTFs 0.0 0.5 1.0 1.5 2.0 2.5 3.0 3.5 4.0
TAF1A TAF1B TAF1C TAF1D BRF1 TBP TBPL2 TAF1 TAF2 TAF3 TAF4A TAF4B TAF5 TAF6 TAF7 TAF7L TAF8 TAF9 TAF9B TAF10 TAF11 TAF12 TAF13
TFIIA −αβ ALF TFIIA −γ TFIIB NSAF
anti-TBPL2 IP (NIH3T3-II10 WCE)
0.0 0.5 1.0 1.5 2.0 2.5 3.0 3.5 4.0
TAF1A TAF1B TAF1C TAF1D BRF1 TBP TBPL2 TAF1 TAF2 TAF3 TAF4A TAF4B TAF5 TAF6 TAF7 TAF7L TAF8 TAF9 TAF9B TAF10 TAF11 TAF12 TAF13
TFIIA −αβ ALF TFIIA −γ TFIIB NSAF
anti-TBP IP (NIH3T3-II10 WCE)
Fig. 2 TBPL2 assembles into a TBPL2/TFIIA and TFIID-like complexes in NIH3T3 cells overexpressing TBPL2. a Anti-TBPL2 immunoprecipitation followed by mass spectrometry (IP-MS) analysis (three technical replicates) of NIH3T3 overexpressing TBPL2 (NIH3T3-II10) whole-cell extracts (WCE). The colour code for the different proteins or complexes is indicated on the right. b Anti-TBP IP-MS analysis (three technical replicates) of NIH3T3-II10 WCE. Colour legend for the different proteins is the same as in (a). c Western blot of a Superose 6 gel filtration analysis of NIH3T3-II10 WCE probed with anti-TAF6 (top panel), anti-TBPL2 and anti-TFIIA-α (middle panels) and anti-TBP (bottom panel) antibodies. Fraction numbers are shown above each lane, and the elution of known molecular mass markers is indicated above the panels. The pooled fractions used for mass spectrometry analysis are indicated in red. d Anti-TBPL2 IP-MS analysis (three technical replicates) of the gel filtration fraction indicated in (c). The colour code for the different proteins or complexes is indicated on the right. NSAF normalised spectral abundance factor. e Schematic representation of the fundamental differences existing between TBPL2- and TBP-containing complexes in growing oocytes and NIH3T3-II10 cells. In (a, b, and d) grey dots indicate replicates and error bars,+/− standard error of the mean.
TBPL2-driven promoters contain TATA box and are sharp.
The promoter usage changes during zebrafish maternal to
zygotic transition revealing different rules of transcriptional
initiation in oocyte and in embryo, driven by independent and
often overlapping sets of promoter “codes”
23. Importantly, this
switch has not yet been demonstrated in mammals and the role
of TBPL2 in this switch during oogenesis remained to be
investigated. To this end, we mapped the TSS usage by carrying
out super-low input carrier-CAGE (SLIC-CAGE)
43from WT
and Tbpl2
−/−P14 oocytes. To characterise only the
TBPL2-driven promoters, we removed the CAGE tags present in the
Tbpl2
−/−dataset from the WT P14 dataset, to eliminate
tran-scripts that have been deposited at earlier stages (hereafter
called “TBPL2-dependent”). Conversely, the Tbpl2
−/−dataset
corresponds to the TBP/TFIID-dependent, or
TBPL2-independent TSSs (hereafter called “TBPL2-TBPL2-independent”).
Next, we analysed the genome-wide enrichment of T- and/or
A-rich (WW) dinucleotide motifs within the −250/+250 region
centred on the dominant TSSs of the TBPL2-dependent and
TBPL2-independent oocyte TSS clusters (Fig.
5
a, b).
TBPL2-dependent TSS clusters are strongly enriched in a well-defined
WW motif around their −30 bp region (Fig.
5
a, red arrowhead)
44.
In contrast, only about 1/3rd of the TBPL2-independent TSS
clusters contained WW-enriched motifs at a similar position
(Fig.
5
b, red arrowhead), as would be expected from promoters
that lack maternal promoter code determinants
23,44. As canonical
a b c e d Cnot8 Cnot3 Pan2 Cnot7 Dis3l Atp2c1 Zfp36l1 Pan3 Ern1 Cnot6l Patl2 Btg4 Dcp1a Zfp36 Dcp2 Cnot6 Hnrnpdl Exosc3 Lsm8 Hnrnpd Xnr1 Cnot1 Xnr2 Dis3 Khsrp Exosc10 Dcps Dcp1b Exosc8 Exosc4 Exosc7 Exosc1 Lsm3 Parn Cnot4 Smg6 Elavl1 Patl1 Nudt16l1 Lsm6 Exosc9 Exosc5 Lsm5 Lsm4 Lsm2 Exosc2 Lsm1 Lsm7 Zfp36l2 Nudt16 Zc3h12a P14 WT oocytes P14 Tbpl2-/- oocytes 3 4 2 log10(expression WT) log2(fold change) -4 -2 0 2 4 poly(A)−specific ribonuclease activity ubiquitin protein ligase activity ubiquitin−like protein ligase activity histone binding RNA polymerase II−specific DNA- binding transcription factor binding ATPase activity, coupled ubiquitin−protein transferase activity ubiquitin−lkie protein transferase activity enzyme activator activity ATPase activity FDR MF fold enrichment 0 2 4 6 0.05 0.04 0.03 0.02 0.01 0.00 1802 genes downregulated 1396 genes upregulated 10-1 10-1 100 100 101 101 102 102 103 103 104 104 105 105 106 106P14 WT expression (normalized reads))
P14 KO expression (normalized reads)
non significant adjusted p.value ≤ 0.05 adjusted p.value ≤ 0.05 |log2(fold change)| > 1 Tbpl2 -/-WT Tbpl2 -/-WT P14 P7 Refseq Uqcrq Gdf9 Tbpl2 -/-WT Tbpl2 -/-WT P14 P7 Refseq Bmp15
Fig. 3 Expression of genes related to the mRNA deadenylation/decapping/decay pathways in growing Tbpl2−/−mutant oocytes. a, b Normalised
Integrative Genomic Viewer (IGV) snapshots of Bmp15 (a) and Gdf9 (b) loci. Exons and introns are indicated. c Expression comparison between wild-type (WT) and Tbpl2−/−mutant postnatal day 14 (P14) oocytes (biological triplicates). Expression was normalised to the median size of the transcripts in kb.
Grey dots correspond to non-significant genes and genes with high Cook’s distance, light-blue dots to significant genes for an adjusted P value≤ 0.05 and dark-blue dots to significant genes for an adjusted P value≤ 0.05 and an absolute log2 fold change > 1, after two-sided Wald test and Benjamini–Hochberg correction for multiple comparisons. The number of up- or downregulated genes is indicated on the graph. d Downregulated genes GO category analyses for the molecular functions (MF). The top ten most enriched significant GO categories for a FDR≤ 0.05 are represented. e Heatmap of selected genes involved in mRNA decay, decapping or deadenylation pathways. Expression levels in fold change (compared to the mean of WT) of three biological replicates of P14 WT and P14 Tbpl2−/−mutant oocytes are indicated. The fold change colour legend is indicated at the bottom. The first column on the left
TATA boxes are often associated with tissue-specific gene
promoters, we investigated whether the above observed WW
motif densities correspond to TATA boxes using the TBP
position weight matrix (PWM) from the JASPAR database as a
reference. To this end, the presence of TATA boxes was analysed
in the TSS clusters of the two datasets and revealed that
TBPL2-dependent TSS clusters were enriched in high-quality TATA
boxes, including a clear increase in the proportion of canonical
TATA boxes, when compared to TBPL2-independent TSS
clusters (Fig.
5
c). Genome browser view snapshots indicate that
TSS clusters in P14 WT oocytes tend to be sharp and are
associated with TATA-like motifs (Supplementary Fig. 4a, b).
Analysis of the global distribution of the number of TSSs and of
the width of the TSS clusters in the above-defined two categories
confirmed that TBPL2-dependent TSS are sharper compared to
the TBPL2-independent TSS clusters (Supplementary Fig. 4c, d).
In order to test whether TBPL2 controls transcription initiation
from maternal promoter code determinants, we grouped the
expression profiles corresponding to each consensus TSS clusters,
to characterise promoter activity profiles among datasets by
performing self-organising maps (SOMs)
45(Supplementary
Fig. 4e). We then focussed on the two most distinct SOM
groups: the downregulated promoters (blue group, containing
9442 consensus TSS clusters) (Fig.
5
d) and the upregulated
promoters (red group, with 6900 consensus TSS clusters) (Fig.
5
e).
Motif analyses of these two categories of promoters in their −35/
+5 regions relative to the different dominant TSSs indicated that
only the core promoters associated with TBPL2-dependent
dominant TSSs belonging to the downregulated gene promoters
contain a well-defined 7 bp long TATA box-like motif (W-box) in
their −31 to −24 regions (Fig.
5
f, g and Supplementary Fig. 4f–i).
Importantly, W-box-associated TSSs architecture usage
distribu-tion for these TBPL2-dependent dominant TSSs was sharp
(Supplementary Fig. 4j, l), as expected for motif-dependent
transcriptional initiation
23,44. In contrast, TBPL2-independent
TSSs belonging to the upregulated promoters exert a much
broader TSS pattern (Supplementary Fig. 4k, m). Interestingly,
GO analyses of the genes associated with the downregulated
promoters revealed a strong association with deadenylation/
decapping/decay activity (Supplementary Fig. 4n–p,
Supplemen-tary Data 7), further confirming our initial RNA-seq analysis
observations (Fig.
3
).
Importantly, TSS architecture analyses of the
TBPL2-dependent MaLR ERV TSSs indicated that the majority of
MaLR core promoters contain high-quality TATA box motif
(median of the TATA box PWM match is 85%, Fig.
5
h–j).
These observations together demonstrate that the TBPL2/
TFIIA complex drives transcription initiation primarily from
core promoters that contain a TATA box-like motif in their
core promoter and directs sharp transcription initiation from
the corresponding promoter regions to overhaul the growing
oocyte transcriptome.
In addition, we observed that TSS usage can shift within the
promoter of individual genes depending on the genetic
back-ground (Supplementary Fig. 4b). To get more insights into these
promoter architecture differences, we identified genome-wide
6429 shifting promoters by comparing either TBPL2-dependent
to TBPL2-independent TSS data. These results are consistent with
TSS shifts between TBP/TFIID-dependent somatic-like and
maternal promoter codes occurring either in 5′ or 3′ directions
(Fig.
6
a and Supplementary Fig. 4q)
44. WW motif analysis
indicated that on each shifting promoter, TBPL2-dependent
dominant TSSs are associated with WW motifs, while
TBPL2-independent dominant TSSs are not (Fig.
6
b). In addition, the
TATA box PWM match analyses indicated that these WW motifs
are enriched in TATA box-like elements compared to the
corresponding TBPL2-independent shifting TSSs (Fig.
6
c). Thus,
our experiments provide a direct demonstration that TBP/TFIID
and TBPL2/TFIIA machineries recognise two distinct sequences
co-existing in promoters of the same genes with TBPL2 directing
a stronger WW/TATA box-dependent sharp TSS selection in
them.
a b c d e f g h Tigger DNAs 101 102 103 100 10-1 Gypsy MaLR ERVs 101 102 103 100 10-1 SINEs 101 102 103 100 10-1 −3 −4 −2 −1 0 1 2 3 4 101 102 103 100 10-1 LINEs adjusted p value < 0.05 > 0.05 number of elements < 102 < 103 < 104 < 105 adjusted p value < 0.05 > 0.05 number of elements < 102 < 103 < 104 < 105 PiggyBac DNAs 101 102 103 100 10-1 MaLR ERVs 101 102 103 100 10-1 Expression in control SINEs 101 102 103 100 10-1 Expression in controlP7 fold change (log2)
LINEs −3 −4 −2 −1 0 1 2 3 4 101 102 103 100 10-1
P14 fold change (log2)
Fig. 4 Expression of the mammalian apparent LTR retrotransposons (MaLR) endogenous retroviral elements (ERV) are downregulated in growing Tbpl2−/−mutant oocytes. a–h Differential expression between wild-type and Tbpl2−/−mutant postnatal day (P) 7 (a–d) and P14 (e–h) oocytes of the
different transposon classes; RNA transposon classes [LINEs (a, e), SINEs (b, f) and ERVs (c, g)] and DNA transposons (DNAs (d, h)). The ERV sub-class III mammalian apparent LTR retrotransposon (MaLR) family is the most severely affected in Tbpl2−/−mutant oocytes at P7 and P14. Dot size and colour
Discussion
In this study, we show that a unique basal transcription
machinery composed of TBPL2 associated with TFIIA is
con-trolling transcription initiation during oocyte growth,
orches-trating a transcriptome change prior to fertilisation using an
oocyte-specific TTS usage.
TBPL2 expression in mice is limited to the oocytes and in its
absence, oocytes fail to grow and Tbpl2
−/−mouse females are
sterile
16,28. In a mirroring situation, TBPL1 (TRF2) expression is
enriched during spermatogenesis, and male germ cells lacking
TBPL1 are blocked between the transition from late-round
spermatids to early elongating spermatids
14,15. An interesting
a
b
c
d
e
g
h
i
j
f
MaLR TBPL2-independent TSS (1333 sequences) 0.00 0.25 0.50 0.75 1.00 1.25 −35 −30 −25 −20 −15 −10 −5 +1 +5information content (bits)
MaLR TBPL2-dependent TSS (2565 sequences) 0.00 0.25 0.50 0.75 1.00 1.25 −35 −30 −25 −20 −15 −10 −5 +1 +5
information content (bits)
TBPL2-independent TSS TBPL2-dependent TSS 30 31 32 33 0 5 10 15 0 10 20 30 40 50 60 70 80 90 100 TATA box PWM match (%)
percentage p value < 2.2 10-16 TBPL2-indendent TSS of the up-regulated promoters (6900 sequences) 0.0 0.2 0.4 0.6 −35 −30 −25 −20 −15 −10 −5 +1 +5
information content (bits)
TBPL2-dependent TSS of the down-regulated promoters (9442 sequences) 0.0 0.2 0.4 0.6 −35 −30 −25 −20 −15 −10 −5 +1 +5
information content (bits)
up-regulated promoters TBPL2 dependent TSS TBPL2 independent TSS TBPL2 dependent TSS TBPL2 independent TSS down-regulated promoters 0.0 0.5 1.0 1.5 2.0 2.5 3.0 3.5 4.0 4.5 5.0 5.5 6.0 0 10 20 30 40 50 60 70 80 90 100 TATA box PWM match (%)
percentage p value < 2.2 10-16 TBPL2-independent TSS TBPL2-dependent TSS TBPL2-independent TSS -250 +1 +250 0.68 0.22 0.03 0.00 WW -250 +1 +250 TBPL2-dependent TSS 0.65 0.21 0.03 0.00 WW sequences (32448) sequences (23886)
Fig. 5 Core promoter regions of TBPL2-specific transcription units in postnatal day 14 oocytes are enriched in TATA-like elements and are sharp. a, b Genome-wide A/T-rich dinucleotide (WW) motif analyses of−250/+250 sequences centred on the dominant transcription start sites (TSS, position +1, dashed red line) of TBPL2-dependent (a n= 32,448) and TBPL2-independent (b n = 23,886) TSS clusters. Sequences have been ordered by increasing size of the interquantile width of each. The red arrowheads indicate the WW enrichment at position−30 in the TBPL2-dependent TSS clusters (a) and the equivalent position in the TBPL2-independent TSS clusters (b). The number of TSS clusters is indicated in brackets. c Distribution of the best TATA box position weight matrix (PWM) matches within a−35 to −20 region upstream of the dominant TSSs (+1) of TBPL2-dependent (blue) compared to the TBPL2-independent (orange) TSS clusters. The dashed lines indicate the median of the TATA box PWM matches for the TBPL2-dependent (blue) and the TBPL2-independent (orange) TSS clusters (P value after a two-tailed Wilcoxon rank-sum test). d, e Two selected self-organising map (SOM) groups of the consensus TSS clusters: the downregulated promoters (blue, d) and the upregulated promoters (red, e) groups. f, g Sequence logos of the−35/ +5 sequence of the TBPL2-dependent dominant TSSs from the downregulated promoters (f) and of the TBPL2-independent dominant TSSs from the upregulated promoters (g). h, i Sequence logo of the−35/+5 sequence of the MaLR ERVs TBPL2-dependent (h) and TBPL2-independent (i) dominant TSSs. j Distribution of the best TATA box PWM matches within a−35 to −20 region upstream of the TBPL2-dependent (blue) and TBPL2-independent (orange) mammalian apparent LTR retrotransposons (MaLR) endogenous retroviral elements (ERV) dominant TSS. The dashed lines indicate the median of the TATA box PWM matches for the TBPL2-dependent (blue) and the TBPL2-independent (orange) TSS clusters (P value after a two-tailed Wilcoxon rank-sum test).
parallel between TBPL2 and TBPL1 is that both TBP-type factors
form endogenous stable complexes with TFIIA. The beginning of
TBPL2 accumulation in the oocyte nuclei or TBPL1 accumulation
in male germ cell nuclei coincides with the phase of meiosis
I
15,28,46. It is thus conceivable that TBPL2-TFIIA in oocytes or
TBPL1-TFIIA during spermatogenesis are involved in the control
of gene expression in a meiotic context to set up the
corre-sponding transcriptome. Interestingly, both transcription
com-plexes seem to function in a compacted chromatin environment
in which TBP/TFIID probably cannot. However, while TBPL2
and TBP show contrasting expression patterns in the oocytes
28,
TBPL1 and TBP are co-expressed in spermatids
46,47and it has
been suggested that TBPL1 is a testis-specific subunit of TFIIA
that is recruited to PIC containing TFIID and might not primarily
act independently of TFIID/TBP to control gene expression in
round spermatids
48. While TBPL1 forms a complex also with the
TFIIA-αβ paralogue, ALF, in testis
48–50, TBPL2 does not stably
associate with ALF, in spite of the fact that it is expressed in
oocytes
50.
TBP-like factors are bipartite proteins with variable N-terminal
domains and relatively well-conserved shared C-terminal
domains (core domains) forming a saddle-like structure with a
concave surface that is known to bind to DNA
17. Interestingly,
TBPL1 has a very short N-terminal domain
5,18, suggesting that it
lost some abilities to interact with partners. Our data suggest that
despite their very high similarity (92% identity between the core
domains of TBP and TBPL2; reviewed in ref.
51), TBP and TBPL2
display different properties as they seem to recognise different
DNA sequences to regulate gene promoters with different
pro-moter architectures. Our IP-MS analyses from ovary WCE
indi-cate that contrary to TBP, TBPL2 does not interact with TAFs in
growing oocytes. Our analyses in the NIH3T3-II10 cells that
overexpress TBPL2 showed that TBPL2 can interact with TAFs in
this artificial situation, albeit with less affinity compared to TFIIA,
or TBP-TAFs interactions. Our transcriptomic data indicate that
all Taf mRNAs, except Taf7l, are detected in growing oocytes
(Supplementary Data 5). However, whether they are also
expressed in oocytes at the protein level is not yet known, except
for TAF4B that has been detected in female neonate oocytes
52.
Nevertheless, our data suggest that TAF7 is expressed, but
loca-lised to the cytoplasm. It is conceivable that, similarly to Tbp
mRNA that is transcribed, but not translated in oocytes
53, Taf
mRNA translations (other than Taf7) are also inhibited and thus,
the canonical TFIID, or its building blocks, cannot be assembled,
and as a result, the canonical TFIID is not present in the nuclei of
growing oocytes. Another reason why TBPL2 does not interact
with TAFs or ALF, but rather interacts with TFIIA could be its
N-terminal domain that is very different from that of TBP (only 23%
identity
51).
TBPL2 proteins from different vertebrates show a high degree
of similarity in their C-terminal core domains amongst
them-selves, but display very little conservation in their N-terminal
domains
12. It is interesting to note that TBPL2 deficiency leads to
embryonic phenotypes in Xenopus
13and zebrafish
12, because,
contrary to the mouse, TBPL2 is still present in the embryo after
fertilisation and thus may act in parallel with TBP in the
tran-scription of specific embryonic genes
10,54. The molecular
mechanism by which TBPL2 controls the transcription of these
specific sets of genes in frogs and in fish has not been studied. On
the contrary, TBPL2 in mammals is only expressed in growing
oocytes and the only phenotype that can be observed in mammals
is female sterility
16,29.
LTR retrotransposons, also known as ERVs, constitute ~10% of
the mouse genome (reviewed in ref.
55). While their expression is
generally suppressed by DNA methylation and/or repressive
histone modifications, a subset of ERV subfamilies retains
tran-scriptional activity in specific cell types
56. ERVs are especially
active in germ cells and early embryos (reviewed in ref.
26).
Indeed, many genome-wide transcripts are initiated in LTRs, such
as for example of MaLRs in mouse oocytes, which constitute ~5%
of the genome
57. Members of the MT subfamily of MaLRs are
particularly active in oocytes and hundreds of MT LTRs have
been co-opted as oocyte-specific gene promoters
27,58. As
LTR-initiated transcription units shape also the oocyte methylome, it
will be important to analyse also how TBPL2 influences DNA
methylation in oocytes.
Oocytes display remarkable post-transcriptional regulatory
mechanisms that control mRNA stability and translation. During
c
b
a
0.0 0.5 1.0 1.5 2.0 2.5 3.0 3.5 4.0 4.5 5.0 5.5 6.0 0 10 20 30 40 50 60 70 80 90 100TATA box PWM match (%)
percentage
shifting promoters p value < 2.2 10-16
TBPL2-independent TSS
TBPL2-dependent TSS
shifting promoter sequences (6429)
-250 +1 +250
TBPL2-independent domintant TSS
TBPL2-dependent dominant TSS +250
shifting promoter sequences (6429)
-250 +1 0.61 0.20 0.03 0.00 WW
Fig. 6 Shifting promoters. a, b Analysis of the TBPL2-dependent versus TBPL2-independent shifting promoters within a−250/+250 region centred on the position of the TBPL2-independent transcription start sites (TSS) clusters (position+ 1 in (a, b) and red dashed line in (b)). Position of the TBPL2-dependent (blue) and of the TBPL2-inTBPL2-dependent (orange) dominant TSSs for each shifting promoter sequence (a) and WW dinucleotide enrichment heatmap (l) from the same set of sequences ordered as in (b). c Distribution of the best TATA box PWM matches within a−35 to −20 region upstream of the TBPL2-dependent (blue) and TBPL2-independent (orange) dominant TSS of the shifting promoters. The dashed lines indicate the median of the TATA box PWM matches for the TBPL2-dependent (blue) and the TBPL2-independent (orange) shifting TSS clusters (P value after a two-tailed Wilcoxon rank-sum test).
oogenesis, the oocyte genome is transcriptionally active, and the
newly synthesised maternal mRNAs are either translated or
stored in a dormant form (reviewed in ref.
37). The newly
syn-thesised transcripts receive a long poly(A) tail and subsequently
undergo poly(A) shortening in the oocyte cytoplasm, preventing
translation. Until resumption of meiosis, mRNAs with a short
poly(A) tail are stored in the cytoplasm in a dormant form (for a
review, see ref.
59). Thus, poly(A) tail deadenylation, amongst
other activities, coordinates post-transcriptional regulation of the
oocyte mRNA pool. Interestingly, TBPL2 is regulating the
activity of several deadenylation/decapping/decay complexes and
in the absence of TBPL2, we observed apparent stabilisation of a
significant number of transcripts, suggesting that in wild-type
oocytes TBPL2 is indirectly inhibiting the translation of mRNAs,
and/or inducing the degradation of the mRNAs, previously
transcribed by TFIID/TBP-driven Pol II and deposited in the
primordial follicular oocytes (Fig.
7
). To put in place the growing
oocyte-specific maternal transcriptome TBPL2 is controlling the
production of new mRNAs using a maternal-specific TSS
grammar, as most of these transcripts will remain in the oocyte
after transcriptional quiescence. Remarkably, as TBPL2 does not
interact with Pol I and Pol III transcription machineries in the
growing oocytes, this strongly suggest that rRNA and tRNA are
deposited very early during oogenesis in amounts sufficient for
the initiation of development.
Therefore, it seems that TBPL2 contributes to establish a novel
TBPL2-dependent growing oocyte transcriptome and consequent
proteome required for further development and oocyte
compe-tence for fertilisation (Fig.
7
). The indirect regulation of
pre-viously deposited mRNAs by a global transcription regulator
resembles the well-characterised maternal to zygotic transition
(MZT), during which clearance of inherited transcriptome is
mediated by de novo gene products generated by newly activated
transcription machinery (reviewed in ref.
59). At hundreds of gene
promoters, two distinct TSS-defining “grammars” coexist in close
proximity genome-wide and are differentially utilised either
by TBPL2/TFIIA in primary/secondary follicular oocytes, or by
TBP/TFIID in primordial follicular oocytes or in the fertilised
embryo. This again shows a striking parallel to MZT
23, where
multiple layers of information are embedded in the same
pro-moter sequence, each representing a different type of regulatory
grammar interpreted by dedicated transcription machinery
depending on the cellular environment.
Methods
Cell lines and cell culture. The NIH3T3-II10 line overexpressing TBPL2 and the control NIH3T3-K2 have already been described28and were maintained in high glucose DMEM supplemented with 10% of new-born calf serum at 37 °C in 5% CO2.
Whole-cell extracts. NIH3T3-II10 and NIH3T3-K2 cells cultured in 15-cm dish were washed twice with 1× PBS, subsequently harvested by scrapping on ice. Harvested cells were centrifuged 1000 × g at 4 °C for 5 min and then resuspended in one packed cell volume of whole-cell extraction buffer (20 mM Tris-HCl pH 7.5, 2 mM DTT, 20% glycerol, 400 mM KCl, 1× protease inhibitor cocktail (PIC, Roche)). Cell lysates were frozen in liquid nitrogen and thawed on ice three times, followed by centrifugation at 20,817 × g, at 4 °C for 15 min. The supernatant was collected, and protein concentration was measured by Bradford protein assay (Bio-Rad). The cell extracts were used directly for immunoprecipitation and western blot, or stored at −80 °C.
Ovaries collected from postnatal day 14 (P14) CD1 and C57BL/6N female mice were homogenised in whole-cell extraction buffer [20 mM Tris-HCl pH 7.5, 2 mM DTT, 20% glycerol, 400 mM KCl, 5× PIC (Roche)]. Cell lysates were frozen in liquid nitrogen and thawed on ice for three times, followed by centrifugation at 20,817 × g, at 4 °C for 15 min. The supernatant extracts were used directly for immunoprecipitation.
Antibodies and antibody purification. The antibodies are listed in Supplementary Table 1. The IGBMC antibody facility raised the anti-TBPL2 polyclonal 3024 serum against the CPDEHGSELNLNSNSSPDPQ peptide (amino acids 111–129) coupled to ovalbumin and injected into one 2-month-old female New-Zeland rabbit. The resulting serum was affinity purified by using the Sulfolink Coupling Gel (Pierce) following the manufacturer’s recommendations.
Immunoprecipitation. Ovary extract were incubated with anti-GST (10 µg per IP), anti-TBP (10 µg per IP), anti-TBPL2 (3024, 12 µg (36 µg for gel filtration) per IP), anti-TAF7 (10 µg per IP), or anti-TAF10 (10 µg per IP)-coated Dynabeads (Invi-trogen) at 4 °C overnight. After incubation, beads were washed 3 × 5 min at 4 °C with 500 mM KCl buffer [25 mM Tris-HCl (pH 7.9), 5 mM MgCl2, 10% glycerol,
0.1% NP40, 2 mM DTT, 500 mM KCl and 1× PIC (Roche)], then washed 3 × 5 min at 4 °C with 100 mM KCl buffer (25 mM Tris-HCl pH 7.9, 5 mM MgCl2, 10% glycerol, 0.1% NP40, 2 mM DTT, 100 mM KCl and 1×). Immunoprecipitated TBP-driven
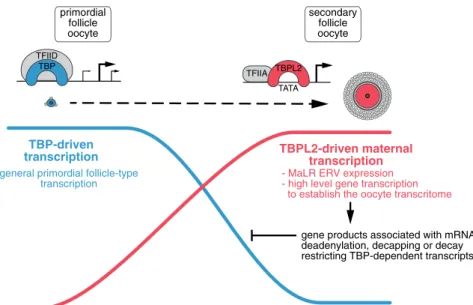
transcription TBPL2-driven maternaltranscription
- MaLR ERV expression - high level gene transcription to establish the oocyte transcritome
general primordial follicle-type transcription
gene products associated with mRNA deadenylation, decapping or decay restricting TBP-dependent transcripts TBP TFIID secondary follicle oocyte primordial follicle oocyte TFIIA TATA TBPL2
Fig. 7 Transcriptome overhaul controlled by TBPL2/TFIIA during oocyte growth. At the beginning of oocyte growth, the transcriptome in primordial and early primary follicles (blue cell) depends on TFIID/TBP (blue complex) transcription from broad promoters (blue line). As TBP protein disappears, Pol II transcription initiation is mediated (red line) only by the oocyte-specific TFIIA/TBPL2 complex (red complex) from sharp promoters. At the growing oocyte stage (red cell) TFIIA/TBPL2 complex is responsible for initiating high levels of Pol II transcription, such as mammalian apparent LTR retrotransposons (MaLR) endogenous retroviral elements (ERV) expression and also the expression of genes of which the gene products survey/limit the stability and/or translatability of transcripts previously deposited by TFIID/TBP-dependent Pol II transcription.
proteins were eluted with 0.1 M glycine pH 2.8 and neutralised with 1.5 M Tris-HCl pH 8.8.
Immunoprecipitation performed from whole-cell extracts of NIH3T3-II10 and NIH3T3-K2 cells were following the same procedures with protein G Sepharose beads (GE Healthcare): 18 µg of rabbit anti-TBPL2 (3024) and 15 µg anti-TBP per IP. Western blot analyses. Protein samples (15–25 µg of cell extracts or 15 µL of IP elution) were mixed with 1/4th volume of loading buffer (100 mM Tris-HCl pH 6.8, 30% glycerol, 4% SDS, 0.2% bromophenol blue and freshly added 100 mM DTT) and boiled for 10 min. Samples were then resolved on a 10% SDS-PAGE and transferred to a nitrocellulose membrane (Protran, Amersham). Membranes were blocked in 3% non-fat milk in 1× PBS at room temperature (RT) for 30 min, and subsequently incubated with the primary antibody overnight at 4 °C (dilution 1/ 1000). Membranes were washed three times (10 min each) with 1× PBS—0.05% Tween-20. Membranes were then incubated with HRP-coupled goat anti-mouse Ig (Jackson ImmunoResearch, #115-036-071, dilution 1/10,000) or HRP-coupled goat anti-rabbit Ig (Jackson ImmunoResearch, #115-035-144, dilution 1/10,000) for 1 h at RT, followed by ECL detection (Thermo Fisher). The signal was acquired with the ChemiDoc imaging system (Bio-Rad).
Mass spectrometry analyzes and NSAF calculations. Samples were TCA pre-cipitated, reduced, alkylated, and digested with LysC and Trypsin at 37 °C over-night. After C18 desalting, samples were analysed using an Ultimate 3000 nano-RSLC (Thermo Scientific, San Jose, CA) coupled in line with a linear trap Quad-rupole (LTQ)-Orbitrap ELITE mass spectrometer via a nano-electrospray ionisa-tion source (Thermo Scientific). Peptide mixtures were loaded on a C18 Acclaim PepMap100 trap column (75-μm inner diameter × 2 cm, 3 μm, 100 Å; Thermo Fisher Scientific) for 3.5 min at 5 μL/min with 2% acetonitrile (ACN), 0.1% formic acid in H2O and then separated on a C18 Accucore nano-column (75-μm inner
diameter × 50 cm, 2.6 μm, 150 Å; Thermo Fisher Scientific) with a 240-min linear gradient from 5% to 50% buffer B (A: 0.1% FA in H2O/B: 80% ACN, 0.08% FA in
H2O) followed with 10 min at 99% B. The total duration was set to 280 min at a
flow rate of 200 nL/min.
Proteins were identified by database searching using SequestHT with Proteome Discoverer 1.4 software (Thermo Fisher Scientific) a combined Mus musculus database generated using Uniprot [https://www.uniprot.org/uniprot/? query=proteome:UP000000589&sort=score] (Swissprot, release 2015_11, 16730 entries) where five interesting proteins sequences (TrEMBL entries: TAF4, ATXN7L2, TADA2B, BTAF1 and SUPT3) were added. Precursor and fragment mass tolerances were set at 7 ppm and 0.5 Da, respectively, and up to two missed cleavages were allowed. Oxidation (M) was set as variable modification and Carbamidomethylation©as fixed modification. Peptides were filtered with a false
discovery rate (FDR) at 5%, rank 1 and proteins were identified with one unique peptide. Normalised spectral abundance factor (NSAF)31were calculated using custom R scripts (R software version 3.5.3). Only proteins detected in at least two out of three of the technical or biological replicates were considered for further analyses.
Gel filtration. A Superose 6 (10/300) column was equilibrated with buffer con-sisting of 25 mM Tris-HCl pH 7.9, 5 mM MgCl2, 150 mM KCl, 5% Glycerol, 1 mM
DTT and 1× PIC (Roche). Five hundred μL of whole-cell extracts containing∼5 mg of protein were injected in an ÄKTA avant chromatography system (Cytiva) and run at 0.4 mL/min. Protein detection was performed by absorbance at 280 nm and 260 nm. Five hundred μL fractions were collected and analysed by western blot and IP-MS.
Animal experimentation. Animal experimentations were carried out according to animal welfare regulations and guidelines of the French Ministry of Agriculture, and procedures were approved by the French Ministry for Higher Education and Research ethical committee C2EA-17 (project n°2018031209153651). The Tg(Zp3-Cre), Taf7floxand Tbpl2-mouse lines have already been described16,33,60.
Histology analyses of ovaries. Ovaries were collected from 6-week-old Tg(Zp3-Cre/+);Taf7flox/+and Tg(Zp3-Cre/+);Taf7flox/∆oocyte-specific mutant females,
fixed in 4% paraformaldehyde (Electron Microscopy Sciences) overnight at 4 °C, washed three times in PBS at room temperature and embedded in paraffin. Five micrometre-thick sections were stained with haematoxylin and eosin, and images were acquired using a slide scanner Nanozoomer 2.0HT (Hamamatsu Photonics). Immunolocalization of TAF7 in the oocytes. Ovaries were dissected in PBS, fixed overnight in 4% PFA/PBS at 4 °C, rinsed three times in PBS, equilibrated in 30% sucrose/PBS, and embedded in Cryomatrix (Thermo Scientific) in liquid nitrogen vapour. Fifteen micrometre-thick sections were obtained on a Leica cryostat and stored at −80 °C. Sections were rehydrated in TBS (50 mM Tris, 150 mM NaCl, pH 7.5), and permeabilized with 0.5% Triton-X-100 (Sigma) and rinsed twice again in TBS before blocking in 3% BSA, 1% goat serum, 0.1% Tween-20 (Sigma). Immunolabeling was then performed using M.O.M®Immunodetection Kit, Basic
(Vector Laboratories, BMK-2202). Purified anti-TAF7 rabbit polyclonal antibody
(dilution 1/300) was revealed using an Alexa Fluor 488 goat anti-rabbit IgG (Invitrogen #A-11108, dilution 1/1000). Sections were counterstained with DAPI (4′,6-diamidino-2-phenylindole dihydrochloride; Molecular Probes). Pictures were taken using a TCS SP5 Inverted confocal (Leica) with a ×40 Plan APO objective (CX PL APO 40x/1.25-0.75 OIL CS) and analysed using Fiji 2.0.
Superovulation. Five units of pregnant mare serum (PMS) was injected intra-peritoneally in 4-week-old female mice between 2 and 4 pm. After 44–46 h, GV oocytes were collected from the ovaries by puncturing with needles.
Oocytes collection. After dissection, ovaries were freed from adhering tissues in 1× PBS. Series of six ovaries were digested in 500 µL of 2 mg/mL Collagenase (SIGMA), 0.025% trypsin (SIGMA) and 0.5 mg/mL type IV-S hyaluronidase (SIGMA), on a ThermoMixer (Eppendorf) with gentle agitation for 20 min. The digestion was then stopped by the addition of 1 mL of 37 °C pre-warmed αMEM −5% FBS. The oocytes were then size-selected under a binocular.
RNA preparation. Pool of 100–200 oocytes collected were washed through several M2 drops, and total RNA was isolated using NucleoSpin RNAXS kit (Macherey-Nagel) according to the user manual. RNA quality and quantity were evaluated using a Bioanalyzer. Between 5 and 10 ng of RNA was obtained from each pool of oocytes.
RNA-seq analyses. PolyA+ RNA-seq libraries were prepared using the SMART-Seq v4 UltraLow Input RNA kit (Clonetch) followed by the Nextera XT DNA library Prep kit (Illumina) according to the manufacturer recommendations from three biological replicates for each condition (P7 wild-type (WT), P7 Tbpl2−/− mutant, P14 WT and P14 Tbpl2−/−mutant oocytes) and sequenced 50 pb single
end using an Illumina HiSeq 4000 (GenomEast platform, IGBMC).
Reads were preprocessed in order to remove the adapter, poly(A) and low-quality sequences (Phred low-quality score below 20). After this preprocessing, reads shorter than 40 bases were discarded for further analysis. These preprocessing steps were performed using cutadapt version 1.1061. Reads were mapped to spike sequences using bowtie version 2.2.862, and reads mapping to spike sequences were removed for further analysis. Reads were then mapped onto the mm10 assembly of Mus musculus genome using STAR version 2.7.0f63. Gene expression quantification was performed from uniquely aligned reads using htseq-count version 0.9.164, with annotations from Ensembl version 96 and “union” mode. Read counts were normalised across samples with the median-of-ratios method to make these counts comparable between samples, and differential gene analysis was performed using the DESeq2 version 1.22.265. All the figures were generated using R software version 3.5.3.
RT-qPCR. Complementary DNA was prepared using random hexamer oligonu-cleotides and SuperScript IV Reverse Transcriptase (Invitrogen) and amplified using LightCycler®480 SYBR Green I Master (Roche) on a LightCycler®480 II
(Roche). Primers used for qPCR analysis are listed in Supplementary Table 2. Repeat element analyses. Data were processed as already described66using Bowtie1 (version 1.2.2)67instead of Maq. The repeatMasker annotation was used to identify the different types of repeat elements (Smit, AFA, Hubley, R & Green, P. RepeatMasker Open-4.0. 2013-2015http://www.repeatmasker.org). Differential expression analyses were performed using DESeq2 (version 1.22.2)65. All the fig-ures were generated using R custom scripts (version 3.5.3).
SLIC-CAGE analyses. Twenty-eight and 13 ng of total RNA isolated from P14 oocytes (biological replicate 1 and replicate 2, ~500–1000 oocytes pooled for each replicate) and 15 ng of the total RNA isolated from P14 Tbpl2−/−mutant oocytes
(approximately 550 pooled oocytes) were used for SLIC-CAGE TSS mapping43. Briefly, 5 µg of the carrier RNA mix were added to each sample prior to reverse transcription, followed by the cap-trapping steps designed to isolate capped RNA polymerase II transcripts. The carrier was degraded from the final library prior to sequencing using homing endonucleases. The target library derived from the oocyte RNA polymerase II transcripts was PCR-amplified (15 cycles for P14 WT, 16 cycles for P14 Tbpl2−/−mutant) and purified using AMPure beads (Beckman
Coulter) to remove short PCR artifacts (<200 bp, size selection using 0.8× AMPure beads to sample ratio). The libraries were sequenced using HiSeq2500 Illumina platform in single-end, 50 bp mode (Genomics Facility, MRC, LMS).
Sequenced SLIC-CAGE reads were mapped to the reference M. musculus genome (mm10 assembly) using Bowtie262with parameters that allow zero mismatches per seed sequence (22 nucleotides). Uniquely mapped reads were kept for downstream analyses using CAGEr Bioconductor package (version 1.20.0)68 and custom R/Bioconductor scripts. Bam files were imported into R using the CAGEr package, where the mismatching additional G, if added through the template-free activity of the reverse transcriptase, was removed. Same samples sequenced on different lanes and biological replicates were merged prior to final analyses.