HAL Id: hal-01830278
https://hal.umontpellier.fr/hal-01830278
Submitted on 4 Jul 2018
HAL is a multi-disciplinary open access
archive for the deposit and dissemination of
sci-entific research documents, whether they are
pub-lished or not. The documents may come from
teaching and research institutions in France or
abroad, or from public or private research centers.
L’archive ouverte pluridisciplinaire HAL, est
destinée au dépôt et à la diffusion de documents
scientifiques de niveau recherche, publiés ou non,
émanant des établissements d’enseignement et de
recherche français ou étrangers, des laboratoires
publics ou privés.
Are right- and left-handedness relevant as general
categories in a non-industrialized country?
Winati Nurhayu, Sarah Nila, Michel Raymond, Bambang Suryobroto
To cite this version:
Winati Nurhayu, Sarah Nila, Michel Raymond, Bambang Suryobroto. Are right- and left-handedness
relevant as general categories in a non-industrialized country?. Acta ethologica, Springer Verlag, 2018,
21 (1), pp.21-28. �10.1007/s10211-017-0279-y�. �hal-01830278�
Published in: Acta Ethologica, 21:21-28. (doi.org/10.1007/s10211-017-0279-y )
Are right- and left-handedness relevant as general
categories in a non-industrialized country?
Winati Nurhayu
a, Sarah Nila
a, Michel Raymond
b, Bambang Suryobroto
aa. Department of Biology, Faculty of Mathematics and Natural Sciences, Bogor Agricultural
University, Indonesia.
b. Institute of Evolutionary Sciences (ISEM), CNRS, University of Montpellier, IRD, EPHE,
Montpellier, France.
Running head: Handedness in a non-industrialized country
5
10
15
Abstract
Whether right- and left-handedness are defined as a function of individual tasks or represent general
categories across tasks has been long debated. However, the literature on handedness primarily
concerns industrialized societies in which manual work has been extensively automated, and the
majority of individuals in those countries do not use their arms and hands intensively for highly
specialized tasks on an everyday basis. Thus, the question remains whether results from those
countries regarding handedness are transferable to countries where the majority of individuals are
still exploiting their lateralized skills. Here, we sampled 506 individuals from 143 locations on the
islands of Flores and Adonara, Indonesia, to assess their hand preference for and hand performance
on several tasks in order to evaluate, in a non-industrialized country, the level of manual
specialization and the relevance of right- or left-handedness as general categories.
Generalized-declared handedness was consistent with task-Generalized-declared handedness across 10 specific tasks and
with a measure of strength and a measure of skilfulness, suggesting that general handedness is a
valid concept. This hand specialization for tasks is discussed in the context of intense and daily tool
use in this agricultural society.
Introduction
Manual specialization, when the same hand is used for different unimanual tasks, describes
handedness at the individual level (Marchant & McGrew, 2013). When manual specialization
extends to most tasks, an individual is either right- or left-handed, and a generalized handedness is a
meaningful concept. When an individual uses one hand for a task and the other hand for another
task (referred to as ambidexterity across tasks, or ambilaterality), the concept of generalized
handedness weakens. There is an abundance of literature concerning handedness in contemporary
25
30
35
40
humans (McManus, 1996; Llaurens, Raymond, & Faurie, 2009), and two contrasting results are
emerging.
First, there are no two clear categories such as left- and right-handers: for a given manual
action, each individual shows a preference for the use of one hand, and it is not always the same
hand for two different actions (Salmaso & Longoni, 1985). This suggests that right- or left-handers
are not general categories, but rather are defined as a function of the tasks. This justifies the use of
continuous index across various tasks to quantitatively measure handedness, such as the classical
Edinburgh Handedness Inventory (Oldfield, 1971). However, much of the research is concerned
primarily with industrialized populations (Marchant, McGrew, & EiblEibesfeldt, 1995; Cavanagh,
Berbesque, Wood, & Marlowe, 2016). This is a pivotal point, as manual work, particularly in
agriculture, has been extensively automated in industrialized countries. There are still some specific
professional activities requiring high manual specialization, such as surgery, butchery,
stone-masonry, hairdressing, some sports, and others. However, the majority of individuals in those
countries, comparatively to non-industrialized countries, are probably not using their arms and
hands intensively on highly specialized tasks on an everyday basis (usage of keys, mouse, comb,
airdryer, phone etc. does not require a very high and intense manual specialization). This general
decrease of specialized and demanding manual tasks in the daily life of modern societies probably
explains the secular decline of handgrip strength, and more generally of muscular strength
components, observed during the last century in e.g. US, Canada, Denmark, and Spain (Malina,
2004; Silverman, 2011; Moliner-Urdiales et al. 2010).
Second, when the tasks considered are highly skilled and complex, and the individuals
tested are specialized in these tasks, there is a very strong correlation between the different tasks
(Bryden, 1977; Wood & Aggleton, 1989; Marchant & McGrew, 1998), suggesting right- and
left-handedness are useful categories in this context. Interestingly, when asked whether they consider
themselves right- or left-handed, many people from western countries respond according to the
50
55
60
65
hand they use to write, as writing and related activities are probably now the most common
uni-manual task considered as skilled and complex.
Thus the question remains on the level of hand specialisation in non-industrial countries. If
mechanisation, by massively decreasing the need for intense manual work, has decreased manual
specialisation, then a higher level of hand specialisation is expected on those countries not affected
by the process of extended mechanisation. On the opposite, if mechanisation does not affect the
level of hand specialisation, no difference are expected when comparing industrialised and
industrialized countries. Comparison with studies measuring handedness in traditional or
non-industrialized society is not straightforward, as the various measures of handedness developed in
modern countries are not always useful for a cross cultural analysis. Questionnaires are often
unsuitable (such as the classical Edinburgh Handedness Inventory which considers non-universal
tasks such as tooth-brushing, holding a golf club, or using a broom, see Oldfield (1971)), unreliable
as indicators, and/or biased toward Western cultural frameworks (Marchant, McGrew, &
EiblEibesfeldt, 1995; Steele & Uomini, 2005; Cochet & Byrne, 2013). Additionally, to our
knowledge, only seven publications on handedness from traditional populations have been
published (excluding studies focused on subadults), corresponding to 12 studies on 11 populations
(Table 1). Manual specialization could not be evaluated in these populations, because only one task
was studied (5 cases), or individual data for more than one task were either not recorded or not
reported (6 cases). The only remaining study (
Connolly & Bishop, 1992)
, performed in the Western
Highlands of Papua New Guinea, used solicited performance from people seated on the ground in
the focal centre in the villages, thus in the presence of a social audience (plus a foreign scientist),
thus introducing social interferences, as described in the authors: “there was a certain shyness and
reluctance made all the more significant by the inevitable crowd of spectators who were almost
always in attendance. The spectators were invariably jolly, laughing and joking amongst themselves
about the activities and the person performing the tests. One very striking feature was the dramatic
75
80
85
90
change in demeanour when a spectator was persuaded to become a subject; the laughing and
interactions with others stopped and an air of focused concentration took over”. In addition, the
solicited task performance included manipulation of unknown items, such matches, pencils, spoon,
playing cards, etc., thus questioning the ecological validity of the data (Cochet & Byrne, 2013). In
conclusion, to our knowledge, there are no sufficient published data from which to evaluate the
level of manual specialization (within subjects, across tasks) in non-industrialized societies. Thus,
the question remains regarding whether the results for handedness from industrialized countries are
transferable to populations where the majority of individuals are still exploiting their lateralized
skills.
Here, we sampled individuals born on the island of Flores, Indonesia, to assess their hand
preference for or hand performance on several tasks to evaluate, in a non-industrialized country, the
level of manual specialization and the relevance of right- or left-handedness as general categories.
Materials and Methods
Participants
The study was performed in January 2015 and January 2016 on the island of Flores (and
the small and adjacent island of Adonara), Indonesia. A total of 143 locations were sampled from
most of the regencies (Kabupaten) on the islands. Locally, groups of at least 3 individuals were
targeted, often resulting in a larger sample due an unavoidable social snowballing effects. Most of
the time the people in groups outside homes were males, and the social snowbowling effect
concerned mainly males, resulting in a male biased sample. Sampling was performed independently
to the proportion of left-hander, although the snowballing effect resulted in a higher proportion of
left-handers (left-handers neighbours were sometimes solicited by participants as soon as the
purpose of the study was disclosed). These non-randomly sampled participants were kept in the
final sample, as no population-level inferences were sought. At the beginning of each interview, the
100
105
110
115
participants were informed of the general aim of the study, the type of data collected and that the
data would only be used anonymously for a scientific purpose. A written voluntary agreement was
obtained prior data collection. The interviews were conducted in the Bahasa Indonesia language in
the presence of one Indonesian researcher. No financial incentive was provided.
Handedness measures
We designated interviewed subjects as focal respondents. They were asked whether they
were overall left- or right-handed. These focal individuals also provided hand preference
information for their close kin and other family members (reported elsewhere). Next they were
asked about their specific hand preference (right, left, both) for ten tasks based on Rife (1940): ball
throwing, racquet holding during badminton (a popular game in Indonesia), the use of three distinct
large tools (knife/machete, hammer, saw), marble play, writing, and the use of three distinct small
tools (spoon, scissors, needle). According to the anatomical and functional analysis by Napier
(1956), these tasks are further classified as requiring either a power grip (the object is held as if in a
clamp between the flexed fingers and the palm, and counter pressure is applied by the thumb lying
more or less in the plane of the palm), corresponding to the first five tasks, or precision grip (the
object is pinched between the flexor aspects of the fingers and that of the opposing thumb),
corresponding to last five tasks. As handedness measured from questionnaires are known to be not
fully correlated with performance (e.g. Raczkowski, Kalat, & Nebes, 1974; Cavill & Bryden, 2003),
behavioural cross-validation was sought and two measures of hand performance were recorded. The
writing-declared handedness was cross-checked by recording the hand used to sign the voluntary
agreement sheet: in all cases recorded (N = 324), an exact concordance with writing-declared
handedness was observed. Handedness could sometime be observed during an unsolicited
behaviour (e.g., after the interview an individual resumed his manual work using a tool): in all cases
(N = 14), an exact concordance with the declared handedness for the corresponding action was
observed. Hand-grip strength was measured using a hand dynamometre “Grip–D”, T.K.K 5401
125
130
135
140
series (Takei Scientific Instrument, Niigata, Japan). The mean of four consecutive grips was
recorded for each hand (G
Rand G
L), and the relative hand difference was computed as (G
R-G
L)/
(G
R+G
L). Which hand (R or L) was used as the starting hand for this measure was recorded as a
potential confounding variable. Hand skill was measured using a peg-moving task. The respondents
were asked to move the pegs with tweezers, along a line of holes, from the first hole to the next hole
one by one until the pegs were moved to the last hole (five steps for each line, three lines
concerned, see Figure S1). This movement was performed with one hand and was repeated 3 times
for each hand, alternating between hands. The mean of three trials was computed for each hand (S
Rand S
L), and the relative hand difference was computed as (S
R-S
L)/(S
R+S
L). The starting hand was
also recorded.
Statistical analyses
The influence of sex and age on handedness was evaluated using logistic regression. The
Influence of sex, handedness, their interaction, and confounding variables (age, starting hand of the
measure) on relative handgrip or relative hand skill was evaluated using linear regression. The
concordance of handedness over the tasks was measured and tested using Fleiss’s Kappa for
categorical data (Fleiss, 1971), via the R package irr. The ability of each handedness variable, or of
a group of handedness variables, to correctly assign the generalized-declared handedness of an
individual was evaluated using linear discriminant analysis. The R package MASS (version 7.3-44)
was used, with the option leave-one-out cross-validation, for the results (classes and posterior
probabilities). The resulting percentage of correct classification was compared to the percentage
obtained under random assignment, i.e. the percentage of the most frequent handedness class (RH,
79.2%). Exact confidence intervals of binomial proportions were computed using the R package
binom (version 1.1-1). All analyses were performed using R version 3.3.0.
Results
150
155
160
165
170
Sample description
A total of 506 individuals were directly interviewed (focal), corresponding to 145 females
and 361 males. Individuals (N = 26) not born on Flores or Adonara were removed from the sample,
resulting in a final sample of 480 focal individuals (Table S1): 135 females and 345 males. For the
age distribution (from 13.3 to 76.4 years old), the mean was 37.3 years (34.8 years for women and
38.4 years for men), the median was 36.0 years (33.6 years for women and 37.3 years for men) and
the standard deviation was 13.7 years (13.1 for women and 13.8 for men).
Declared hand preference
A total of 478 individuals declared their general handedness: 101 left-handed (31 females
and 70 males) and 377 right-handed (104 females and 273 males), resulting in an overall sample
frequency of 21.1% left-handers, see Table 2 (no population inference was possible, due to an
over-sampling of left-handers). Generalized-declared handedness was used as a response variable in a
binomial regression to assess the influence of sex and age. The males and females did not differ
significantly (P = 0.82) for the declared hand preferred. Generalized-declared right-handedness was
significantly (P = 0.0082) associated with older age, with a 0.024 increase of linear unit (i.e., log of
odd ratio) for each additional year.
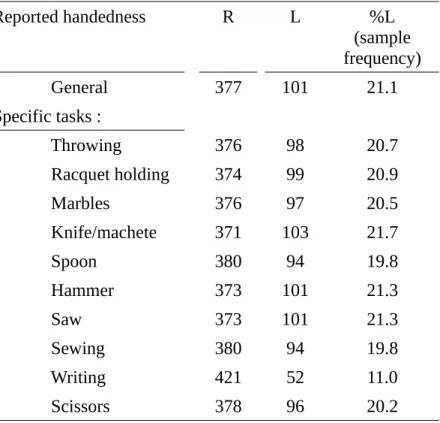
A total of 480 individuals declared their handedness for up to 10 tasks, resulting in a total
of 4,737 reports. From these reports, 15 (or 0.32%) were declared as ambidextrous. For any given
task, the frequency of ambidextrous reports was between 0 (for 4 tasks) and 0.8%. Due to their low
frequency, those ambidextrous reports were further coded as left-handed. Overall, the sample
percentage of task-declared left-handedness ranged from 11.0% to 21.7% (Table 2). A total of 472
individuals reported their hand preference for all ten tasks. Concordance over the 10 tasks was
significant (Fleiss’s Kappa = 0.884, z = 129, P < 10
-4), and was even stronger when writing
handedness, which is prone to cultural influences, was omitted (Fleiss’s Kappa = 0.935, z = 122, P
< 10
-4). Generalized-declared handedness was significantly correlated with each of the 10
tasks-175
180
185
190
declared handedness (with writing handedness: r = 0.68, P < 10
-10; with all others: r ≥ 0.93, P < 10
-10
).
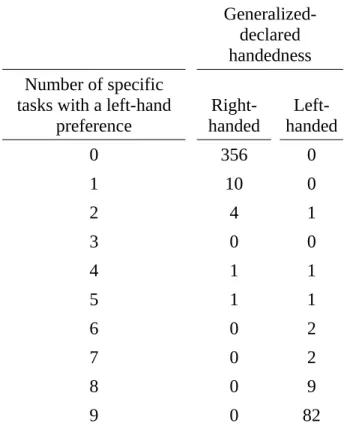
To assess the link between general and task-specific handedness, the number of individuals
reporting a left hand preference for a given number of specific tasks was computed for both general
right- and left-handedness (Table 3). Independence between general and specific hand preference
was significantly rejected (Fisher exact test on a contingency table, P < 10
-10). Only 49 individuals
(or 10.4%) declared a left-handed preference for all the specific tasks and general left-handedness.
However, when writing handedness was removed, this number rose to 82 (or 17.4%). Overall, 32
individuals (6.8%) declared a hand preference for at least one specific task (writing excluded) that
was different from their generalized-declared handedness. The figure dropped to 13 individuals
(2.8%) when this discrepancy occurred for at least two specific tasks, and it dropped to 7
individuals (1.5%) for at least three specific tasks. Only 2 individuals (0.4%) declared an equal
number of right and left preferences across the specific tasks: one declared general right-handedness
and the other declared general left-handedness. If a (arbitrary) criterion of concordant laterality for
at least seven of the specific tasks is used to assign handedness, then generalized-declared
handedness is consistent with assigned handedness for 98.5% (or 463/470) of the cases,
corresponding to 99.5% (370/372) right-handers and 94.9% (93/98) left-handers.
H
and performance
Relative hand grip (RHG) was computed for 469 individuals. RHG was not influenced by
age (P = 0.59) or whether individuals started using their preferred hand (P = 0.17). Sex,
generalized-declared handedness and the interaction between the two had a significant effect (P =
0.0023, 3.9x10
-7and 0.00078, respectively). For both sexes, individuals who declared a right-hand
preference had higher hand-grip strength for the right hand (Figure 1). Individuals who declared a
left-hand preference had higher hand-grip strength for the left hand, although this was significant
only for males (Figure 1).
200
205
210
215
Relative hand skill (RHS) was computed for 457 individuals. RHS was not influenced by
age (P = 0.15), sex (P = 0.68), or by the interaction between generalized-declared handedness and
sex (P = 0.26). The starting hand had an effect for right handers (RHS was lower when individuals
started the peg-moving test using their non-preferred hand, P = 1.8x10
-5) but not for left-handers (P
= 0.69). The participants were significantly (P = 1.9x10
-11) faster on the peg-moving task with their
preferred hand than with their non-preferred hand (Figure 2).
RHG and RHS were negatively correlated (Pearson's correlation = -0.32, t = -7.2, df = 451,
P = 2.1
x10
-12), thus low values of RHS (skilled right handers) are associated with high values of
RHG (strengthful right handers).
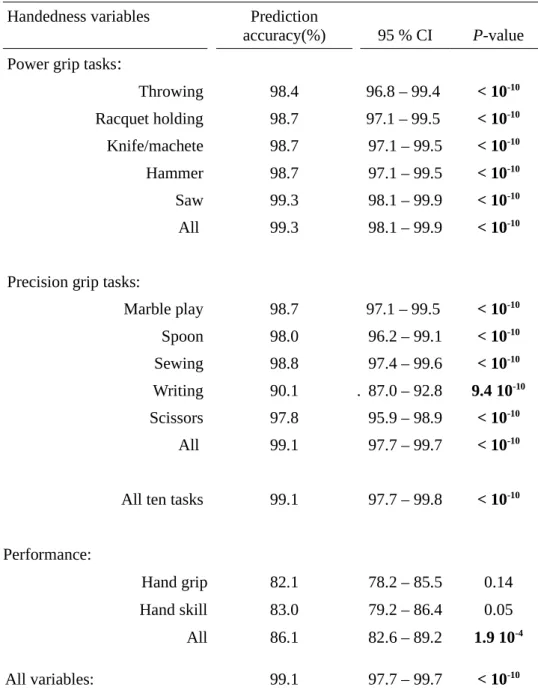
Predicting generalized handedness from specific tasks
Each of the 10 specific hand-preference variables was evaluated for its ability to predict
declared-generalized handedness above chance level (Table 4). Each of the variables was able to
predict at least 97.8% of generalized-declared handedness. The only exception was writing
handedness, which predicted only 90.1% of the cases. Taken simultaneously, these 10 specific
handedness variables significantly (P < 10
-10) predicted the general handedness above chance level.
Distinguishing tasks requiring either a power grip or a precision grip did not significantly improve
prediction accuracy. The same procedure was applied for the two measures of relative hand
performance (hand grip and hand skill). Neither was able to predict handedness above chance level
(Table 4). Taken simultaneously, the 2 performance variables predicted generalized-declared
handedness significantly above chance level, although 13.9% individuals were incorrectly assigned.
When all the handedness variables (the 10 specific handedness variables, hand grip and hand skill)
were considered simultaneously, 99.1% of the individuals were correctly assigned. There were 4
individuals incorrectly assigned (or 0.9%).
Discussion
225
230
235
240
245
Handedness is usually viewed from three different aspects: (a) the relative preference for
one hand in the execution of various unimanual tasks, (b) the greater skilfulness of one hand in the
performance of these tasks, or (c) the greater strength of one hand (Annett, 1970; Chau, Petry,
Bourgkard, Huguenin, Remy, & Andre, 1997; Peters, 1998). These aspects are not exclusive, as
higher skilfulness or higher strength explain relative preference, and vice-versa. In the present
sample, declared-generalized handedness was overall consistent with task-declared handedness
across 10 specific tasks for each individual, and with a measure of strength and a measure of
skilfulness, suggesting that general handedness seems to be a valid concept in this population.
When a participant declared their general handedness, right or left, this meant that most
daily lateralized tasks were performed with the declared hand. The 10 tasks used were all familiar to
the population sampled. Most of them are farmers and use a knife, machete, saw, and hammer
frequently; many of the women on Flores are weavers and are familiar with sewing and the use of
scissors. Writing is common because education until elementary school is compulsory. In a
traditional society based on agriculture, heavy daily tool use is common for both sexes. In addition,
as the market economy is limited on Flores, many items such as fishing boats, fences, beams,
floorboards, handles, and others are still self-made. During the interviews in the villages, we came
across several individuals using a tool (machete, axe, saw, needle, knife, spoon, etc.) while working,
cooking or playing. Even though a precise quantification remains to be done, hand specialization is
probably an adaptation for this intense and daily tool use, generating a general manual handedness.
Additionally, some tasks are probably functionally redundant: it seems logical that if one hand is
specialized for cutting, the same hand will also be specialized for sawing. This is because some
features, such as muscle strength and mass, developed for a particular specialization could also be
mobilized for other similar tasks (Gritsenko, Hardesty, Boots, & Yakovenko, 2016). This process
may explain why the frequent performance of several different unimanual tasks generates a general
hand specialization.
250
255
260
265
270
Handedness for the ten tasks was measured using self-reporting, rather than observing
hand-use. Observation of unsolicited hand usage is not frequently reported, and generally
corresponds to analysis of ethnographic video footages, providing a low sample size (G/wi, Hadza,
Himba and Yonamamö, Table 1). Observation of solicited behaviours is also reported (Jimi valley
and Eipo, Table 1), although an ecological validation is required, particularly when the solicited
behaviour introduces social interferences, as it is often the case in traditional settings. In
industrialized countries, questionnaire and performance-based measures of preference on adults are
correlated (e.g. agreement of 98% for throwing, Raczkowski, Kalat, & Nebes, 1974) and test-retest
questionnaires on e.g. throwing and hammering handedness have produced 100% concordant
responses (Coren & Porac, 1978). Here, whenever the validity of self-reporting was evaluated by
the observation of unsolicited lateralized tasks, observed handedness was 100% consistent.
Similarly, declared-generalized handedness was fully concordant with observed handedness in
Bobodioulasso area, Burkina Faso (Faurie, Schiefenhoevel, leBomin, Billiard, & Raymond, 2005).
Apparently, one’s own handedness is confidently known, suggesting that biases are minimal for
handedness information collected through self-declarations.
Hand-grip strength is known to decrease with age and to be higher in men than in women
(Innes, 1999). Interestingly, relative hand grip strength is independent of age and is thus a useful
comparative measure of handedness. On Flores, the right-handed participants of both sexes had
higher hand-grip strength for the right hand (RHG >1, Figure 1). This result seems robust, as it has
been reported for other Asian populations (e.g. Singapore: Incel, Ceceli, Durukan, Erdem, &
Yorgancioglu, 2002) and western countries (e.g. Germany, Greece, Switzerland: Günther, Bürger,
Rickert, Crispin, & Schulz, 2008; Mitsionis, Pakos, Stafilas, Paschos, Papakostas, & Beris, 2009;
Werle, Goldhahn, Drerup, Simmen, Sprott, & Herren, 2009). The converse was true for the
left-handers, who displayed a higher hand-grip strength for the left hand (RHG <1, Figure 1) for both
sexes, although the effect for females was smaller. Hand skill, as measured by a peg-moving task, is
275
280
285
290
known to be influenced by age and sex (Grice, Vogel, Le, Mitchell, Muniz, & Vollmer, 2003;
Mathiowetz, Kashman, Volland, Weber, & Dowe, 1985). Here, however, relative hand skill was
independent of age and sex and is thus a useful comparative measure of hand skill. When the
participants used their preferred hand, they were faster than when they used their non-preferred
hand (RHS < 1 for right-handers, and RHS > 1 for left-handers, Figure 2).
The twelve measures of handedness (10 tasks, RHG, and RHS) were overall consistent
with generalized-declared handedness (Table 4), suggesting that ambidexterity is reduced in this
population. True ambidexterity (being able to use both hands with equal ease for a specific
unimanual task) is uncommon, particularly when the task is specialized. For example, only one
ambidextrous pitcher (or hand-switcher) able to perform at a championship level has ever been
recorded during 110 years of history of baseball, despite such strategy to have a higher payoff than
either only right or left pitchers (Goldstein & Young, 1996). Similarly, only 1.5% ambidextrous
writers have been recorded from a sample of 1,355 individuals from New Zealand (Corballis,
Hattie, & Fletcher, 2008). In this sample from Flores and Adonara, true ambidexterity was also
uncommon: for any given task, its frequency was lower than 0.9%. This low frequency of
ambidexterity is consistent with hand specialization in a context of frequent tool usage in order to
increase precision and efficiency. Precision is essential when potentially dangerous tools are used,
such as a knife, machete, hammer, or saw, in order to reduce self-injury and bodily harm.
Ambidexterity across tasks, when an individual uses one hand for a task and the other hand for
another task, is more common (referred to as ambilaterality). When only two tasks are considered
(writing and throwing), 5.3% of men are mixed-handed according to a large sample (N > 300,000)
of American men aged 20-50 years old (Gilbert & Wysocki, 1992). When more tasks are
considered, as in the classical Edinburgh Inventory (10 tasks) and its variants (Edlin, Leppanen,
Fain, Hackländer, Hanaver-Torrez, & Lyle, 2015), this proportion is approximately 30-50%,
depending on the criteria used to define mixed-handedness (e.g., Oldfield, 1971; Dellatolas, Tubert,
300
305
310
315
Castresana, Mesbah, Giallonardo, Lazaratou, & Lellouch, 1991.; Millencovic & Dragovic, 2012).
The frequency of ambilaterality in this sample from Flores and Adonara is less than 1%,
corresponding to 4 individuals. This percentage cannot be considered a population estimate, as
some left-handers were non-randomly sampled in order to increase the frequency of left-handedness
for comparison purposes. Thus, considering that ambilateral people are probably declaring a left
preference more frequently than a right one, this percentage is therefore a maximum value for a
population estimate. No special characteristics seem to be associated with the four individuals who
did not have a clear general lateralization across tasks: all were farmers (except one whose
occupation was not recorded), they represented both sexes (three males and one female), they were
between 33 and 52 years old, and they lived in different villages.
The results of this study indicate that for Indonesian men and women from Flores and
Adonara, right- and left-handedness are meaningful categories. Thus, in these traditional
populations, generalized-declared handedness seems to be a valid and sufficient source of
information to identify handedness category as it was ascertained by handedness for various
specific tasks and relative hand performance and skill.
Acknowledgements
We are very grateful to Valérie Durand for bibliographic help and to the Program Magister Menuju
Doktor untuk Sarjana Unggul (PMDSU) 2015 for providing funding to BS. This is contribution
ISEM 2017-XXX of the Institute of Evolutionary Science of Montpellier.
References
Annett, M. 1970. A classification of hand preference by association analysis. British Journal of
Psychology, 61, 303-321. doi:10.1111/j.2044-8295.1970.tb01248.x
325
330
335
340
345
Bryden, M. P. 1977. Measuring handedness with questionnaires. Neuropsychologia, 15, 617-624.
doi:10.1016/0028-3932(77)90067-7
Chau, N., Petry, D., Bourgkard, E., Huguenin, P., Remy, E., & Andre, J. M. 1997. Comparison
between estimates of hand volume and hand strengths with sex and age with and without
anthropometric data in healthy working people. Eur J Epidemiol, 13, 309-316.
doi:10.1023/A:1007308719731
Cavanagh, T., Berbesque, J. C., Wood, B., & Marlowe, F. 2016. Hadza handedness: lateralized
behaviors in a contemporary hunter–gatherer population. Evolution and Human Behavior, 37,
202-209. doi:10.1016/j.evolhumbehav.2015.11.002
Cavill, S., & Bryden, P. 2003. Development of handedness: Comparison of questionnaire and
performance-based measures of preference. Brain and Cognition, 53, 149-151.
doi:10.1016/S0278-2626(03)00098-8
Cochet, H., & Byrne, R. W. 2013. Evolutionary origins of human handedness: evaluating
contrasting hypotheses. Animal cognition, 16, 531-542. doi:10.1007/s10071-013-0626-y
Connolly, K. J., & Bishop, D. V. M. 1992. The measurement of handedness: A cross-cultural
comparison of samples from England and Papua New Guinea. Neuropsychologia, 30, 13-26.
doi:10.1016/0028-3932(92)90010-J
Corballis, M.C., Hattie, J., & Fletcher, R. 2008. Handedness and intellectual achievement: An
even-handed
look.
Neuropsychologia,
46,
1,
374-378.
doi:
10.1016/j.neuropsychologia.2007.09.009
Coren, S., & Porac, C. 1978. The validity and reliability of self-report items for the measurement of
lateral preference. British Journal of Psychology, 69, 207-211. doi:
10.1111/j.2044-8295.1978.tb01649.x
Dellatolas, G., Tubert, P., Castresana, A., Mesbah, M., Giallonardo, T., Lazaratou, H., & Lellouch, J.
1991. Age and cohort effect in adult handedness. Neuropsychologia, 29, 225-261.
350
355
360
365
doi:10.1016/0028-3932(91)90086-N
Edlin, J. E., Leppanen, M. L., Fain, R. J., Hackländer, R. P., Hanaver-Torrez, S. D., & Lyle, K. B.
2015. On the use (and misuse?) of the Edinburgh Handedness Inventory. Brain and
Cognition, 94, 44-51. doi:10.1016/j.bandc.2015.01.003
Faurie, C., Schiefenhoevel, W., leBomin, S., Billiard, S., & Raymond, M. 2005. Variation in the
frequency of left‐handedness in traditional societies. Current Anthropology, 46, 142-147.
doi:10.1086/427101
Fleiss, J. L. 1971. Measuring nominal scale agreement among many raters. Psychological Bulletin,
76, 378-382. doi:10.1037/h0031619
Gilbert, A. N., & Wysocki, C. J. 1992. Hand preference and age in the United States.
Neuropsychologia, 30, 601-608. doi:10.1016/0028-3932(92)90065-T
Grice, K. O., Vogel, K. A., Le, V., Mitchell, A., Muniz, S., & Vollmer, M. A. 2003. Adult norms for
a commercially available Nine Hole Peg Test for finger dexterity. American Journal of
Occupational Therapy, 57, 570-573. doi:10.5014/ajot.57.5.570
Goldstein, S. R., & Young, C. A. 1996. “Evolutionary” stable strategy of handedness in major
league baseball. Journal of Comparative Psychology, 110, 164-169. doi:
10.1037/0735-7036.110.2.164
Gritsenko, V., Hardesty, R., Boots, M. T., Yakovenko, S. 2016. Biomechanical constraints
underlying motor primitives derived from the musculoskeletal anatomy of the human arm.
PLoS ONE, 11, 1-18. 18p. doi: 10.1371/journal.pone.0164050
Günther, C. M., Bürger, A., Rickert, M., Crispin, A., & Schulz, C. U. 2008. Grip strength in healthy
caucasian adults: reference values. The Journal of Hand Surgery, 33, 558-565.
doi:10.1016/j.jhsa.2008.01.008
Incel, N. A., Ceceli, E., Durukan, P. B., Erdem, H. R., & Yorgancioglu Z. R. 2002. Grip strength:
Effect of hand dominance. Singapore Medical Journal, 43, 234-237. Retrieved from:
375
380
385
390
http://www.ncbi.nlm.nih.gov/pubmed/12188074
Innes, E. 1999. Handgrip strength testing: A review of the literature. Australian Occupational
Therapy Journal, 46, 120-140. doi:0.1046/j.1440-1630.1999.00182.x
Llaurens, V., Raymond, M., & Faurie, C. 2009. Why are some people left-handed? An evolutionary
perspective
.
Phil. Trans. R. Soc. B, 364, 881–894. doi:10.1098/rstb.2008.0235
Malina, R.M. 2004. Secular trends in growth, maturation and physical performance: a review.
Anthropological
Review,
67,
3-31.
Retrieved
from:
http://anthro.amu.edu.pl/pdf/paar/vol067/01malina.pdf
Marchant, L. F. & McGrew, W. C. 1998. Human handedness: an ethological perspective. Hum.
Evol, 13, 221-228. doi:10.1007/BF02436506
Marchant, L. F., & McGrew, W. C. 2013. Handedness is more than laterality: lessons from
chimpanzees. Annals of the New York Academy of Sciences, 1288, 1-8.
doi:10.1111/nyas.12062
Marchant, L. F., McGrew, W. C., & Eibl-Eibesfeldt I. 1995. Is human handedness universal?
Ethological analyses from three traditional cultures. Ethology, 101, 239-258.
doi:10.1111/j.1439-0310.1995.tb00362.x
Mathiowetz, V., Kashman, N., Volland, G., Weber, K., & Dowe, M. 1985. A grip and pinch strength
normative data for adults. Archives of Physical Medicine and Rehabilitation, 66, 254-262.
Retrieved from:
http://bleng.com/media/wysiwyg/Mathiowetz_Grip_and_Pinch_Strength_Norms.pdf
McManus, I. C. 1996. Handedness. In The Blackwell dictionary of neuropsychlogy (eds J. G.
Beaumont, P. M. Kenealy & M. J. C. Rogers), pp. 367–376. Oxford, UK: Blackwell.
Millencovic, S., & Dragovic, M. 2012. Modification of the Edinburgh Handedness Inventory: A
replication study. Laterality, 18, 340-348. doi:10.1080/1357650X.2012.683196
Mitsionis, G., Pakos, E. E., Stafilas, K. S., Paschos, N., Papakostas, T,. & Beris, A. E. 2009.
400
405
410
415
Normative data on hand grip strength in a Greek adult population. International
Orthopaedics, 33, 713-717. doi:10.1007/s00264-008-0551-x
Moliner-Urdiales, D., Ruiz, J. R., Ortega, F. B., Jiménez-Pavón, D., Vicente-Rodriguez, G.,
Rey-López, J. P., … Moreno, L. A. (2010). Secular trends in health-related physical fitness in
Spanish adolescents: The AVENA and HELENA Studies. Journal of Science and Medicine in
Sport, 13, 584-588. https://doi.org/10.1016/j.jsams.2010.03.004
Napier, J. R. 1956. The prehensile movements of the human hand. The Journal of Bone and Joint
Surgery, 38, 902-913. Retrieved from:
http://www.bjj.boneandjoint.org.uk/content/jbjsbr/38B/4/902.full.pdf
Oldfield, R. C. 1971. The assessment and analysis of handedness: The Edinburgh Inventory.
Neuropsychologia, 9, 97-113. doi:10.1016/0028-3932(71)90067-4
Peters, M. 1998. Description and validation of a flexible and broadly usable handedness
questionnaire. Laterality, 1, 77-96. doi:10.1080/713754291
Raczkowski, D., Kalat, J. W., & Nebes, R. 1974. Reliability and validity of some handedness
questionnaire items. Neuropsychologia, 12, 43-47. doi:10.1016/0028-3932(74)90025-6
Rife, D. C. 1940. Handedness, with special reference to twins. Genetic, 25, 178-186. Retrieved
from: http://www.genetics.org/content/genetics/25/2/178.full.pdf
Salmaso, D., & Longoni, A. M. 1985. Problems in the assessment of hand preference. Cortex, 21,
533-549. doi:10.1016/S0010-9452(58)80003-9
Schaafsma, S. M., Geuze, R. H., Riedstra, B., Schiefenhövel, W., Bouma, A., & Groothuis, T .G. G.
2012. Handedness in a nonindustrial society challenges the fighting hypothesis as an
evolutionary explanation for left-handedness. Evolution and Human Behavior 33, 94-99.
doi:10.1016/j.evolhumbehav.2011.06.001
Silverman, I.W. 2011. The secular trend for grip strength in Canada and the United States. Journal
of Sports Sciences, 29, 599-606. doi: 10.1080/02640414.2010.547209
425
430
435
440
Steele, J., Uomini, N. 2005. Humans, tools, and handedness. In: Stone Knapping: The Necessary
Conditions for a Uniquely Hominin Behaviour (edited by V. Roux & B. Bril), pp. 217-239.
Cambridge: McDonald Institute for Archaeological Research.
Werle, S., Goldhahn J., Drerup, S., Simmen, B. R., Sprott, H., & Herren, B. 2009. Age- and
gender-specific normative data of grip and pinch strength in a healthy adult Swiss population. The
Journal of Hand Surgery, 34, 76-84. doi:10.1177/1753193408096763
Wood, C. J., & Aggleton, J. P. 1989. Handedness in ‘fast ball’ sports: Do lefthanders have an innate
advantage? British Journal of Psychology, 80, 227-240.
doi:10.1111/j.20448295.1989.tb02316.x
450
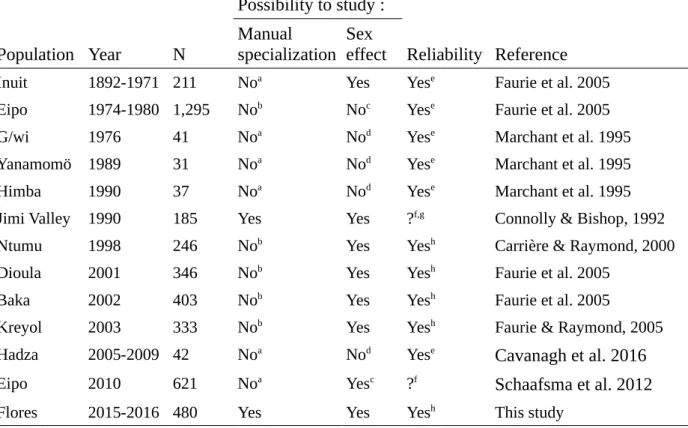
Table 1. Handedness studies from traditional populations. The year when the data was recorded
(Year), the sample size (N), whether or not manual specialization and a sex effect could be
studied, and an estimated reliability are shown.
Possibility to study :
Population Year
N
Manual
specialization
Sex
effect
Reliability Reference
Inuit
1892-1971 211
No
aYes
Yes
eFaurie et al. 2005
Eipo
1974-1980 1,295
No
bNo
cYes
eFaurie et al. 2005
G/wi
1976
41
No
aNo
dYes
eMarchant et al. 1995
Yanamomö 1989
31
No
aNo
dYes
eMarchant et al. 1995
Himba
1990
37
No
aNo
dYes
eMarchant et al. 1995
Jimi Valley 1990
185
Yes
Yes
?
f,gConnolly & Bishop, 1992
Ntumu
1998
246
No
bYes
Yes
hCarrière & Raymond, 2000
Dioula
2001
346
No
bYes
Yes
hFaurie et al. 2005
Baka
2002
403
No
bYes
Yes
hFaurie et al. 2005
Kreyol
2003
333
No
bYes
Yes
hFaurie & Raymond, 2005
Hadza
2005-2009 42
No
aNo
dYes
eCavanagh et al. 2016
Eipo
2010
621
No
aYes
c?
fSchaafsma et al. 2012
Flores
2015-2016 480
Yes
Yes
Yes
hThis study
a. Individual data for more than one task were not recorded or reported. b. Only one task was recorded. c.
Only one sex studied. d. Sample size too low. e. Individual laterality recorded from photos or movies
made for another purpose. f. Solicited behaviour with audience. g. Some tasks culturally meaningless. h.
Interviews partially cross-checked with spontaneous performance.
460
Table 2. Number of individuals reporting hand preference
for general handedness and for ten specific tasks.
Reported handedness
R
L
%L
(sample
frequency)
General
377
101
21.1
Specific tasks :
Throwing
376
98
20.7
Racquet holding
374
99
20.9
Marbles
376
97
20.5
Knife/machete
371
103
21.7
Spoon
380
94
19.8
Hammer
373
101
21.3
Saw
373
101
21.3
Sewing
380
94
19.8
Writing
421
52
11.0
Scissors
378
96
20.2
Table 3. Number of individuals reporting a
left-hand preference for specific tasks (writing
handedness excluded)
according to
generalized-declared handedness.
Generalized-declared
handedness
Number of specific
tasks with a left-hand
preference
Right-handed
Left-handed
0
356
0
1
10
0
2
4
1
3
0
0
4
1
1
5
1
1
6
0
2
7
0
2
8
0
9
9
0
82
470
475
Table 4. Accuracy of prediction of generalized-declared handedness for
each individual handedness variable and for different groupings. CI refers
to confidence interval. P-values refer to a two-sided exact binomial test of
departure from random assignment (baseline of 80.3%). Bold characters
indicate significant (P < 0.05/12 = 0.0042) values, taking into account
multiple testing.
Handedness variables
Prediction
accuracy(%)
95 % CI
P-value
Power grip tasks
:
Throwing
98.4
96.8 – 99.4
< 10
-10Racquet holding
98.7
97.1 – 99.5
< 10
-10Knife/machete
98.7
97.1 – 99.5
< 10
-10Hammer
98.7
97.1 – 99.5
< 10
-10Saw
99.3
98.1 – 99.9
< 10
-10All
99.3
98.1 – 99.9
< 10
-10Precision grip tasks:
Marble play
98.7
97.1 – 99.5
< 10
-10Spoon
98.0
96.2 – 99.1
< 10
-10Sewing
98.8
97.4 – 99.6
< 10
-10Writing
90.1
. 87.0 – 92.8
9.4 10
-10Scissors
97.8
95.9 – 98.9
< 10
-10All
99.1
97.7 – 99.7
< 10
-10All ten tasks
99.1
97.7 – 99.8
< 10
-10Performance:
Hand grip
82.1
78.2 – 85.5
0.14
Hand skill
83.0
79.2 – 86.4
0.05
All
86.1
82.6 – 89.2
1.9 10
-4All variables:
99.1
97.7 – 99.7
< 10
-10480
485
Figure legends.
Figure 1. Fitted relative difference in hand-grip strength according to sex and declared general
handedness. Error bars are plus/minus one standard deviation.
Figure 2.Fitted relative difference in hand skill according to sex and declared general handedness.
Error bars are plus/minus one standard deviation.
Figure S1. Starting position of the peg-moving task. A board of and English version of the peg
solitaire game is used, with two sets of three pegs with different colours. Tweezers (depicted) are
used to move the pegs. A first move (arrow 1) is to jump a brown peg orthogonally over an adjacent
red peg into a hole two positions away. The other arrows depict the four other moves of one row.
The total number of moves of a trial is thus 5x3. A second trial is done with the other hand, and this
process is repeated three times.
490
Figure 1
500
505
510
515
520
Figure 2
525
530
535
Figure S1
545
Table S1.
"date" "Sex" "age" "declared_handedness" "Throwing" "Racquet" "Marble" "Knife" "Spoon" "Hammer" "Saw" "Sewing" "Writing" "Scissors" "PegL" "PegR" "Handgrip_L" "Handgrip_R"
2015-01-14 "F" 47.972602739726 "R" "0" "0" "0" "0" "0" "0" "0" "0" "0" "0" 49.38 49.5766666666667 25.7 28.2 2015-01-14 "F" 18.4055936073059 "R" "0" "0" "0" "0" "0" "0" "0" "0" "0" "0" 53 32 22 25.1 2015-01-14 "F" 31.5836757990868 "R" "0" "0" "0" "0" "0" "0" "0" "0" "0" "0" 35.9766666666667 25.0633333333333 16.6 22.6 2015-01-14 "M" 32.5617579908676 "R" "0" "0" "0" "0" "0" "0" "0" "0" "0" "0" 36.6666666666667 31.3333333333333 33.9 33.2 2015-01-14 "F" 57.9068493150685 "R" "0" "0" "0" "0" "0" "0" "0" "0" "0" "0" NA NA NA NA 2015-01-15 "M" 43.027397260274 "R" "0" "0" "0" "0" "0" "0" "0" "0" "0" "0" 31 24 45.3 45.1 2015-01-15 "M" 35.1205479452055 "R" "0" "0" "0" "0" "0" "0" "0" "0" "0" "1" 22.6666666666667 21.3333333333333 51.8 52 2015-01-15 "M" 43.3671232876712 "L" "1" "1" "1" "1" "1" "1" "1" "1" "0" "1" NA NA 22.4 34.3 2015-01-15 "M" 38.3918949771689 "R" "0" "0" "0" "0" "0" "0" "0" "0" "0" "0" 22.6666666666667 21.3333333333333 40.1 39.5 2015-01-15 "F" 35.5809360730594 "R" "0" "0" "0" "0" "0" "0" "0" "0" "0" "1" 21 20 25.3 26.1 2015-01-15 "M" 35.9808219178082 "R" "0" "0" "0" "0" "0" "0" "0" "0" "0" "0" 25.3333333333333 25.3333333333333 43.8 40.7 2015-01-15 "M" 32.1205479452055 "L" "0" NA NA "0" "0" "0" "0" "0" "0" "0" 32 21.6666666666667 35.9 40.8 2015-01-15 "M" 15.2494292237443 "R" "0" "0" "0" "0" "0" "0" "0" "0" "0" "0" 52.3333333333333 38 39.4 43 2015-01-15 "M" 46.2986301369863 "R" "0" "0" "0" "0" "0" "0" "0" "0" "0" "0" 34 24.3333333333333 32 34.9 2015-01-15 "F" 44.0301369863014 "R" "0" "0" "0" "0" "0" "0" "0" "0" "0" "0" 50.1566666666667 24.5933333333333 25.1 34 2015-01-15 "F" 43.4493150684931 "R" "0" "0" "0" "0" "0" "0" "0" "0" "0" "0" 33.6 23.2233333333333 29.7 32.3 2015-01-15 "F" 53.4821917808219 "R" "0" "0" "0" "0" "0" "0" "0" "0" "0" "0" 71.8866666666667 28.5166666666667 14.2 15.1 2015-01-15 "M" 29.1534246575342 "R" "0" "0" "0" "0" "0" "0" "0" "0" "0" "0" 31.2333333333333 22.1 32.1 36.4 2015-01-15 "F" 52.6246575342466 "R" "0" "0" "0" "0" "0" "0" "0" "0" "0" "0" 34.61 26.7166666666667 26.3 27.2 2015-01-15 "F" 43.4767123287671 "R" "0" "0" "0" "0" "0" "0" "0" "0" "0" "0" NA NA NA NA 2015-01-15 "F" 35.378196347032 "R" "0" "0" "0" "0" "0" "0" "0" "0" "0" "0" NA NA NA NA 2015-01-15 "F" 68.3506849315068 "R" "0" "0" "0" "0" "0" "0" "0" "0" "0" "0" 166.9 110.5 19.3 20.9 2015-01-15 "M" 74.0850456621005 "R" "0" "0" "0" "0" "0" "0" "0" "0" "0" "0" 28.6333333333333 21.2666666666667 28.2 29.2 2015-01-16 "M" 29.2876712328767 "R" "0" "0" "0" "0" "0" "0" "0" "0" "0" "0" 42.1433333333333 21.9866666666667 40.8 44 2015-01-16 "M" 34.750799086758 "R" "0" "0" "0" "0" "0" "0" "0" "0" "0" "0" 27.9833333333333 19.2566666666667 48.8 47.9 2015-01-16 "M" 41.1972602739726 "R" "0" "0" "0" "0" "0" "0" "0" "0" "0" "0" 38.34 22.84 46.5 51.4 2015-01-16 "M" 18.7069634703196 "R" "0" "0" "0" "0" "0" "0" "0" "0" "0" "0" 26.7733333333333 19.5066666666667 33.9 34.7 2015-01-16 "F" 56.5835616438356 "R" "0" "0" "0" "0" "0" "0" "0" "0" "0" "0" 91.5 119.16 18.2 23.5 2015-01-16 "F" 18.0082191780822 "R" "0" "0" "0" "0" "0" "0" "0" "0" "0" "0" 47.5266666666667 38.1033333333333 20.9 22.6 2015-01-16 "F" 36.6987442922374 "R" "0" "0" "0" "0" "0" "0" "0" "0" "0" "0" 53.0966666666667 38.3166666666667 26.2 28 2015-01-16 "M" 27.5398401826484 "R" "0" "0" "0" "0" "0" "0" "0" "0" "0" "0" 93.7466666666667 46.06 23.3 25.2 2015-01-16 "F" 25.3480593607306 "R" "0" "0" "0" "0" "0" "0" "0" "0" "0" "0" 31.46 25.22 24.8 29.2 2015-01-17 "M" 37.0383561643836 "R" "0" "0" "0" "1" "0" "0" "0" "0" "0" "0" 29.6133333333333 25.0566666666667 33.3 38.3 2015-01-17 "M" 21.3809360730594 "R" "0" "0" "0" "0" "0" "0" "0" "0" "0" "0" 27.2733333333333 19.7866666666667 34.3 39 2015-01-17 "F" 27.8849315068493 "R" "0" "0" "0" "0" "0" "0" "0" "0" "0" "0" 36.5766666666667 24.0766666666667 15.9 16.6 2015-01-17 "F" 32.8383561643836 "R" "0" "0" "0" "0" "0" "0" "0" "0" "0" "0" 25.78 21.9933333333333 19.8 23.8 2015-01-17 "F" 22.9123287671233 "R" "0" "0" "0" "0" "0" "0" "0" "0" "0" "0" 47.44 18.4233333333333 23 22.6 2015-01-17 "F" 23.2109589041096 "R" "0" "0" "0" "0" "0" "0" "0" "0" "0" "0" 22.5666666666667 17.6333333333333 16.4 21.8 2015-01-17 "F" 24.3562785388128 "R" "0" "0" "0" "0" "0" "0" "0" "0" "0" "0" 25.97 30.8066666666667 14.9 18 2015-01-17 "M" 56.586301369863 "R" "0" "0" "0" "0" "0" "0" "0" "0" "0" "0" 39.7333333333333 26.9333333333333 32.9 28.9 2015-01-17 "F" 21.2657534246575 "R" "0" "0" "0" "0" "0" "0" "0" "0" "0" "0" 47.9366666666667 21.34 22.3 25.7 2015-01-17 "M" 51.7205479452055 "R" "0" "0" "0" "0" "1" "0" "0" "0" "0" "0" 27.4366666666667 22.5333333333333 27.1 40 2015-01-17 "F" 39.4301369863014 "R" "0" "0" "0" "0" "0" "0" "0" "0" "0" "0" 39.44 46.26 18.4 22.3 2015-01-17 "F" 40.1917808219178 "R" "0" "0" "0" "0" "0" "0" "0" "0" "0" "0" 32.6966666666667 35.47 17.5 21.1 2015-01-17 "M" 70.3946347031963 "R" "0" "0" "0" "0" "0" "0" "0" "0" "0" "0" 26.9866666666667 21.53 41.8 45.8 2015-01-17 "M" 43.5780821917808 "R" "0" "0" "0" "0" "0" "1" "1" "0" "0" "0" NA NA 38.9 39.1 555 560 565 570 575 580 585 590 595 600
2015-01-17 "M" 31.5535388127854 "R" "0" "0" "0" "0" "0" "0" "0" "0" "0" "0" 34.6566666666667 32.94 33.5 34.9 2015-01-17 "M" 18.8055936073059 "R" "0" "0" "0" "0" "0" "0" "0" "0" "0" "0" 23.26 23.5333333333333 34.7 34.6 2015-01-17 "M" 63 "R" "0" "0" "0" "0" "0" "0" "0" "0" "0" "0" 41.2833333333333 58.7333333333333 30.3 31.3 2015-01-17 "M" 51.4356164383562 "R" "0" "0" "0" "0" "0" "0" "0" "0" "0" "0" 22.89 17.0133333333333 39.8 40.3 2015-01-17 "F" 25.4987442922374 "R" "0" "0" "0" "0" "0" "0" "0" "0" "0" "0" 39.6133333333333 26.2066666666667 17.7 20.4 2015-01-17 "M" 54.5835616438356 "R" "0" "0" "0" "0" "0" "0" "0" "0" "0" "0" 52.8066666666667 42.8 31.3 34.9 2015-01-17 "F" 22.4905251141553 "R" "0" "0" "0" "0" "0" "0" "0" "0" "0" "0" 49.1233333333333 29.0133333333333 20.6 20.8 2015-01-17 "M" 37.5699771689498 "R" "0" "0" "0" "0" "0" "0" "0" "0" "0" "0" 38.5966666666667 25.5866666666667 49.7 50.3 2015-01-18 "M" 63.0027397260274 "L" "1" "1" "1" "1" "1" "1" "1" "0" "0" "1" 41.2833333333333 58.7333333333333 30.3 31.3 2015-01-18 "F" 24.4713470319635 "R" "0" "0" "0" "0" "0" "0" "0" "0" "0" "0" 32.04 28.9766666666667 19.1 22 2015-01-18 "M" 48.6986301369863 "R" "0" "0" "0" "0" "0" "0" "0" "0" "0" "0" 34.0833333333333 27.31 39.9 34.9 2015-01-18 "M" 18.3480593607306 "R" "0" "0" "0" "0" "0" "0" "0" "0" "0" "0" 44.8666666666667 27.84 31.4 29.4 2015-01-18 "M" 38.9041095890411 "R" "0" "0" "0" "0" "0" "0" "0" "0" "0" "0" 26.0166666666667 27.0466666666667 51.4 59.5 2015-01-18 "F" 34.5480593607306 "R" "0" "0" "0" "0" "0" "0" "0" "0" "0" "0" 36.5933333333333 26.9666666666667 28.5 27.1 2015-01-18 "F" 54.2301369863014 "R" "0" "0" "0" "0" "0" "0" "0" "0" "0" "0" 33.3633333333333 44.4933333333333 20.2 21.7 2015-01-18 "F" 40.7068493150685 "R" "0" "0" "0" "0" "0" "0" "0" "0" "0" "0" 32.68 20.8833333333333 23.4 25 2015-01-18 "M" 33.4905251141552 "L" "1" "0" "0" "0" "1" "0" "0" "0" "0" "0" 48.3966666666667 63.8566666666667 34.7 29.1 2015-01-18 "M" 30.7617579908676 "R" "0" "0" "0" "0" "0" "0" "0" "0" "0" "0" 33.7266666666667 24.6066666666667 34.6 31.1 2015-01-18 "M" 26.7124429223744 "R" "0" "0" "0" "0" "0" "0" "0" "0" "0" "0" 33.88 20.07 39.5 42.7 2015-01-18 "F" 23.8575342465753 "R" "0" "0" "0" "0" "0" "0" "0" "0" "0" "0" 34.3766666666667 43.4133333333333 28.1 25.7 2015-01-18 "M" 45.2739726027397 "R" "0" "0" "0" "0" "0" "0" "0" "0" "0" "0" 28.8566666666667 29.7266666666667 40.1 43.9 2015-01-18 "F" 42.9068493150685 "R" "0" "0" "0" "0" "0" "0" "0" "0" "0" "0" 33.55 40.0733333333333 27.8 29.8 2015-01-18 "M" 18.9287671232877 "R" "0" "0" "0" "0" "0" "0" "0" "0" "0" "0" 29.6066666666667 25.6 38 43.6 2015-01-18 "M" 17.1232876712329 "R" "0" "0" "0" "0" "0" "0" "0" "0" "0" "0" 25.6 17.83 34.4 35.6 2015-01-18 "M" 20.0328767123288 "R" "0" "0" "0" "0" "0" "0" "0" "0" "0" "0" 38.1633333333333 50.1433333333333 32.8 38.7 2015-01-18 "M" 17.3179223744292 "R" "0" "0" "0" "0" "0" "0" "0" "0" "0" "0" 41.4666666666667 33.9 21 24.7 2015-01-18 "M" 46.5287671232877 "L" "0" "1" "1" "1" "0" "1" "1" "0" "0" "0" 19.8033333333333 24.1333333333333 37.3 37.8 2015-01-19 "M" 35.3150684931507 "R" "0" "0" "0" "0" "0" "0" "0" "0" "0" "0" 41.35 22.0233333333333 42.4 48.9 2015-01-19 "M" 39.9506849315068 "R" "0" "0" "0" "0" "0" "1" "0" "0" "0" "0" 70.4066666666667 33.5433333333333 39.3 40.3 2015-01-19 "M" 48.9890410958904 "L" "1" "1" "1" "1" "1" "1" "1" "1" "1" "1" 54.74 116.696666666667 47 39.5 2015-01-19 "M" 50.4246575342466 "R" "1" "0" "0" "0" "0" "0" "0" "0" "0" "0" 29.73 25.0233333333333 42.7 47.6 2015-01-19 "M" 54.5890410958904 "R" "0" "0" "0" "0" "0" "0" "0" "0" "0" "0" 31.6033333333333 33.1666666666667 41.6 44.8 2015-01-19 "M" 25.509703196347 "R" "0" "0" "0" "0" "0" "0" "0" "0" "0" "0" 35.6366666666667 30.7266666666667 34.8 57.9 2015-01-19 "M" 49.9424657534247 "R" "0" "0" "0" "0" "0" "0" "0" "0" "0" "0" 48.82 46.6033333333333 28.8 32 2015-01-19 "M" 38.3315068493151 "R" "0" "0" "0" "0" "0" "0" "0" "0" "0" "0" 36.2333333333333 38.87 33.9 34.5 2015-01-19 "M" 35.972602739726 "R" "0" "0" "0" "0" "0" "0" "0" "0" "0" "0" 28.28 30.35 36.5 33.8 2015-01-19 "M" 27.5727168949772 "R" "0" "0" "0" "0" "0" "0" "0" "0" "0" "0" 91.16 28.89 33.4 43.1 2015-01-19 "M" 33.7316210045662 "R" "0" "0" "0" "0" "0" "0" "0" "0" "0" "0" 37.53 30.7333333333333 47.1 46.1 2015-01-19 "M" 45.6904109589041 "R" "0" "0" "0" "0" "0" "0" "0" "0" "0" "0" 43.93 33.6733333333333 35.6 42.2 2015-01-19 "M" 26.4932648401826 "R" "0" "0" "0" "0" "0" "0" "0" "0" "0" "0" 20.3566666666667 33.35 43.1 46.9 2015-01-19 "M" 36.0438356164384 "R" "0" "0" "0" "0" "0" "0" "0" "0" "0" "0" 33.63 25.95 30.8 36.4 2015-01-19 "M" 22.2794520547945 "R" "0" "0" "0" "0" "0" "0" "0" "0" "0" "0" 29.1633333333333 22 25 17.1 2015-01-19 "F" 46.7835616438356 "R" "0" "0" "0" "0" "0" "0" "0" "0" "0" "0" 71.55 50.3733333333333 20.4 18.7 2015-01-19 "F" 58.3150684931507 "R" "0" "0" "0" "0" "0" "0" "0" "0" "0" "0" 69.8233333333333 32.6933333333333 24 26.4 2015-01-19 "M" 50.0986301369863 "R" "0" "0" "0" "0" "0" "0" "0" "0" "0" "0" 28.0066666666667 23.0366666666667 53.7 59.9 2015-01-19 "M" 37.8904109589041 "R" "0" "0" "0" "0" "0" "0" "0" "0" "0" "0" 21.9033333333333 19.74 32.9 39.1 2015-01-19 "M" 28.0520547945205 "R" "0" "0" "0" "0" "0" "0" "0" "0" "0" "0" 23.9566666666667 20.9 50.9 48.9 2015-01-20 "F" 51.9890410958904 "R" "0" "0" "0" "0" "0" "0" "0" "0" "0" "0" 45.85 27.4366666666667 24 25.6 2015-01-20 "M" 55.1315068493151 "R" "0" "0" "0" "0" "0" "0" "0" "0" "0" "0" 56.2533333333333 42.4566666666667 35.1 37 2015-01-20 "F" 18.8301369863014 "R" "0" "0" "0" "0" "0" "0" "0" "0" "0" "0" 38.2933333333333 25.4 25.8 27.1 2015-01-20 "F" 30.1616438356164 "L" "1" "1" "1" "1" "1" "0" "1" "1" "0" "0" 82.7966666666667 55.2066666666667 NA NA 605 610 615 620 625 630 635 640 645 650