HAL Id: hal-02780326
https://hal.uca.fr/hal-02780326
Submitted on 2 Jul 2020
HAL is a multi-disciplinary open access
archive for the deposit and dissemination of
sci-entific research documents, whether they are
pub-lished or not. The documents may come from
teaching and research institutions in France or
abroad, or from public or private research centers.
L’archive ouverte pluridisciplinaire HAL, est
destinée au dépôt et à la diffusion de documents
scientifiques de niveau recherche, publiés ou non,
émanant des établissements d’enseignement et de
recherche français ou étrangers, des laboratoires
publics ou privés.
Distributed under a Creative Commons Attribution - NonCommercial| 4.0 International
License
major and volatile elements
Swetha Venugopal, Federica Schiavi, Séverine Moune, Nathalie
Bolfan-Casanova, Timothy Druitt, Glyn Williams-Jones
To cite this version:
Swetha Venugopal, Federica Schiavi, Séverine Moune, Nathalie Bolfan-Casanova, Timothy Druitt, et
al.. Melt inclusion vapour bubbles: the hidden reservoir for major and volatile elements. Scientific
Reports, Nature Publishing Group, 2020, 10 (1), �10.1038/s41598-020-65226-3�. �hal-02780326�
Melt inclusion vapour bubbles:
the hidden reservoir for major and
volatile elements
Swetha Venugopal
1,2✉, Federica Schiavi
2, Severine Moune
2,3,4, Nathalie Bolfan-casanova
2,
timothy Druitt
2& Glyn Williams-Jones
1olivine-hosted melt inclusions (Mis) provide samples of magmatic liquids and their dissolved volatiles from deep within the plumbing system. Inevitable post-entrapment modifications can lead to significant compositional changes in the glass and/or any contained bubbles. Re-heating is a common technique to reverse MI crystallisation; however, its effect on volatile contents has been assumed to be minor. We test this assumption using crystallised and glassy basaltic MIs, combined with Raman spectroscopy and 3D imaging, to investigate the changes in fluid and solid phases in the bubbles before and after re-heating. Before re-heating, the bubble contains CO2 gas and anhydrite (caSo4) crystallites. The rapid diffusion of major and volatile elements from the melt during re-heating creates new phases within the bubble: So2, gypsum, Fe-sulphides. Vapour bubbles hosted in naturally glassy MIs similarly contain a plethora of solid phases (carbonates, sulphates, and sulphides) that account for up to 84% of the total MI sulphur, 80% of CO2, and 14% of FeO. In both re-heated and naturally glassy MIs, bubbles sequester major and volatile elements that are components of the total magmatic budget and represent a “loss” from the glass. Analyses of the glass alone significantly underestimates the original magma composition and storage parameters.
Olivine-hosted melt inclusions (MIs) provide insight into the nature of the magma mantle source, storage condi-tions, and pre-eruptive volatile contents1. Following entrapment, MIs undergo compositional modifications due
to growth of the host olivine along the MI walls, and to crystallisation of daughter minerals from the glass due to slow ascent rates, and/or cooling1,2. Another modification is the nucleation of a vapour bubble in response to
decompression during cooling and post-entrapment crystallisation1,2, further reducing the solubility of volatiles
in the glass. Vapour, or shrinkage, bubbles produced by differential thermal contraction between the melt (glass) and the host crystal are considered to be inherent to the MI1,2. However, pre-existing bubbles that formed
exter-nally in a vapour-saturated system may also become trapped inside MIs. Vapour bubbles may also form during MI leakage and decrepitation of the host crystal3,4. Discriminating between various bubble types depends upon
the size of the bubble relative to the total inclusion. Since the volumetric proportions of vapour bubbles depend on the cooling rate, volatile content and melt composition, cooling-related shrinkage and melt-saturated bubbles normally comprise 0.2 to 10 vol% of the inclusion3,4. Bubbles with greater volumetric proportions are not
consid-ered inherent to the MI3,4.
Due to the strong pressure-dependency of CO2 solubility, the contraction of the melt and the decrease of the
internal pressure in response to cooling and post-entrapment crystallisation first leads to rapid CO2 saturation of
the melt, and consequently, the transfer of CO2 gas into the bubble5–7, so that analyses of the glass yield
errone-ously low magmatic CO2 concentrations. This poses significant problems as the CO2 content is commonly used to
infer the pressure of crystallisation and MI entrapment, as well as magmatic storage depths. By only considering the glass, these values are grossly underestimated.
Many of the post-entrapment modifications that occur within olivine-hosted MIs can be corrected using well-constrained exchange coefficients and recently established methods to quantify the amount of volatiles, par-ticularly CO2, sequestered by the bubble. These approaches include the use of trace element proxies, such as CO2/
Nb, to determine the pre-eruptive CO2 content of the undegassed melt8, reheating the MI to resorb the bubble
1Department of Earth Sciences, Simon Fraser University, Burnaby, Canada. 2Laboratoire Magmas et Volcans,
Université Clermont Auvergne, CNRS, IRD, OPGC, Clermont-Ferrand, France. 3Observatoire Volcanologique et
Sismologique de Guadeloupe (OVSG), Gourbeyre, FWI, Guadeloupe. 4Institut de Physique du Globe de Paris,
Université de Paris, Paris, France. ✉e-mail: swethav@sfu.ca
and retrieve the CO2 content of the MI at the time of entrapment9–11, and estimating the mass of CO2 present in
the bubble with Raman spectroscopy and adding it back into the glass4,7,8,10,12,13. Initial estimates concluded that
40 to 90% of the total CO2 occurs in the vapour bubble4,7,10,13. However, Raman spectroscopy has also revealed
the presence of carbonates in some bubbles14–16, suggesting the percentage of original CO
2 in the bubble may be
much higher4,15,17,18. Other solid phases have also been observed within MI-hosted bubbles, including gypsum
and native sulphur, presenting similar issues of sequestration for sulphur16. The presence of H
2O in MI bubbles
has also been reported in liquid form and in gypsum, nahcolite, and hydrous silicate solids17.
In the case of crystallised MIs, experimental methods include homogenisation and re-heating to dissolve the crystals and retrieve the initial magma composition. Although the effects of re-heating on the H2O content
and fO2 of the MI have been previously examined19,20, the impact on major and other volatile elements has been
assumed to be minor, and remains untested. Furthermore, the composition of vapour bubbles in crystallised MIs has only been studied following re-heating, with the major assumption that all phases in the bubble were present prior to re-heating16. We investigate this assumption using primitive (Fo > 80 mol%) basaltic olivine-hosted MIs
from three volcanoes along the Garibaldi Volcanic Belt in western Canada (Mount Cayley, Garibaldi Lake and Mount Meager). We address two main questions. (1) Does re-heating modify the composition of MI bubbles? To track the compositional changes induced by re-heating, we analysed the vapour bubbles of eight naturally crystallised MIs from Mount Cayley and Garibaldi Lake by Raman spectroscopy before and after re-heating. (2) How does the vapour bubble contribute to the total volatile budget of the MI? This was addressed through Raman analyses of the bubble of seven glassy MIs from Mount Meager to examine the migration of C–O–H–S volatiles from the glass to the bubble during natural cooling. For both questions, selected bubbles were scanned in 3D using Raman spectroscopy.
Here we show that MI vapour bubbles are reservoirs for major and volatile elements that diffuse from the melt/glass. Over a range of magmatic and post-eruptive temperatures (1200 °C to surface conditions), S, H2O,
CO2, Fe, Ca and Mg diffuse from the glass and form new phases within the bubble. It follows that analyses of only
the glassy portions of MIs will significantly underestimate the magma composition and yield incorrect storage parameters (T, P, Fe3+/ΣFe, fO
2).
Sample selection.
The Garibaldi Volcanic Belt (GVB) is a dormant volcanic arc that lies northward of the High Cascades along the western margin of North America. Volcanism along the GVB results from the slow (~45 mm yr−1) and oblique subduction of the Juan de Fuca Plate beneath the North American Plate21. Thedomi-nant eruptive composition along the arc is intermediate calc-alkaline, with basaltic eruptions comprising a small volume fraction22. Whole rock data are found in Supplementary Table S1. We chose primitive (Fo > 80 mol%)
basaltic olivine-hosted MIs that have been thoroughly investigated for their major, volatile and trace element contents and magmatic conditions from Mount Cayley, Garibaldi Lake and Mount Meager21. These samples
were chosen based on their arc-typical compositions, the lack of a brine phase during magmatic evolution21,
which would otherwise affect the distribution and composition of phases in the vapour bubble13, and their
well-constrained mantle source estimations21.
Glassy basaltic MIs hosted in unzoned olivine phenocrysts (Fo 77–84 mol%) are ubiquitous in the Pleistocene-aged breccia deposits from Mount Meager21. All MIs sampled from Mount Cayley lava flows (Fo
86-89 mol%; 12 -10 ka)21, and tephra deposits from The Cinder Cone (Fo 79-88 mol%; 40 ka)22 within the
Garibaldi Lake Volcanic Field, are crystallised and hosted in unzoned olivines. Based on the emplacement mech-anism of these deposits, MI crystallisation was likely a syn-eruptive process due to slow cooling.
Trace element modelling suggests the sub-arc mantle beneath Mount Cayley, Garibaldi Lake and Mount Meager is best represented by the depleted MORB mantle23 (DMM) modified by 2 to 10 wt% of hydrous fluids
derived from the Juan de Fuca Plate, followed by 5 to 12% partial melting21. Based on these factors, the
composi-tion of the MIs, and subsequently their vapour bubble, can be considered representative of primitive arc magma. Finally, these MIs provide several technical benefits wherein the clarity of the vapour bubble, size of the MIs (<30 μm), and orientation of daughter minerals allowed for easier and more efficient Raman and 3D acquisitions.
All MIs in this study yield a positive relationship between MI and vapour bubble size (<10%), and a linear correlation between the vapour bubble size and the mass of CO2 in the bubble (Fig. 1). This suggests that the
bub-bles are inherent to the MI system, were nucleated at the time of decompression, and hence contain CO2 that was
originally dissolved in the melt. One glassy MI has a lower bubble:MI volume ratio (MMA200; 1.2 vol%) due to a large MI volume, but a bubble size that is globally consistent.
Re-heated Mis.
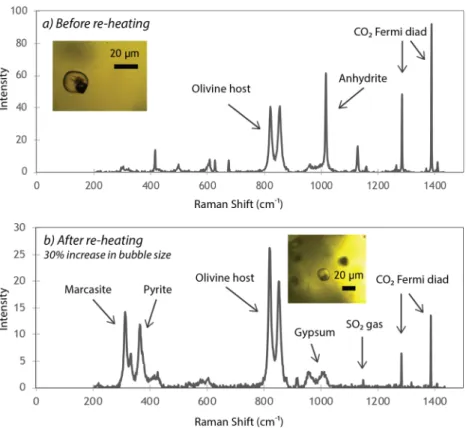
In every bubble from Mount Cayley and Garibaldi Lake, CO2 is the main gas phase(Fig. 2a). Estimating between 630 and 1400 ppm CO2 in the glass before re-heating (1.3 × 10⁻¹¹ to 2.0 × 10⁻¹⁰ g;
Supplementary Table S2), and assuming that the whole bubble is filled with fluid CO2, Raman acquisitions
indi-cate that between 44 and 88% of the total CO2 is found in the vapour bubble, before re-heating (Supplementary
Table S2). Negligible water contents were found within the bubbles of three samples. Anhydrite (CaSO4) is the
dominant solid phase present in every bubble (Fig. 2a). Three-D scans prior to re-heating show that the bubble is filled with CO2, while anhydrite forms a partial shell with discrete crystals4,13 (Fig. 3a).
Volumetrically, CO2 and anhydrite occupy 88% and 12% of the bubble, respectively (Table 1). Using 3D scan
volumes, glass contents of 1150 ppm S (Table 1), and 10.7 wt% CaO21, 58% of the total (glass + bubble) CO
2, 20%
of the total S and 0.5% of the total CaO is found in the vapour bubble (Table 1).
Each MI was re-heated at the same rate and temperature steps to avoid water loss from the glass24. The bubble
persisted throughout the experiment and, upon quench, the diameter increased by up to 30% (volume increase up to 120%). The extent of bubble size increase is dependent on the formation of solid phases, and the total amount of CO2 in the glass that is able to diffuse above the closure temperature4,10. In all samples, the density of CO2 in the
the glass to the bubble during re-heating (Table 1). If the bubble contained only fluid CO2, 67 to 90% of the total
CO2 would be sequestered within the bubble following re-heating (Supplementary Table S2). These are
consid-ered maximum values due to the presence of solid phases.
As a result of re-heating, anhydrite hydrates to gypsum (CaSO4·2H2O), resulting in a volume increase25
(Table 1). Additional compositional changes following re-heating include the introduction of new S-bearing spe-cies. In most samples, sulphur diffuses from the melt and forms gaseous SO2 in the bubble, which mixes with CO2
(Figs. 2b, 3b). Native S and Fe-sulphides (pyrite and polymorphic marcasite) appear in several bubbles following re-heating. Due to the similar Raman spectra between pyrite and non-magnetic pyrrhotite (Fe1-xS), we cannot
exclude the possibility of pyrrhotite within the bubbles26 (Fig. 2b). The new S-bearing species have contrasting
oxidation states, suggesting an intermediate oxidizing-reducing environment after reheating, which is consistent with previous findings of rapid fO2 re-equilibration during MI re-heating19. Nonetheless, these S-bearing phases
suggest saturation with respect to sulphide and sulphate, and subsequent degassing from the glass to the bubble. Three-D scans reveal the physical re-distribution of elements and phases within the bubble after re-heating: CO2 and SO2 gas are mixed throughout the bubble, while crystals of gypsum, anhydrite and pyrite generally
nucleate on the bubble rim and grow unevenly in size and orientation (Fig. 3b). Mount Cayley and Garibaldi
Figure 1. Comparing the volume of the vapour bubble to the corresponding (a) MI volume and (b) mass of
CO2 in the bubble for all samples in this study. Inset in (a) refers to the area indicated by the grey dashed box.
Coloured lines indicate volume ratio between the bubble and the MI; typically, the bubble comprises between 0.2 and 10 vol %. Volumetric proportions larger than this suggest the bubble is secondary, or pre-existing, and likely formed due to MI leakage, and/or rupturing of the host crystal. On both graphs, Mount Cayley and Garibaldi Lake data refer to values before re-heating. The mass of CO2 in the bubble was calculated using the
Raman spectra, and assuming that CO2 is the only phase present in the bubble. Overall, the linear correlation
suggests that every vapour bubble in this study is primary, was nucleated within the MI, and contains CO2 gas
that was exsolved from the glass. One Mount Meager MI has a lower ratio of bubble to MI volume (MMA200; 1.2 vol%) due to a large MI volume, but a bubble size that is globally consistent. Error bars are 2σ and, in most samples, correspond to the size of the data marker.
Lake MIs contain low water contents, between 0.1 and 1 wt%, with one inclusion containing 2 wt%21. Therefore,
the persistence of anhydrite following re-heating is either due to its partial breakdown, and/or availability of H2O in the melt/glass as it is a limiting factor in the formation of gypsum. Volumetrically, the re-heated bubble
contains 84% CO2, 1% SO2, 7% pyrite, 6% gypsum, and 3% anhydrite (Table 1). Of the MI total (glass + bubble),
the amount of S in the bubble increases to 70%, while pyrite and gypsum sequester 1.6% FeO and 1.4% H2O,
respectively (Table 1). The amount of CO2 in the bubble, relative to the total MI, increases to 63%. The mass of
CO2 gained by the bubble is balanced by the mass of CO2 lost by the glass (Supplementary Table S2). Using 3D
scans, and assuming mass conservation (amount of S gained by the bubble is balanced by the amount lost by the glass), the initial S content of the glass is approximately 1150 ppm, and decreases to 420 ppm following re-heating due to diffusion to the bubble (Table 1); this corresponds to a 64% loss of S from the glass. Prior to re-heating, the calculated S content of the glass suggests near saturation conditions, but this becomes masked by the low S concentration following re-heating.
Glassy Mis.
Mount Meager MIs contain 1200-1370 ppm CO2, 2500-2800 ppm S, 9.1-9.3 wt% CaO,5.9-6.9 wt% FeO and 2.6-2.9 wt% H2O in the glass21 (Supplementary Table S3). The amount of CO2 in the vapour
bubbles, assuming that fluid CO2 is the only phase present, represents 45 to 87% of the total MI content
(2400-8250 ppm; Supplementary Table S2).
Raman spectra of bubbles hosted in glassy MIs reveal significant proportions of both C- and S-bearing solids (Fig. 4a). Every bubble contains carbonates: Mg-calcite ((Mg,Ca)CO3)) is the dominant phase, while siderite
(FeCO3) is less abundant. The acquired Raman spectra show relatively large carbonate peaks because of the
pres-ence of (Ca-, Mg-, and Fe-bearing) solid solutions. Therefore, in estimating the volumes of the different phases contained in the bubbles, we assumed for simplicity that the carbonates are primarily CaCO3. Anhydrite and
pyrite (and/or non-magnetic pyrrhotite) are always present. Some samples also contain marcasite and/or nahco-lite (NaHCO3). Samples MMA200 and MMA300 contain both anhydrite and gypsum.
Three-D scans show a partial shell of either pyrite/marcasite or carbonate with a centre filled with CO2 gas
(Fig. 4b; Table 1). Volumetrically, CO2 occupies between 76 and 88% of the bubble. Anhydrite and gypsum are
volumetrically minor, with a combined proportion below 3 vol% (Table 1). The partial pyrite shell in MMA 100 (Fig. 4b) and MMA300 occupies 9 and 19 vol% of the bubbles, respectively, whereas the bubble of MMA200 has a partial carbonate shell occupying 9 vol%. The bubble represents up to 3.4% CaO, up to 84% S and 6 to 14% FeO of the total MI (Table 1). Including carbonates, the total amount of CO2 in the MI rises to 2800-6900 ppm, with
53-80% in the bubble.
Figure 2. Raman spectra of vapour bubbles (a) before and (b) after heating. (a) Raman spectrum before
re-heating of the bubble shown in the inset (Brhm-33). The two phases present are CO2 gas and anhydrite solids.
(b) Raman spectrum of the same bubble after re-heating. The volume of the bubble increases, as well as the mass of CO2 within the bubble (see Table 1 and Supplementary Table S2). However, the total density of CO2
decreases. Anhydrite present before re-heating hydrates to gypsum. Additional S enters the bubble from the glass and forms pyrite, marcasite and SO2 gas.
Discussion
Magmatic conditions beneath the GVB.
Using the major oxide, volatile and trace element contents of Mount Cayley, Garibaldi Lake and Mount Meager MIs corrected for post-entrapment crystallisation21, themag-matic conditions beneath each centre can be calculated (Supplementary Table S3). Using olivine-melt equilib-ria27, entrapment temperatures range from 1090 to 1150 °C for Mount Cayley and 1120 to 1180 °C for Garibaldi
Lake; these values are consistent with re-heating experiments, specifically the temperature when the last daughter crystal dissolved (1000 to 1150 °C for all MIs). Entrapment temperatures range from 1100 to 1140 °C for Mount Meager MIs. The pressure of MI entrapment and/or host crystallisation was calculated using a volatile saturation model28. Using only the glass composition of CO
2 and H2O, pressure values range between 100 and 170 MPa for
Mount Cayley, 130 and 310 MPa for Garibaldi Lake, and 140 and 200 MPa for Mount Meager21. The pressure
values, assuming that the whole bubble is filled with gaseous CO2 (Fermi diad in Raman spectra), increase to
210-370 MPa for Mount Cayley, 140-580 MPa for Garibaldi Lake and 160-620 MPa for Mount Meager. Finally, after taking into account the volume of solids and gaseous phases (measured by 3D scans), the pressure val-ues increase further. The entrapment pressure for an individual MI following re-heating increases from 140 to 225 MPa. Pressure values for two glassy MIs increase from 610 to 665 MPa, and from 210 to 375 MPa.
The relationship between S speciation in the glass and fO2 is only applicable to Mount Meager MIs since
re-heating experiments rapidly reset the oxidation state of MIs19,29,30. Using only the glass content of S, the ratio of
Figure 3. Horizontal sections through 3D scans of a vapour bubble (Brhm-33) (a) before and (b) after
re-heating. Prior to re-heating, the bubble contains two main phases: CO2 gas (red) in the centre of the bubble
surrounded by a discontinuous shell of anhydrite (CaSO4, light blue). Following re-heating, part of the anhydrite
hydrates to gypsum (green). More S enters the bubble and forms pyrite (yellow) and SO2 gas. Although the SO2
peak is detected only in the central part of the bubble (dark red), SO2 is considered to be fully mixed with CO2
in the entire volume not occupied by the mineral phases; in fact, in the light red region, the intensity of the SO2
peak becomes as low as the spectral noise intensity, so only CO2 peaks can be detected. Water is not detected
in the bubbles except in the molecular form attached to gypsum. For a given mineral, color shadows are due to variations in Raman signal intensity and indicate that part of the signal comes from slightly below, or above, the shown planar sections. All solid phases are connected to the bubble walls. In few shown sections (e.g. in the top portion of the bubble), some crystals appear to float in the gas phase but, in reality, are connected to the wall (upper or lateral) of the bubble. Due to the lack of evidence supporting a brine phase, the elements in the bubbles migrate from the glass, with no secondary or external sources. This also implies that the H2O, CO2, S,
and Fe in the vapour bubble represents a “loss” from the glass and are major components of the total volatile budget. Three-D scans and the horizontal sections were generated using Renishaw’s WiRE software.
Re-heated MIs Naturally glassy MIs
Brhm 33 before Bhrm 33 after MMA100 MMA200 MMA300 Bubble radius cm 0.0006 0.00065 0.0009 0.0014 0.0013
Volume of bubble cm3 6.30 × 10⁻¹⁰ 8.46 × 10⁻¹⁰ 3.67 × 10⁻⁹ 1.15 × 10⁻⁸ 9.70 × 10⁻⁹
Cumulative volume of
phases inside bubble cm3 9.03 × 10⁻¹⁰ 1.15 × 10⁻⁹ 3.05 × 10⁻⁹ 1.41 × 10⁻⁸ 9.50 × 10⁻⁹ Density CO2 (Fermi doublet) g/cm3 0.34 0.29 0.12 0.23 0.23 CaSO4 g/cm3 2.97 2.97 2.97 2.97 2.97 CaSO4 × 2H2O g/cm3 2.3 2.3 2.3 FeS2 g/cm3 5 5 5 5 CaCO3 g/cm3 2.71 2.71 2.71 SO2 g/cm3 0.42 Volumetric proportions CO2 vol% 87.7 83.5 80.2 88.2 76.1 CaSO4 vol% 12.3 2.8 2.1 0.9 0.7 CaSO4 × 2H2O vol% 5.5 0.9 1.5 FeS2 vol% 6.9 9 1 18.5 CaCO3b vol% 8.6 9 3.2 SO2 vol% 1.3 CO2 cm3 7.92 × 10⁻¹⁰ 9.60 × 10⁻¹⁰ 2.45 × 10⁻⁹ 1.24 × 10⁻⁸ 7.24 × 10⁻⁹ CaSO4 cm3 1.11 × 10⁻¹⁰ 3.22 × 10⁻¹¹ 6.41 × 10⁻¹¹ 1.27 × 10⁻¹⁰ 6.65 × 10⁻¹¹ CaSO4 × 2H2O cm3 6.33 × 10⁻¹¹ 1.27 × 10⁻¹⁰ 1.43 × 10⁻¹⁰ FeS2 cm3 7.94 × 10⁻¹¹ 2.75 × 10⁻¹⁰ 1.41 × 10⁻¹⁰ 1.76 × 10⁻⁹ CaCO3 cm3 2.62 × 10⁻¹⁰ 1.27 × 10⁻⁹ 3.04 × 10⁻¹⁰ SO2 cm3 1.50 × 10⁻¹¹ sum 9.03 × 10⁻¹⁰ 1.15 × 10⁻⁹ 3.05 × 10⁻⁹ 1.41 × 10⁻⁸ 9.50 × 10⁻⁹ Mass proportions CO2 g 2.69 × 10⁻¹⁰ 2.78 × 10⁻¹⁰ 2.94 × 10⁻¹⁰ 2.86 × 10⁻⁹ 1.66 × 10⁻⁹ CaSO4 g 3.30 × 10⁻¹⁰ 9.56 × 10⁻¹¹ 1.90 × 10⁻¹⁰ 3.77 × 10⁻¹⁰ 1.98 × 10⁻¹⁰ CaO g 1.36 × 10⁻¹⁰ 3.94 × 10⁻¹¹ 7.84 × 10⁻¹¹ 1.55 × 10⁻¹⁰ 8.14 × 10⁻¹¹ SO3 g 1.94 × 10⁻¹⁰ 5.62 × 10⁻¹¹ 1.12 × 10⁻¹⁰ 2.22 × 10⁻¹⁰ 1.16 × 10⁻¹⁰ S g 7.77 × 10⁻¹¹ 2.25 × 10⁻¹¹ 4.48 × 10⁻¹¹ 8.88 × 10⁻¹¹ 4.65 × 10⁻¹¹ sum 3.30 × 10⁻¹⁰ 9.56 × 10⁻¹¹ 1.90 × 10⁻¹⁰ 3.77 × 10⁻¹⁰ 1.98 × 10⁻¹⁰ CaSO4 × 2H2O g 1.45 × 10⁻¹⁰ 2.92 × 10⁻¹⁰ 3.28 × 10⁻¹⁰ CaO g 4.74 × 10⁻¹¹ 9.51 × 10⁻¹¹ 1.07 × 10⁻¹⁰ SO3 g 6.76 × 10⁻¹¹ 1.36 × 10⁻¹⁰ 1.52 × 10⁻¹⁰ S g 2.71 × 10⁻¹¹ 5.44 × 10⁻¹¹ 6.10 × 10⁻¹¹ H2O g 3.04 × 10⁻¹¹ 6.11 × 10⁻¹¹ 6.86 × 10⁻¹¹ sum 1.45 × 10⁻¹⁰ 2.92 × 10⁻¹⁰ 3.28 × 10⁻¹⁰ FeS2 g 3.97 × 10⁻¹⁰ 1.37 × 10⁻⁹ 7.05 × 10⁻¹⁰ 8.79 × 10⁻⁹ Fe g 1.85 × 10⁻¹⁰ 6.39 × 10⁻¹⁰ 3.28 × 10⁻¹⁰ 4.09 × 10⁻⁹ S g 2.12 × 10⁻¹⁰ 7.34 × 10⁻¹⁰ 3.77 × 10⁻¹⁰ 4.70 × 10⁻⁹ sum 3.97 × 10⁻¹⁰ 1.37 × 10⁻⁹ 7.05 × 10⁻¹⁰ 8.79 × 10⁻⁹ CaCO3 g 7.11 × 10⁻¹⁰ 3.44 × 10⁻⁹ 8.24 × 10⁻¹⁰ CaO g 3.98 × 10⁻¹⁰ 1.93 × 10⁻⁹ 4.62 × 10⁻¹⁰ CO2 g 3.13 × 10⁻¹⁰ 1.51 × 10⁻⁹ 3.62 × 10⁻¹⁰ sum 7.11 × 10⁻¹⁰ 3.44 × 10⁻⁹ 8.24 × 10⁻¹⁰ SO2 g 6.28 × 10⁻¹² S g 3.19 × 10⁻¹² O g 3.09 × 10⁻¹² sum 6.28 × 10⁻¹² Weight percent Bubble mass g 5.99 × 10⁻¹⁰ 9.23 × 10⁻¹⁰ 2.57 × 10⁻⁹ 7.67 × 10⁻⁹ 1.18 × 10⁻⁸ CO2 wt% 45 30.18 23.61 56.98 17.16 CaO wt% 23 9.41 18.57 28.37 5.51 Fe wt% 20.02 24.89 4.28 34.67 H2O wt% 3.30 0.80 0.58 Continued
Re-heated MIs Naturally glassy MIs
Brhm 33 before Bhrm 33 after MMA100 MMA200 MMA300
S (total) wt% 13 28.71 30.32 6.78 40.72
Glass composition Brhm 33 before a Bhrm 33 after MMA100 MMA200 MMA300
CO2 ppm 695 600 1200 1328 1372
S ppm 1154 420 2640 2857 2538
CaO wt% 10.71 10.71 9.2 9.3 9.12
Fe wt% 4.16 4.16 6.98 5.93 6.68
H2O wt% 0.8 0.8 2.57 2.89 2.73
Melt inclusion parameters
MI volume cm3 1.07 × 10⁻⁷ 1.07 × 10⁻⁷ 5.54 × 10⁻⁸ 1.15 × 10⁻⁶ 1.51 × 10⁻⁷ MI volume w/o bubble cm3 1.06 × 10⁻⁷ 1.06 × 10⁻⁷ 5.23 × 10⁻⁸ 1.14 × 10⁻⁶ 1.41 × 10⁻⁷
glass density g/cm3 2.6 2.6 2.6 2.6 2.6
mass of glass w/o
bubble c g 2.75 × 10⁻⁷ 2.75 × 10⁻⁷ 1.36 × 10⁻⁷ 2.95 × 10⁻⁶ 3.67 × 10⁻⁷ CO2 in glass g 1.91 × 10⁻¹⁰ 1.65 × 10⁻¹⁰ 1.63 × 10⁻¹⁰ 3.92 × 10⁻⁹ 5.04 × 10⁻¹⁰ S in glass g 3.18 × 10⁻¹⁰ 1.15 × 10⁻¹⁰ 3.59 × 10⁻¹⁰ 8.44 × 10⁻⁹ 9.32 × 10⁻¹⁰ CaO in glass g 2.95 × 10⁻⁸ 2.94 × 10⁻⁸ 1.25 × 10⁻⁸ 2.75 × 10⁻⁷ 3.35 × 10⁻⁸ Fe in glass g 1.15 × 10⁻⁸ 1.14 × 10⁻⁸ 9.50 × 10⁻⁹ 1.75 × 10⁻⁷ 2.45 × 10⁻⁸ H2O in glass g 2.20 × 10⁻⁹ 2.20 × 10⁻⁹ 3.50 × 10⁻⁹ 8.54 × 10⁻⁸ 1.00 × 10⁻⁸
Glass + bubble phases
total CO2 g 4.61 × 10⁻¹⁰ 4.43 × 10⁻¹⁰ 7.69 × 10⁻¹⁰ 8.29 × 10⁻⁹ 2.53 × 10⁻⁹
total S g 3.95 × 10⁻¹⁰ 3.80 × 10⁻¹⁰ 1.14 × 10⁻⁹ 8.96 × 10⁻⁹ 5.74 × 10⁻⁹
total CaO g 2.96 × 10⁻⁸ 2.95 × 10⁻⁸ 1.30 × 10⁻⁸ 2.77 × 10⁻⁷ 3.41 × 10⁻⁸
total Fe g 1.15 × 10⁻⁸ 1.16 × 10⁻⁸ 1.01 × 10⁻⁸ 1.75 × 10⁻⁷ 2.86 × 10⁻⁸
total H2O g 2.20 × 10⁻⁹ 2.23 × 10⁻⁹ 3.50 × 10⁻⁹ 8.54 × 10⁻⁸ 1.01 × 10⁻⁸
Total MI composition (glass + bubble)
CO2 ppm 1698 1614 5654 2809 6893
S ppm 1436 1384 8360 3033 15623
CaO wt% 10.76 10.74 9.55 9.37 9.30
Fe wt% 4.16 4.23 7.45 5.94 7.80
H2O wt% 0.80 0.81 2.57 2.89 2.75
Percent of phase in bubble, relative to MI total
CO2 % in bubble 58 63 79 53 80
S % in bubble 20 70 68 5.8 84
CaO % in bubble 0.46 0.29 3.44 0.79 1.90
Fe % in bubble 1.59 6.30 0.19 14
H2O % in bubble 1.37 0.07 0.68
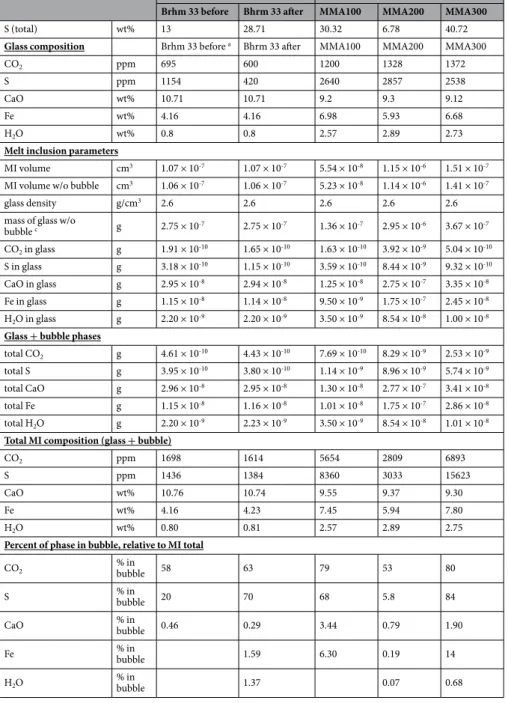
Table 1. Volumetric and elemental proportions calculated from 3D scans and ImageJ. MI refers to melt
inclusion. Volume of bubble refers to the volume calculated using the radius measured under the microscope, and assuming a spherical bubble. However, to avoid overestimation, the cumulative volumes of the solid and gas phases in the vapour bubble are considered to be more representative of the bubble volume. Volumetric proportions refer to the total space occupied by each specific phase within the bubble. Mass proportions are calculated using the density of each phase. The density of SO2 was calculated using the ideal gas law. The
quantity of each element or oxide was added to the glass total (proportions within the glass)21 to determine
the total composition of the MI, including the bubble components. For re-heated bubbles, there is a systematic increase in all elements and oxides following re-heating, providing concrete proof that elements diffuse from the glass into the bubble during re-heating. For the glassy Mount Meager MIs, the bubbles contain a significant amount of major and volatile elements, suggesting that elemental diffusion is a naturally occurring process in glassy MIs. a The concentration of CO
2 and S in the glass of Brhm-33 before re-heating was calculated using the
mass of CO2 and S that entered the vapour bubble following re-heating (Supplementary Table S2). b The peaks of
Mg-bearing carbonate were often detected, but the amount of Mg were below the detection limit. For simplicity, we assume all carbonates are CaCO3. c The mass of bubble was subtracted from the mass of the glass to calculate
S6+/∑S varies between 0.2 and 0.8, suggesting the co-existence of sulphide and sulphate species, and corresponds
to fO2 between NNO and NNO + 1.5 (Fig. 5). However, due to the presence of S-rich solids in the bubble, the
proportion of sulphate is likely much higher. Finally, the Fe3+/∑Fe, which is an additional proxy for the
oxida-tion state of magma, was calculated using the glass composioxida-tion, temperature and fO2, and ranges between 0.15
and 0.2631 (Supplementary Table S3). Such elevated ratios suggest an oxidised magma; due to re-equilibration
between the melt and the bubble through the diffusion of Fe, these values should also be considered as minimum estimates.
Does re-heating modify the composition of a melt inclusion?.
Re-heating experiments reveal new phases that form through equilibration reactions between the melt and the bubble (gas) phase. The observation of these phases helps to understand the petrology of bubbles hosted in naturally glassy MIs (Reactions 1-5; Table 2). Decompression and cooling of the magma leads to crystallisation and volatile saturation (first boiling). The stability field of anhydrite also expands to lower fO2 as pressure decreases due to oxygen consumption from themelt/glass32–35 (Reaction 1, Table 2). Following MI entrapment, decompression promotes CO
2 exsolution and
flooding of the vapour bubble, as well as anhydrite precipitation within the bubble (Reaction 1, Table 2). The natural hydration of anhydrite to gypsum occurs slowly at low temperatures (60 to 100 °C), but is accelerated at elevated temperatures25. The only source of H
2O is from the melt/glass, since no water was observed in the
bubble before re-heating (Reaction 2; Table 2). Previous observations of H2O loss from MIs during experimental
re-heating have shown that H+ rapidly diffuses from the MI through point defects in the olivine host,
contem-poraneously with fO2 equilibration with the external environment19,20,26. Our experiments, conducted at
atmos-pheric pressure, show that the melt can also lose H2O to the bubble (where it is stored as gypsum) over timescales
of <10 minutes when heated to 1200 °C, which are the experimental conditions. Extrapolation to natural mag-matic conditions suggests that H2O diffusion from the melt to the vapour bubble can occur over geologically short
timescales (e.g., during magma decompression).
The highly reducing conditions within the heating apparatus (fO2 < 10−10 atm) cause Fe diffusion and
re-equilibration from the glass to the bubble, a process termed here as “Fe-migration”, which can be rapid enough
Figure 4. Raman spectrum and horizontal sections through a 3D scan of the same vapour bubble hosted in a
glassy MI (MMA100) from Mount Meager. (a) Raman spectrum reveals that CO2 is accompanied by pyrrhotite
or pyrite (with polymorphs of marcasite), anhydrite, gypsum, and carbonate. Inset photo corresponds to the analysed vapour bubble. (b) Horizontal sections through a 3D scan of the same vapour bubble (MMA100). Pyrite and marcasite (yellow), anhydrite (light blue), and Mg-Ca-Fe carbonates (dark blue and white/grey) form a partial shell around the bubble, with some crystals elongating toward the center of the bubble. The presence of Fe sulphides in MMA100 is proof of Fe migration from the glass during natural conditions. As in Fig. 3, water is not detected in the bubbles except in the molecular form attached to gypsum. All solid phases are connected to the bubble walls. Due to the lack of evidence supporting a brine phase, the elements in the bubbles migrate from the glass, with no secondary or external sources. This also implies that the H2O, CO2, S, and Fe in the vapour
bubble represent a “loss” from the glass and are major components of the total volatile budget. Three-D scans and the horizontal sections were generated using Renishaw’s WiRE software.
to occur over timescales of <10 minutes during re-heating (Reaction 3, Table 2). The migration of Fe from the glass to the bubble is revealed by the formation of Fe-sulphides. Pyrite and marcasite are metastable polymorphs at temperatures <450 °C36. Above this temperature, only pyrite is stable. Three-D scans show the presence of
well-formed cubic pyrite, implying rapid growth during re-heating (Fig. 3b). Marcasite is only present in a few vapour bubbles and always associated with pyrite; it is often represented by broad peaks in the Raman spectra, suggesting poorly formed crystals. Mobilisation of Fe3+ leads to a significant change in fO
2. Consistent with
pre-vious findings of rapid (≤20 hours) fO2 re-equilibration during re-heating19, Fe2O3 in the glass reduces to FeO
(Reaction 3, Table 2). Coupled with the formation of anhydrite in the bubble (Reaction 2, Table 2), these reactions lead to a higher proportion of Fe2+ in the glass, thereby lowering the Fe3+/ΣFe. In such MIs, the Fe content of the
glass and the calculated fO2 is not representative of the magma at depth.
total volatile budget.
Re-heating experiments were designed to reduce water loss19,20,24, leading tonegligi-ble proportions of H2O in re-heated bubbles. Minimal water was also detected within vapour bubbles of naturally
glassy MIs (Table 1).
Focusing on MIs with 3D scans, and taking the carbonate crystals into account, the total amount of CO2 in
glassy Mount Meager MIs ranges from 2800 to 6900 ppm. Without considering the carbonates, the total MI CO2 is 2400 to 6700 ppm. Both estimates suggest an original MI internal pressure of ≥0.5 GPa28 (CO2-vapour
saturation pressure) in line with anhydrite stability32. This is significantly higher than pressure estimates based
on the glass CO2 content alone21 (max 0.4 GPa), highlighting the importance of the volatile content of the bubble.
Moreover, the slightly alkalic nature of Mount Meager basaltic magmas21 supports a higher CO
2 solubility37, and
a magmatic origin for the total CO2.
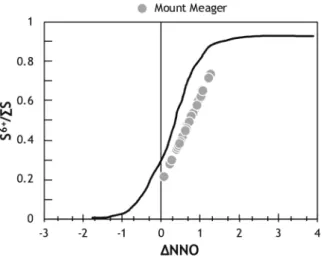
Figure 5. The speciation of sulphur within the glassy portion of Mount Meager MIs21. Represented by the
relative proportion of S6+ and the sum of S6+ and S2−, S6+/∑S is calculated from the S peak29 and shows that the
glass contains roughly equal proportions of S2− and S6+. The corresponding fO
2 was calculated from S6+/∑S29,63.
Both the S6+/∑S and the fO
2 suggest an intermediate oxygen fugacity, and a system saturated with respect to
sulphide (pyrite; S2−) and sulphate (anhydrite; S6+). However, after considering the amount of S sequestered by
the vapour bubble, we expect the S6+/∑S and fO
2 to be higher, and in favour of sulphate saturation. The black
curve corresponds to the relationship between S6+/∑S and relative oxygen fugacity (∆NNO) determined using
basaltic MIs63.
Reaction
1 FeS (sulfide,melt) + CaO (melt) + 2 O2 (melt) → CaSO4 (bubble) + FeO (melt) 2 CaSO4 (bubble) + 2H2O (melt) → CaSO4∙2H2O (bubble)
3 2FeS (melt) + Fe2O3 (melt) → FeS2 (bubble) + 3FeO (melt) 4 CaSO4 (bubble) → CaO (bubble) + SO3 (bubble)
5 CaSO4 (bubble) + CO2 (melt or bubble) → CaCO3 (bubble) + SO3 (bubble)
Table 2. Chemical reactions within the vapour bubble. Brackets on the reactants side indicate the source of
the chemical species (either the glass or the bubble) while brackets on the product side indicate the destination. Reaction 1 describes the precipitation of anhydrite within MI vapour bubbles, and the associated reduction of the glass. Reactions 2-4 explain the formation of gypsum, pyrite, SO2 gas within vapour bubbles following MI
re-heating. With the exception of Reaction 4, all reactions listed here can be extrapolated to natural conditions to explain the similar solid phase assemblage in the vapour bubbles of glassy MIs. Regardless of crystallised or glassy MIs, the formation of phases within the vapour bubble is associated with significant changes in the glass, including major and volatile elemental loss as well as a lower Fe3+/ΣFe and fO
The presence of anhydrite in Mount Cayley and Garibaldi Lake bubbles before re-heating, and in Mount Meager bubbles, implies sulphate saturation within the melt following bubble nucleation. The first observations of igneous anhydrite were from the 1982 El Chichon and the 1991 Pinatubo eruptions38,39. Experimental
investi-gations have shown that sulphates are the primary and stable S species at fO2 > NNO29,39–41. At 1 atm, anhydrite
is stable until 1200 °C at NNO -0.8 to +0.241–43, while anhydrite-saturated melts contain up to 2300 ppm S at
200 MPa, NNO and above 1000 °C41. Previous studies of primitive olivine-hosted MIs from subduction zones
have reported co-genetic anhydrite inclusions, further supporting sulphate saturation conditions of arc basalts44.
The aforementioned magmatic conditions calculated from Mount Meager MIs are likely underestimated due to the sequestration of S and Fe in the vapour bubble. Adding the sulphur from the bubble yields a total S content between 0.3 and 1.6 wt% (Table 1). Previous experiments have shown that up to 0.5 wt% S can be dissolved in oxidised basaltic melts at 500 MPa45. After considering the reduction of the melt due to Fe-migration, we estimate
that the actual fO2 of the MI would be much higher, and consistent with a basaltic melt saturated with sulphate46.
Therefore, stable anhydrite within the bubble suggests bubble nucleation between 1000 and 1200 °C32–34, which is
consistent with the calculated temperatures.
The presence of Fe-sulphides in the Mount Meager bubbles suggests Fe-migration is a naturally occurring process that is likely accelerated during re-heating experiments. Pyrite in vapour bubbles has been previously reported but as a minor constituent, and as a product of bubble-brine interaction resulting in a concentration of solid phases only at the bubble-glass rim13,16. Similarly, dehydration experiments on olivine-hosted MIs have
shown that H+ loss promotes the re-distribution of sulphur from the glass to the fluid or vapour bubble44,47. Both
hypotheses imply that sulphur within vapour bubbles is a secondary process. As a whole, the results of our exper-iments and the absence of liquid water in the bubble rule out pyrite precipitation under hydrothermal conditions. Therefore, we show that the diffusion of S from the melt, and the formation of S-bearing phases in the bubble, represents the necessary exsolution processes as the glass achieves saturation with respect to sulphate. Similar reactions have been proposed to explain the high amount of SO2 gas released during the climatic 1991 Pinatubo
eruption, where the reaction between SO2 and H2O in a magma produces sulphides, supercritical H2S fluid, and
anhydrite48. In a magma, sulphide saturation creates sulphur globules, and sulphate saturation results in anhydrite
crystallisation or SO2 gas. Our results show that significant sulphur exsolution can also occur in the MI leading to
the precipitation of S-bearing phases within the bubble.
the excess sulphur problem.
Since the 1991 Pinatubo eruption, there has been considerable attention paid to excess degassing by volcanoes49–52. Scaling the difference in sulphur between MIs (pre-degassed melt)and groundmasses (degassed melt) to the volume of erupted magma provides an estimation of the mass of sul-phur released during an eruption. Comparisons of such “petrologic” estimates with remote sensing measure-ments of SO2 emissions have shown that the concentration of pre-eruptive sulphur in MIs are commonly too
low to account for the total mass of SO2 released during an eruption46,50,53. Excess degassing has been attributed
to degassed, but non-erupted, magma, the presence of a deep sulphur-rich immiscible fluid46,51,52,54 and/or an
underestimation of the sulphur content measured in MIs52,53. Indeed, petrological estimates using bubble-bearing
MIs have only considered the sulphur dissolved in the melt/glass. The present study shows that, when using bubble-bearing MIs, the sulphur trapped within the vapour bubble reasonably accounts for the excess sulphur emitted during an eruption. The application of our findings to cases of excess degassing assumes that sulphur sat-uration was achieved, and exsolution promoted the formation of solids within the bubble. Examples of previously calculated excess degassing scenarios determined using bubble-bearing MIs include the explosive 1986 basaltic eruption of Chikurachki (Russia), which released 0.7 Mt of SO2, while the petrological estimate of SO2 was only
0.5 Mt52,54. Assuming that the vapour bubble of Chikurachki MIs contained similar quantities of sulphur to those
measured here, the total amount of sulphur would increase by up to 84%, thereby matching the amount of SO2
released during the eruption. No excess degassing would therefore be required. Conversely, the 1991 eruption of Pinatubo emitted 20 Mt of SO2 into the atmosphere, while the petrological estimate of SO2 was only 0.28 Mt38,52,55.
With 84% of sulphur in the bubble, petrological estimates only increase to 0.96 Mt. However, this eruption was dacitic and our results pertain to basaltic magma. This suggests that felsic MIs may sequester more sulphur within the vapour bubbles, which is consistent with experimental observations that show the sulphur content at sulphide saturation (SCSS) correlates positively with the glass FeO content56. Furthermore, as felsic magmas cool, they
exsolve metal-rich aqueous fluids that record the first stage in the evolution of hydrothermal fluids and ore depos-its57. As such, vapour bubbles hosted within felsic MIs are also likely to sequester chalcophile metals that partition
from the late-stage melt, and precipitate within the bubble as sub-micron scale S-rich minerals.
implications.
The evolution of magma from its source, ascent through the mantle and crust, and eruption at the surface is inevitably associated with dramatic changes in its chemistry. Olivine-hosted MIs, although record the magma composition and storage parameters at the time of entrapment, are subject to post-entrapment modi-fications, such as the nucleation of vapour bubbles and daughter crystals, that result in discordance with the orig-inal magma. Regardless of whether the MI is re-heated or naturally glassy, our study highlights the significance of the vapour bubble, and its sequestration of major and volatile elements that originate from the melt/glass.Re-heating reverses daughter crystal nucleation and yields the original MI composition. Using Raman spectros-copy and 3D scans, we show that significant compositional changes occur within the MI during re-heating. Over timescales of <10 minutes and temperatures between 400 and 1200 °C, the melt/glass can lose up to 65% CO2 and up
to 64% S to the bubble. The resulting glass composition is unrepresentative of the original magma, and yields incor-rect calculations of fO2, pressure and volatile saturation. Bubbles hosted in naturally glassy MIs contain 45 to 87% of
the total CO2 content in the bubble. Relative to the MI total, up to 84% S, 3.4% CaO, and 14% Fe is found in the
The calculated magmatic conditions for GVB magmas change significantly when considering the bubble com-position. Using the mass of CO2 in the bubble, the pressure values for both re-heated and glassy MIs increased
by 80 to 130%. Using 3D scans and adding the solid phase composition to the MI total, pressure values further increase by up to 80%. Following the reduction reactions in Table 2, we would expect the S and Fe in the bubble to be added back to the glass as their oxidised forms, thereby increasing the overall Fe3+/ΣFe and fO
2 of the MI
to be correlative with sulphate-saturation conditions. By accounting for the bubble, GVB magmas are revealed to be oxidised and sulphate saturated.
The diffusion of S from the glass poses significant implications for excess degassing: accounting for sulphur in the bubble could explain the discrepancy between the petrological method and remote sensing measurements for excess sulphur estimates based on basaltic bubble-bearing MIs.
In the case of crystallised MIs, high pressure homogenisation has the potential to yield MIs that are representa-tive of the magma at depth. Whether the MI is crystallised, re-heated or glassy, the composition of the vapour bubble should be analysed to obtain an accurate composition of the magma at MI entrapment. Overall, our study highlights the importance of the vapour bubble in MI studies as it is a hidden reservoir for major and volatile elements that contribute to the total budget, and cautions the use of re-heated MIs to be representative of the original magma.
Methods
Reheating experiments.
Individual olivine crystals from Mount Cayley and Garibaldi Lake were reheated at the Laboratoire Magmas et Volcans (LMV) in Clermont-Ferrand, France. Olivines were double polished, mounted on sapphire discs, and progressively, and rapidly, heated to a constant temperature, between 1150 and 1200 °C using a Vernadsky-type heating stage containing a 1 atm gas-tight sealed furnace cooled by water. Pure He gas, purified by Zr metal at 700 °C, was circulated through the furnace to maintain reducing conditions (fO2 < 10−10 atm) and prevent olivine oxidation. Temperatures inside the furnace were recorded by a type-Sther-mocouple welded to the sample holder. Samples were held at a given temperature for 1 minute and, as such, each experiment was approximately 10 minutes in total. Short duration experiments optimally minimise water loss due to diffusion20,24 and limit the decrease in volatile solubility that occurs due to the pressure decrease within
softened crystals at high temperature58. The maximum temperature of the re-heating apparatus was 1200 °C and,
in every case, the bubble remained, meaning a fully homogenised MI was not possible. Many apparatuses have similar maximum temperatures; therefore, the bubble likely remains in many re-heating situations. Nonetheless, the aim of the study was to investigate the composition of the vapour bubble in equilibrium with the silicate melt and, as such, the sample was rapidly quenched once the bubble began to move inside the inclusion, indicating a molten silicate melt.
Raman spectroscopy.
The composition of all vapour bubbles was analysed using Raman spectroscopy (LMV, France). In the case of Mount Cayley and Garibaldi Lake, the bubble was analysed before and after reheating in order to track any compositional changes. Spectra were collected using an InVia confocal Raman micro-spectrometer manufactured by Renishaw and equipped with a 532 nm diode laser (200 mW output power), a Peltier-cooled CCD detector of 1040 ×256 pixels, a motorised XYZ stage and a Leica DM 2500 M optical microscope. Scattered light was collected via a back-scattered geometry. Laser power was periodically checked and reduced to 8 mW on the sample surface; thus, the power was lower than this value within the bubble. A grating of 2400 grooves mm−1, a100x microscope objective and a 20-μm slit aperture (high confocality setting) were used, which resulted in spec-tral resolution better than 0.4 cm−1 and in lateral and vertical spatial resolutions of approximately 1 and 2-3 μm,
respectively, near the sample surface. Vertical resolution decreases with depth mainly due to light refraction at the air/glass/bubble interfaces. Daily calibration of the wavelength was performed based on the 520.5 cm−1 peak of Si.
The spectra were recorded using the WIRE 4.2 software in the wavenumber range 60-1410 cm−1, which includes
the vibrational frequencies characteristic for mineral phases, such as carbonates, sulphates, sulphides and silicates, for CO2 and SO2 gases59, and for the alumino-silicate network domain of glasses. Spectra were also collected in
the 2800-3900 cm−1 region to detect H
2O and/or OH molecules. Presence of thin films of liquid water inside the
bubble was difficult to detect in some bubbles, especially in the smallest ones (<10 µm), because of fluorescence or contamination of the spectrum by more intense glass water bands. Nonetheless, negligible water contents were measured. Acquisition time for a single analysis ranged between 60 and 120 seconds.
Before (3D) volume acquisitions, we performed depth profiles to define the vertical dimension of the 3D map. The selected volume was generally within 30 µm depth below the sample surface, so the signal/noise ratio remained high. The step size between acquisition points was 1-1.5 µm on the x- and y-axis and 1-2 µm on the z-axis. The total number of acquisitions for a single 3D map varied from 7000 to 16700. The acquisition time was set to 20 s/point and the spectra were centered at 850 cm−1. For spectra treatment, we first identified and
removed cosmic rays, then we carefully chose the most appropriate polynomial baseline correction and applied it to the entire dataset. Then, the main peaks that best represent the different phases were selected to build the 3D map. Due to the small size and transparency of the bubbles, the collected spectra generally show a mixture of signals coming from different phases. Therefore, for 3D reconstruction, the variation of the relative intensities of peaks belonging to different phases must be carefully evaluated to correctly assign Raman acquisitions to distinct phases. When the errors associated with 3D data acquisition, spectra treatment and subsequent calculations are considered, the estimated total error on the obtained volatile budget is <30%. This error does not include pos-sible overestimation of the volume of solid phases that is expected if the size of crystals is lower than the spatial resolution of the instrument (i.e., 1-2 μm).
calculating the co
2density.
The main gas phase is CO2 with two strong peaks at ~1284 and 1387 cm−1;calculate the density of CO261. The mass of CO2 is found by multiplying the density by the volume of the bubble
measured under the microscope. The mass fraction of CO2 in the bubble relative to the glass can be calculated
knowing the mass inside the bubble, the glass CO2 concentration, the volume of the bubble and the volume of the
MI (Supplementary Table S2). The amount of CO2 estimated using this approach, and assuming that CO2 is the
only phase present inside the bubble, can be compared to the total amount of CO2 obtained from the volumetric
analysis of the bubble, which allows quantification of both gaseous CO2 and carbonates.
Quantitative volumetric analysis.
Renishaw’s WiRE software was first used to process the acquired 3D data and create 2D slices of the bubble volume. Then, volumetric analyses were performed, and volumes were measured using ImageJ software62. The 2D slices, or cross sections, were taken at equal distances dependingon the size of the bubble (every 1 or 1.5 µm). Volumes between slices (called spherical segments) were calculated using the distance between each slice and the radius of each slice. For the top and bottom segment of the bubble (spherical cap), the volume was calculated using the equation for a hemisphere. Summing up the total volume of all spherical segments, plus the 2 spherical caps, yielded values close to volume estimates assuming a spherical bubble. In most cases, the former method yielded lower values than the latter and is considered to more accu-rately describe the exact bubble shape and volume. From here, a global scale was applied to each set of slices, and the area occupied by each phase was calculated. Finally, the percentage by volume (vol%) of a phase (mineral or gaseous) in the bubble was calculated knowing the relative area percent of that phase in each slice, multiplying it by the relative vol% of the associated spherical segment, and summing the vol% of that phase in each segment.
From the mass of the solid and gaseous phases, obtained by multiplying their volumes by appropriate density values, the total amount of CO2, H2O, S, Ca, and Fe were calculated (knowing the weight % of the
element/mole-cule in a mineral). For an element that is present in different phases (e.g., S in sulphides, sulphates and SO2, or C
in CO2 and carbonates), summing up the mass of that element in all phases yielded the total mass of the element
in the bubble (Table 1).
Details concerning Electron Microprobe and SIMS analyses can be found as Supplementary Material. The full corrected MI dataset including S, H2O and CO2 contents can be found in Supplementary Table S3.
Received: 15 January 2020; Accepted: 20 April 2020; Published: xx xx xxxx
References
1. Schiano, P. Primitive mantle magmas recorded as silicate melt inclusions in igneous minerals. Earth-Science Reviews 63, 121–144 (2003).
2. Wallace, P. J. Volatiles in subduction zone magmas: concentrations and fluxes based on melt inclusion and volcanic gas data. Journal
of Volcanology and Geothermal Research 140, 217–240 (2005).
3. Lowenstern, J. B. Highlights and Breakthroughs. Bursting the bubble of melt inclusions. American Mineralogist 100, 672–673 (2015). 4. Moore, L. R. et al. Bubbles matter: An assessment of the contribution of vapour bubbles to melt inclusion volatile budgets. American
Mineralogist 100, 806–823 (2015).
5. Steele-Macinnis, M., Esposito, R. & Bodnar, R. J. Thermodynamic Model for the Effect of Post-entrapment Crystallization on the H2O–CO2 Systematics of Vapour-saturated, Silicate Melt Inclusions. Journal of Petrology 52, 2461–2482 (2011).
6. Sides, I. R., Edmonds, M., Maclennan, J., Swanson, D. A. & Houghton, B. F. Eruption style at Kīlauea Volcano in Hawai’i linked to primary melt composition. Nature Geoscience 7, 464 (2014).
7. Aster, E. M. et al. Reconstructing CO2 concentrations in basaltic melt inclusions using Raman analysis of vapour bubbles. Journal of Volcanology and Geothermal Research 323, 148–162 (2016).
8. Hartley, M. E., Maclennan, J., Edmonds, M. & Thordarson, T. Reconstructing the deep CO2 degassing behaviour of large basaltic
fissure eruptions. Earth and Planetary Science Letters 393, 120–131 (2014).
9. Cervantes, P. & Wallace, P. Magma degassing and basaltic eruption styles: a case study of ∼2000 year BP Xitle volcano in central Mexico. Journal of Volcanology and Geothermal Research 120, 249–270 (2003).
10. Wallace, P., Kamenetsky, V. S. & Cervantes, P. Melt inclusion CO2 contents, pressures of olivine crystallization, and the problem of
shrinkage bubbles. American Mineralogist 100, 787–794 (2015).
11. Hudgins, T. R., Mukasa, S. B., Simon, A. C., Moore, G., & Barifaijo, E. Melt inclusion evidence for CO2-rich melts beneath the
western branch of the East African Rift: implications for long-term storage of volatiles in the deep lithospheric mantle. Contributions
to Mineralogy and Petrology, 169(5) (2015).
12. Esposito, R. et al. Volatile Evolution of Magma Associated with the Solchiaro Eruption in the Phlegrean Volcanic District (Italy).
Journal of Petrology 52, 2431–2460 (2011).
13. Robidoux, P., Frezzotti, M. L., Hauri, E. H. & Aiuppa, A. Shrinkage bubbles: The C-O-H-S magmatic fluid system at San Cristó bal Volcano. Journal of Petrology 59, 2093–2122 (2018).
14. Webster, J. D. Fluid-melt interactions involving Cl-rich granites: Experimental study from 2 to 8 kbar. Geochimica et Cosmochimica
Acta 56, 659–678 (1992).
15. Kamenetsky, V. S. et al. Arrival of extremely volatile-rich high-Mg magmas changes explosivity of Mount Etna. Geology 35, 255–258 (2007).
16. Esposito, R. et al. Detection of liquid H2O in vapor bubbles in reheated melt inclusions: Implications for magmatic fluid composition and volatile budgets of magmas? American Mineralogist 101, 1691–1695 (2016).
17. Kamenetsky, V. S., Davidson, P., Mernagh, T. P., Crawford, A. J. & Gemmell, J. B. Fluid bubbles in melt inclusions and pillow-rim glasses: high-temperature precursors to hydrothermal fluids. Chemical Geology 183, 349–364 (2002).
18. Kamenetsky, V. S. & Kamenetsky, M. B. Magmatic fluids immiscible with silicate melts: examples from inclusions in phenocrysts and glasses, and implications for magma evolution and metal transport. Geofluids 10, 293–311 (2010).
19. Gaetani, G. A., O’Leary, J. A., Shimizu, N., Bucholz, C. E. & Newville, M. Rapid reequilibration of H2O and oxygen fugacity in
olivine-hosted melt inclusions. Geology 40, 915–918 (2012).
20. Chen, Y., Provost, A., Schiano, P. & Cluzel, N. The rate of water loss from olivine-hosted melt inclusions. Contributions to Mineralogy
and Petrology 162, 625–636 (2011).
21. Venugopal, S. et al. Two distinct mantle sources beneath the Garibaldi Volcanic Belt: Insight from olivine-hosted melt inclusions.
Chemical Geology 532, 119346 (2020).
22. Wilson, A. & Russell, J. K. Quaternary glaciovolcanism in the Canadian Cascade volcanic arc - paleoenvironmental implications.
23. Salters, V. J. M. & Stracke, A. Composition of the depleted mantle. Geochemistry, Geophysics, Geosystems. 5 (2004).
24. Hauri, E. et al. analysis of volatiles in silicate glasses: 1. Calibration, matrix effects and comparisons with FTIR. Chemical Geology 183, 99–114 (2002).
25. Farnsworth, M. The Hydration of Anhydrite. Industrial and Engineering Chemistry 50, 967–970 (1925).
26. Hope, G. A., Woods, R. & Munce, C. G. Raman microprobe mineral identification. Minerals Engineering. 14, 1565–1577 (2001). 27. Putirka, K. D. Thermometers and Barometers for Volcanic Systems. Reviews in Mineralogy and Geochemistry 69, 61–120 (2008). 28. Papale, P., Moretti, R. & Barbato, D. The compositional dependence of the saturation surface of H2O + CO2 fluids in silicate melts.
Chemical Geology 229, 78–95 (2006).
29. Jugo, P. J., Luth, R. W. & Richards, J. P. An experimental study of the sulphur content in basaltic melts saturated with immiscible sulphide or sulphate liquids at 1300 °C and 1.0 GPa. Journal of Petrology 46, 783–798 (2005).
30. Danyushevsky, L. V., Della, F. N. & Sokolov, S. Re-equilibration of melt inclusions trapped by magnesian olivine phenocrysts from subduction-related magmas: petrological implications. Contributions to Mineralogy and Petrology 138, 68–83 (2000).
31. Kress, V. C. & Carmichael, I. S. E. The compressibility of silicate liquids containing Fe2O3 and the effect of composition, temperature,
oxygen fugacity and pressure on their redox states. Contributions to Mineralogy and Petrology 108, 82–92 (1991).
32. Matjuschkin, V., Blundy, J. D., & Brooker, R. A. The effect of pressure on sulphur speciation in mid- to deep-crustal arc magmas and implications for the formation of porphyry copper deposits. Contributions to Mineralogy and Petrology. 171 (2016).
33. Masotta, M., & Keppler, H. Anhydrite solubility in differentiated arc magmas. Geochimica et Cosmochimica Acta. 158 (2015). 34. Jugo, P. J., Wilke, M. & Botcharnikov, R. E. Sulfur K-edge XANES analysis of natural and synthetic basaltic glasses: Implications for
S speciation and S content as function of oxygen fugacity. Geochimica et Cosmochimica Acta 74, 5926–5938 (2010).
35. Webster, J. & Botcharnikov, R. Distribution of Sulfur Between Melt and Fluid in S-O-H-C-Cl-Bearing Magmatic Systems at Shallow Crustal Pressures and Temperatures. Reviews in Mineralogy and Geochemistry 73, 247–283 (2011).
36. Lennie, A. R. & Vaughan, D. J. Kinetics of the marcasite-pyrite transformation: an infrared spectroscopic study. American
Mineralogist. 77, 1166–1171 (1992).
37. Dixon, J. E. Degassing of alkalic basalts. American Mineralogist. 82, 368–378 (1997).
38. Gerlach, T. M., Westrich, H. R., and Symonds, R. B. Pre-eruption vapour in magma of the climactic Mount Pinatubo eruption: source of the giant stratospheric sulphur dioxide cloud. Fire and Mud: Eruptions and Lahars of Mount Pinatubo, Philippines (eds. C. G. Newhall & R. S. Punongbayan). Univ. Washington Press, 415-433 (1996).
39. Luhr, J. F. Experimental Phase Relations of Water- and Sulfur-Saturated Arc Magmas and the 1982 Eruptions of El Chichón Volcano.
Journal of Petrology 31, 1071–1114 (1990).
40. Carroll, M. R. & Rutherford, M. J. Sulphide and sulphate saturation in hydrous silicate melts. Journal of Geophysical Research: Solid
Earth 90, 601–612 (1985).
41. Carroll, M. R. & Rutherford, M. J. Sulphur speciation in hydrous experimental glasses of varying oxidation state; results from measured wavelength shifts of sulphur X-rays. American Mineralogist. 73, 845–849 (1988).
42. Beermann, O., Botcharnikov, R. E., Holtz, F., Diedrich, O. & Nowak, M. Temperature dependence of sulphide and sulphate solubility in olivine-saturated basaltic magmas. Geochimica et Cosmochimica Acta 75, 7612–7631 (2011).
43. Jego, S. & Dasgupta, R. The Fate of Sulphur During Fluid-Present Melting of Subducting Basaltic Crust at Variable Oxygen Fugacity.
Journal of Petrology 55, 115–141 (2014).
44. Kamenetsky, V. et al. Silicate-sulfide liquid immiscibility in modern arc basalt (Tolbachik volcano, Kamchatka): Part II. Composition, liquidus assemblage and fractionation of the silicate melt. Chemical Geology. 471, 92–110 (2017).
45. Chowdhury, P. & Dasgupta, R. Effect of sulfate on the basaltic liquidus and sulfur Concentration at Anhydrite Saturation (SCAS) of hydrous basalts – Implications for sulfur cycle in subduction zones. Chemical Geology. 522, 162–174 (2019).
46. Andres, R. J. et al. Excessive sulphur dioxide emissions from Chilean volcanoes. Journal of Volcanology and Geothermal Research 46, 323–329 (1991).
47. Bucholz, C. E., Gaetani, G. A., Behn, M. D. & Shimizu, N. Post-entrapment modification of volatiles and oxygen fugacity in olivine-hosted melt inclusions. Earth and Planetary Science Letters 374, 145–155 (2013).
48. Borisova, A.Y., et al H2O–CO2–S fluid triggering the 1991 Mount Pinatubo climactic eruption (Philippines). Bulletin of Volcanology, 76, (2014.)
49. Wallace, P. J. Volcanic SO2 emissions and the abundance and distribution of exsolved gas in magma bodies. Journal of Volcanology and Geothermal Research 108, 85–106 (2001).
50. Keppler, H. Experimental Evidence for the Source of Excess Sulfur in Explosive Volcanic Eruptions. Science. 284, 1652–1654 (1999). 51. Luhr, J. F., Carmichael, I. S. E. & Varekamp, J. C. The 1982 eruptions of El Chichón Volcano, Chiapas, Mexico: Mineralogy and
petrology of the anhydrite bearing pumices. Journal of Volcanology and Geothermal Research 23, 69–108 (1984).
52. Shinohara, H. Excess Degassing From Volcanoes And Its Role on Eruptive and Intrusive Activity. Review of Geophysics. 46 (2008). 53. Wallace, P. J. From mantle to atmosphere: magma degassing, explosive eruptions, and volcanic volatile budgets. Developments in
Volcanology 5, 105–127 (2003).
54. Gurenko, A., Belousov, A., Trumbull, R. & Sobolev, A. Explosive basaltic volcanism of the Chikurachki volcano (Kurile arc, Russia): Insights on pre-eruptive magmatic conditions and volatile budget revealed from phenocryst-hosted melt inclusions and groundmass glasses. Journal of Volcanology and Geothermal Research 147, 203–232 (2005).
55. Bluth, G. J. S., Doiron, S. D., Schnetzler, C. C., Krueger, A. J. & Walter, L. S. Global tracking of the SO2 clouds from the June, 1991
Mount Pinatubo eruptions. Geophysical Research Letters 19, 151–154 (1992).
56. Jugo, P. J. Sulphur content at sulphide saturation in oxidized magmas. Geology. 37, 415–418 (2009).
57. Davidson, P. & Kamenetsky, V. Primary aqueous fluids in rhyolitic magmas: Melt inclusion evidence for pre- and post-trapping exsolution. Chemical Geology. 237, 372–383 (2007).
58. Schiavi, F., Provost, A., Schiano, P. & Cluzel, N. P–V–T–X evolution of olivine-hosted melt inclusions during high-temperature homogenization treatment. Geochimica et Cosmochimica Acta 172, 1–21 (2016).
59. Frezzotti, M. L., Tecce, F. & Casagli, A. Raman spectroscopy for fluid inclusion analysis. Journal of Geochemical Exploration 112, 1–20 (2012).
60. Kawakami, Y., Yamamoto, J. & Kagi, H. Micro-Raman Densimeter for CO2 Inclusions in Mantle-Derived Minerals. Applied
Spectroscopy. 57, 1333–1339 (2003).
61. Wang, X. et al. Raman spectroscopic measurements of CO 2 density: Experimental calibration with high-pressure optical cell (HPOC) and fused silica capillary capsule (FSCC) with application to fluid inclusion observations. Geochimica Et Cosmochimica
Acta 75, 4080–4093 (2011).
62. Schneider, C., Rasband, W. & Eliceiri, K. NIH Image to ImageJ: 25 years of image analysis. Nature Methods. 9, 671–675 (2012). 63. Metrich, N. & Clocchiatti, R. Sulfur abundance and its speciation in oxidized alkaline melts. Geochimica et Cosmochimica Acta 60,
4151–4160 (1996).
Acknowledgements
We would like to thank E. Koga and N. Cluzel for use of the re-heating apparatus at L.M.V., and N. Vigouroux-Callibot and J.Lowenstern for their valuable advice. This is a ClerVolc contribution n. 410.
Author contributions
S.V. and N.B.-C. came up with the idea for the project together. S.V. designed and conducted the re-heating experiments, helped with the 3D scans, and wrote a large portion of the paper. S.V. and F.S. acquired the Raman spectra for all vapour bubbles together. F.S. performed the 3D scans of the bubbles, compiled the spectra into the 3D images, wrote the methods section concerning the Raman analyses and 3D scans, helped interpret the data and extensively reviewed and corrected the paper. S.M. focused on the sulphur section of the paper, helped with the chemical equations, data interpretation and extensively reviewed and corrected the paper. N.B.-C. provided guidance concerning the Fe ratio and oxygen fugacity equilibration, helped with balancing the chemical equations, and provided many helpful revisions for the paper. T.D. provided valuable revisions, helped interpret the data, improved the structure of the paper and helped with the calculations concerning the mass balance of CO2 in each melt inclusion. G.W.-J. provided valuable revisions and helped with the overall style and structuring
of the paper.
competing interests
The authors declare no competing interests.
Additional information
Supplementary information is available for this paper at https://doi.org/10.1038/s41598-020-65226-3.
Correspondence and requests for materials should be addressed to S.V.
Reprints and permissions information is available at www.nature.com/reprints.
Publisher’s note Springer Nature remains neutral with regard to jurisdictional claims in published maps and
institutional affiliations.
Open Access This article is licensed under a Creative Commons Attribution 4.0 International
License, which permits use, sharing, adaptation, distribution and reproduction in any medium or format, as long as you give appropriate credit to the original author(s) and the source, provide a link to the Cre-ative Commons license, and indicate if changes were made. The images or other third party material in this article are included in the article’s Creative Commons license, unless indicated otherwise in a credit line to the material. If material is not included in the article’s Creative Commons license and your intended use is not per-mitted by statutory regulation or exceeds the perper-mitted use, you will need to obtain permission directly from the copyright holder. To view a copy of this license, visit http://creativecommons.org/licenses/by/4.0/.