HAL Id: hal-00787983
https://hal.archives-ouvertes.fr/hal-00787983
Submitted on 13 Feb 2013
HAL is a multi-disciplinary open access
archive for the deposit and dissemination of sci-entific research documents, whether they are
pub-L’archive ouverte pluridisciplinaire HAL, est destinée au dépôt et à la diffusion de documents scientifiques de niveau recherche, publiés ou non,
M.R. Khaledian, J.C. Mailhol, P. Ruelle, C. Dejean
To cite this version:
M.R. Khaledian, J.C. Mailhol, P. Ruelle, C. Dejean. Effect of cropping strategies on irrigation water productivity of durum wheat. Plant, Soil and Environment, Czech Academy of Agricultural Sciences, 2012, 59 (1), p. 29 - p. 36. �hal-00787983�
Effect of cropping strategies on the irrigation water productivity of durum wheat
Khaledian, MRa, b; Mailhol, JCa; Ruelle, Pa; Dejean, Ca
a
Irstea, UMR G-EAU, Montpellier, France
b
Faculty of Agricultural Sciences, University of Guilan, Rasht, Iran
khaledian@guilan.ac.ir
Abstract
The interest of irrigation for durum wheat is often questionable because of possible spring rainfalls in the SE of France. In this study cropping strategies i.e. plant density (PD), sowing date and irrigation management were analysed for improving irrigation water productivity (IWP). An experiment was carried out for calibrating and validating PILOTE model. An adaptation of the potential harvest index to PD was implemented in PILOTE. The latter satisfactory simulates different model outputs with coefficients of efficiency greater than 0.97. The model was employed for simulating the impact of cropping strategies on IWP for a long climatic series. According to model simulations, the necessity of irrigation is questionable under our conditions. IWP was notably lower under high PD than under low PD for the same sowing date. Under low PD and without irrigation it would be possible to obtain a yield similar to that obtained under high PD with irrigation.
Keywords: Water scarcity, plant density, harvest index, irrigation water productivity, crop
model
1. Introduction
Water demand growth in urban, industrial, agricultural and environmental sections creates more competition for the limited and degraded water resources. Hence, it is crucial to plan accurately water resources distribution and allocation to attain sustainable agriculture. Where pests and diseases are controlled, and nitrogen is not a limiting factor, water management is the main factor influencing yield for a given environment. Crop models can help us to test different cropping strategies. Model simulations under various climatic conditions can help us to identify the best crop management (Maraux et al. 2004). Jamieson et al. (1998) believe that developing empirical models provide a good basis for decision support at the farm level by providing quick estimations of the likely costs and benefits of farm management decisions. Models that satisfactorily simulate the impacts of water stress on yield can be reliable tools in irrigation management (Cavero et al. 2000). In comparison to other crop models, PILOTE (Mailhol et al., 1997) requires a low number of input data to simulate the yield response to water.
Durum wheat is one of the main crops cultivated in the Mediterranean regions, but the interest of irrigation for this crop is often questionable. This is because of possible rainfalls during spring, the access to water and the irrigation costs. Whatever the specificity of the context, water scarcity is a characteristic of the Mediterranean regions that encourages the evaluation of cropping strategies which can improve the irrigation water productivity (IWP). Little studies dealt with the impact of plant density on the harvest index (HI) and on water consumption more especially for durum wheat. The water productivity of sweet sorghum was studied in relation to plant density (Dalianis et al. 1996). It was found that decreasing plant density increased water productivity in a Mediterranean climate. Lamm et al. (2009) found that increasing plant density from 66300 to 82300 plants/ha generally increased grain yield and water productivity of corn. The results of another study conducted on corn showed that HI decreased when plant density increased (Reddy et al. 1987), where it is evidence that LAI increases with plant density as attested by the studies on the architectural plant growth models, (Cournède 2009; Mailhol et al. 2011). Recently, Jamaati-e-Somarin et al. (2010)
significant decrease of HI with plant density for a N application level of 180 Kg/ha, the dose generally applied by farmers in the SE of France. Same results were obtained for sorghum by
Ismail and Ali (1996). In contrast, Puckridge and Donald (1967) showed that plant density has little impact on the harvest index, the latter decreasing at a rate of 0.01 when doubling plant density. Many studies highlighted the great impact of water and fertilization on the total dry matter production and on HI (Merah 2001; Khaledian et al. 2009; Jamaati-e-Somarin et al. 2010; Khaledian et al. 2010 and 2011). In cereals, low rate of seed is proposed to prevent high competition for light and water. With increasing plant density, delay in flowering, earring and decrease in reproductive period length is deserved (Daynard and Muldoon 1983; Panahyan-e-kivi et al. 2010). Uhart and Andrade (1995) suggested that decrease in soluble carbohydrates remobilization as a result of shading may be attributable to growth decrease and lower physiological demand for assimilates. Competition for light seems to be determinant in the allocation process of the energy capture to the different plant organs (Fisher and Wilson 1975). This problem can be analysed using appropriate model as functional and structural plant models although modelling efforts are still required (Cournède et al. 2007). Field experiments, however demonstrated a strong negative relationship (r=-0.60) of HI with both plant height and leaf length (Donald and Hamblim 1971; Singh and Stoskopf 1971). Such a statement suggests that HI is negatively correlated with LAI of an individual plant and by extension to LAI from a general point of view.
The objective of this study was to evaluate the impact of PD on IWP improvement for durum wheat in a Mediterranean climate, SE of France. For that, empirical relationships were established between HI and LAI and implemented in the crop model PILOTE for simulating the impact of sowing PD with sowing date and irrigation strategies on IWP. Optimizing cultural management practices will be a key factor in managing crop production.
2. Material and methods
2.1. Field experiments
The field experiments were carried out on a loamy soil plots (20% clay, 47% silt, 33% sand) located at the Irstea research institute of Montpellier (SE of France). Soil water content at field capacity is in average of 0.29 cm3/cm3 and which at wilting point is taken at 0.12 cm3/cm3. The average annual rainfall is 780 mm/year. Evapotranspiration calculated by Penman equation (1948) exceeds the whole year rainfall under this Mediterranean climate, being 870 mm/year. These climate data were monitored at a weather station situated in the experimental station. Some climatic data are presented in Fig. 1.
0
5
10
15
20
25
0
20
40
60
80
100
120
140
160
Jan
Fe
b
Ma
r
Ap
r
Ma
y
Ju
n
Ju
l
Au
g
Se
p
Oc
t
No
v
De
c
T
em
p
erat
u
re (
C)
Ra
in
fa
ll
(
m
m
)
Rainfall (mm)
Tmean (
C)
Fig 1. Average monthly main temperature (Tmean, ºC) and rainfall (mm) at Irstea
(1991-2011)
Durum wheat was sown at different dates and density (Table 1) for four contrasted climatic campaigns: 2004-2005; 2005-2006; 2008-2009; 2009-2010, the driest being that of 2005-2006 when total rainfall was 271 mm during the cropping season. Fertilization doses were adapted to plant requirements and initial soil N content. The average doses were of 180 kg N/ha. Nitrogen content in the plant was measured at harvest (Table 2). To determine the grain yield (GY) and dry matter yield (DM) ten 3 m2 sub-plots were hand harvested (Table 1).
Table 1. Yields (the first line: DM and the second line: GY at 15% of humidity) for the
different treatments with number of irrigation (I and I* for conventional tillage and direct seeding into mulch, respectively, in 2009-2010 season), sowing dates, plant density (Pl/m²) maximum LAI value (LAIX) and potential harvest index (HIpot)
Crop seasons Grain yield (Mg/ha) Dry matter (Mg/ha)
Irrigation Sowing dates (DOY) Plant density (Pl/m2) LAIx (m2/m2) HIpot 2004-05 4.7 9.6 0 321 250 3.9 0.47 7.5 13.7 3I 321 300 3.9 0.47 6.3 12.4 2I 321 300 3.9 0.47 5.4 10.5 1I 321 250 3.9 0.47 3.7 6.7 0 321 200 3 0.5 2005-06 6 9.6 3I 321 200 3 0.5 5.4 10.6 1I 321 250 3 0.5 2008-09 5 8.8 0 305 225 3.6 0.5 2009-10 5.8 13.6 0 312 400 5 0.37 6.9 14.5 2I 312 400 5 0.37 5.9 13.4 1I 312 400 5 0.37 6.3 15 1I* 289 400 5 0.38
Leaf Area Index (LAI) was measured using a LI-COR LAI 2000 approximately each week when possible. The evolution of the soil water content from 0 to 2 m was monitored using a neutron probe while mercury tensiometers installed at different depths allowed the
monitoring of the zero flux plan positions, an indicator of the front root position during periods without water transfer trough the root zone which can be provoked by heavy rains or irrigations. Irrigation consisted into water applications depths of 25 to 30 mm delivered by a travelling rain gun system.
2.2 Modelling
PILOTE is an operative crop model that simulates soil water balance and crop yield at a daily time step by association of a soil module and a crop module, under the assumption of water being the only limiting factor affecting on crop growth and yield. The soil module consists of a 3-reservoirs system (Mailhol et al. 1997) covering a layer from the soil surface until the maximum rooting depth. A shallow reservoir, R1 with a depth of 10 cm rules the
water balance at the soil surface, in which evaporation is governed by current LAI acting on the partitioning coefficient between transpiration and evaporation. The following reservoir, R2
accounts for root section, so its capacity increases with root growth. Before the potential root area is totally taken by the second reservoir, the third reservoir represents the remaining part. Water is first taken from the shallow reservoir until total depletion by evaporation and plant uptake then, from the second one by plant only. On the basis of field capacity and wilting point, the soil water balance among reservoirs is thus calculated. Maximum evapotranspiration (MET) and actual evapotranspiration (AET) are involved in the water stress index (WSI) calculation. MET is derived from MET=Kc.ET0, where ET0 is the
reference evapotranspiration and Kc, the crop coefficient as a function of LAI. Under water
stress conditions, AET linearly decreases from MET with the depletion level of R2. Then,
WSI, obtained accordingly to this lumped plant uptake approach, is exported to the crop module as an environment coefficient.
The crop module is based on the LAI simulation and its response to WSI. The simulation involves two shape parameters and a vegetative stage parameter (Tm) corresponding to the
temperature sum when the maximum LAI (LAIx) reached. Tm and LAIx can be derived from
the literature or measured in the field. Dry mater is calculated based on Beer’s law, RUE (the radiation use efficiency) being affected by WSI. Grain yield is evaluated by the product of DM by a harvest index (HI). HI is set to a potential value (HIpot) if average LAI (LAIav) from
the stage “grain filling” (controlled by Ts1) to the stage of ‘”pasty grain” (controlled by Ts2) is
greater than a threshold value (LAIst), otherwise it linearly decreases (Mailhol et al. 2004;
Khaledian et al. 2009). The required climatic data are precipitations, global radiation, average temperature and ET0.
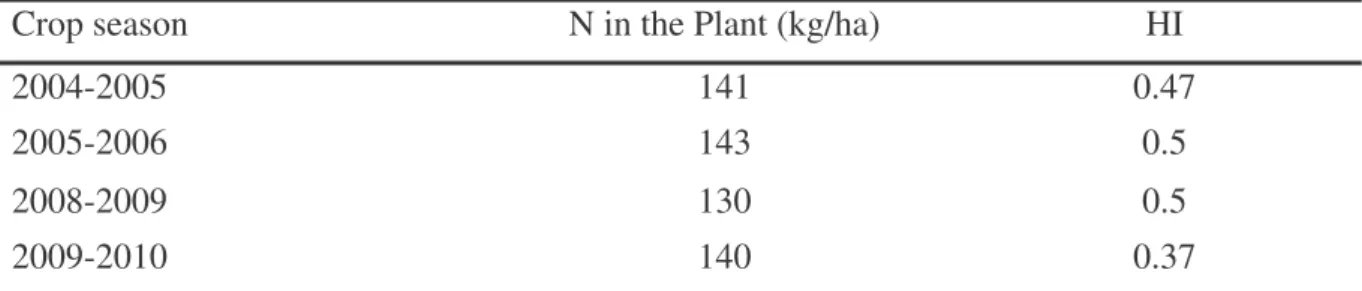
Table 2: Plant N content at harvest with measured HI
Crop season N in the Plant (kg/ha) HI
2004-2005 141 0.47
2005-2006 143 0.5
2008-2009 130 0.5
2009-2010 140 0.37
PILOTE accounts for plant density impact on LAIX and on HIpot using empirical
relationships. That concerning LAI which was calibrated on corn and gave satisfactory results (Khaledian et al. 2009). The adapted maximum LAI value to a given plant density is:
LAIX = LAIref (PD/PDref)0.6 (1)
, where LAIref is the maximum reference LAI value measured for the reference plant density
(PDref).
For the specificity of durum wheat, the following relationship is proposed for adapting potential harvest index of durum wheat (HIpdw) to plant density:
HIpdw = HIpot.(3.5/LAIX) 0.6 (2)
It was calibrated and validated from data of Table 1. This empirical formulation restricts the domain of application to the experimental conditions i.e.: a maximum LAI of 5 obtained for PD = 400.
According to data of Table 2, it does not seem that any link could be established between the N amounts in the plant and the HI values. Thus, attributing a significant link between LAIx and HIpot seems to be a realistic assumption, LAIx in 2009 and 2010 have being
measured in unstressed treatments.
At last to account for a water stress impact, the following equation, used in the classical PILOTE version model (Khaledian et al. 2009), is proposed:
HI =Min [HIpot; (HIpot - ar.(LAIst - LAIav)] (3)
, where: Min: minimum
Hipot: potential harvest index
ar: a calibration parameter for simulating water stress impact on HI
LAIst: LAI threshold value under which HIpot is affected by water stress (m2/m2)
LAIav: averaged LAI values calculated between Ts1 and Ts2 (m2/m2), the beginning and the
end of critic phase, respectively (°C day)
To obtain grain yield, HI should be multiplied in dry matter. HI is set to 0.5 or very close to 0.5 for many crops. It is correct for non sensitive crops to water stress, but not suitable for other crops e.g. wheat being sensitive to water stress. So that equation 3 can demonstrate the impact of water stress on HI.
Irrigation water productivity (IWP) can be defined (Mailhol et al. 2011) as:
I WAD GY GY WP= − r (4)
, where GY and GYr are grain yields in kg/ha under irrigation and under rainfed conditions,
respectively. WAD is the water application depth in m3/ha; so IWP will be in kg/m3.
The root mean squared error (RMSE) and the prediction efficiency of model (Ce) proposed by
Nash and Sutcliffe (1970) were used to evaluate grain yield (GY) and soil water reserve (SWR) simulations in comparison with measured values.
To compare statistically model simulation results in different treatments, paired samples t test in SPSS software package was used.
3. Results and discussion
3.1. Model verification
The identified phenological stages were considered with base temperature Tb = 0.0:
Tm=1700 °C, Ts1=1300 °C, Ts2=2100 °C and Tmat=2400 °C. LAIX=5 was measured for a plant
density of 400 pl/m2. The radiation use efficiency, RUE=1g/MJ/cm2 was derived from previous findings (Mailhol et al. 2004; Khaledian et al. 2009) as well as ar=0.15 and
tensiometer readings plant uptakes water until Px=1.2 m, considered here as the maximum
depth reached by roots.
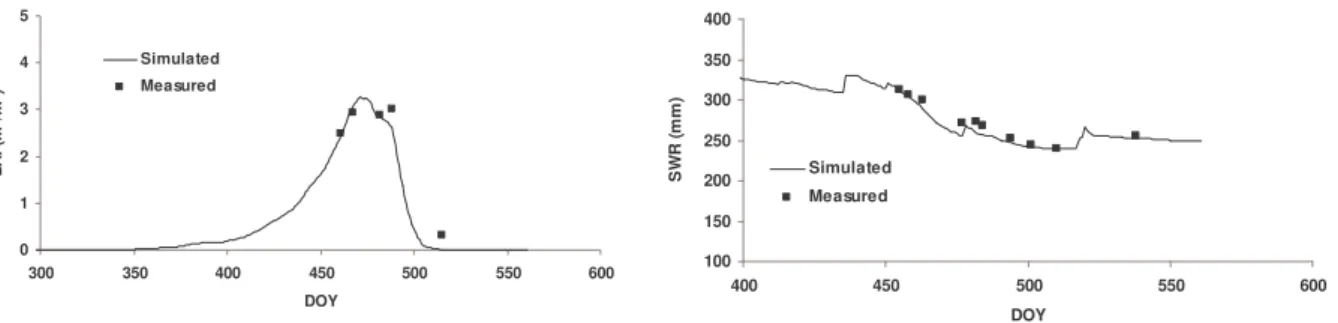
As shown by Fig.2 and Fig.3, LAI and SWR i.e. the soil water reserve on Px, calculated
by = ³ Px dz z SWR 0 ) (
θ
, are well simulated in 2008-2009 and 2009-2010 crop seasons with theLAI shape parameters calibrated in 2005.
0 1 2 3 4 5 300 350 400 450 500 550 600 DOY LA I ( m 2/m 2) Simulated Measured 100 150 200 250 300 350 400 400 450 500 550 600 DOY SW R ( m m ) Simulated Measured
Fig. 2: Simulation of LAI and SWR in 2008-2009 with the Ce and RMSE criteria (LAI:
Ce=0.986 and RMSE=0.13 m2/m2; SWR: Ce=0.875 and RMSE=11.47 mm).
0 1 2 3 4 5 300 350 400 450 500 550 600 DOY LA I ( m 2/m 2) Simulated Measured 100 150 200 250 300 350 400 400 450 500 550 600 DOY S W R ( mm) Simulated Measured
Fig. 3: Simulations of LAI and SWR in the rainfed treatment in 2010 with the Ce and RMSE
criteria (LAI: Ce=0.962 and RMSE=0.31 m2/m2; SWR: Ce=0.988 and RMSE=6.7 mm).
0 1 2 3 4 5 300 350 400 450 500 550 600 DOY LA I ( m 2/m 2) simulated Measured 100 150 200 250 300 350 400 400 450 500 550 600 DOY S W R (m m ) Simulated Measured
Fig. 4: Simulations of LAI and SWR in an agricultural field (WAD = 43 mm on 05/18) in
2010-2011 crop season (LAI: Ce=0.676 and RMSE=0.53 m2/m2; SWR: Ce=0.962 and
0 1 2 3 4 5 300 350 400 450 500 550 600 DOY LA I ( m 2/m 2) Simulated Measured 100 150 200 250 300 350 400 400 450 500 550 600 DOY S W R (m m ) Simulated Measured
Fig. 5: Simulations of LAI and SWR in a rainfed agricultural field in 2010-2011 crop season
(LAI: Ce=0.952 and RMSE=0.21 m2/m2; SWR: Ce=0.870 and RMSE=9 mm).
0 5 10 15 20 0 5 10 15 20 Si m u la te d da ta (Mg /h a )
Observed data (Mg/ha)
Irstea -DM Mont-DM Irstea -GY Mont-GY
Fig. 6: Dry matter (at the Irstea institute (Irstea-DM) and in Montpellier (Mont-DM)) and GY
((at the Irstea institute (Irstea-GY) and in Montpellier (Mont-GY)) of durum wheat simulated by PILOTE in the different treatments for four crop seasons at Irstea institute as well as in two agricultural fields in 2010-2011 crop season in Montpellier (Ce=0.997 and RMSE=0.54 Mg/ha)
In this study, to evaluate the performance of PILOTE model out of our experimental conditions, the results of 2010-2011 cropping season in two agricultural fields located at Montpellier are compared with model simulations (Fig. 4 and Fig. 5). All measurements and treatments were the same as in experimental station.
The yields of the different treatments in the experimental station of Irstea (in 2004-2005, 2005-2006, 2008-2009 and 2009-2010 crop seasons) and in agricultural fields (in 2010-2011 crop season) are fairly well simulated by the model PILOTE as shown by Fig. 6.
3.2. Model application
The model can now be used for simulating the impact of cropping strategies on IWP for a climatic series of 19 years. These cropping strategies refer to sowing date, plant density and irrigation management. The latter consists in delivering a WAD of 35 mm when the easily available water reserve is depleted. Regarding plant density, obviously it is assumed that all the seeds will emerge, our objective being mainly to highlight the role of a cropping practice and not to predict exactly a GY value for a given year.
Definitely, a later sowing requires much water than an earlier one which results in a lower IWP value. Consequently, assuming that water is the sole limiting factor from Table 3, the following statements can be established:
1-According to model simulations the necessity of irrigation is indeed questionable under the pedo-climatic context of our experimental field. Yield under rainfed condition and low plant density is of 7.6 Mg/ha (Coefficient of Variation, CV=11%). Every other year irrigation can be avoided under low density. In average, 2 years out of 3 with a WAD of 35 mm only it is possible to obtain a GY value of 8.3 Mg/ha (CV=6.7%) at low density compared with a GY of 7.3 Mg/ha (CV=7.7%) obtained with high PD (the difference is very significant or probability value, P=0.000). Whatever the cropping practices, irrigation secures the production since the CV values are lower than which obtained under rainfed condition.
2- WP is notably lower under high density than under low density for a same sowing date (the difference is significant or P=0.027). This is due to the fact that water consumption increases with PD increase and that HIpot decreases when PD increases
3- In average, under high PD, a supplementary WAD is necessary 1 year out of 3. 4- Under a low PD (250 Pl/m2) and without irrigation, it would be possible to obtain a GY value similar to that obtain under high PD with irrigation (the difference is not significant or P=0.185).
5-The sowing date plays an important role in water saving. Indeed the highest WP (1.53 kg/m3, CV=27%) values are obtained when durum wheat is sown on October the 15th compared with durum wheat sown on November the 15th (1.48 kg/m3, CV=38%), which requires more frequent water applications.
6-GY, GYr and IWP are significantly higher with 250 pl/m2 than 400 pl/m2,
respectively, whereas WAD is significantly lower with 250 pl/m2 (P<0.05).
It is clear that DM under high PD is higher than DM under low PD for the same WAD and fertilization conditions. Regarding GY, it was assumed that nitrogen did not have any impact on the measured HIpot values, as attested by Table 2. Further field and model
simulation studies are probably needed to reinforce this assumption. Model application on a climatic series allowed the evaluation of IWP gaps between cropping practices. It clearly appears that it is not recommended to growth durum wheat at a high plant density in a water scarcity context. It is suitable to sow at mid October than past mid November to save water in a Mediterranean climate with water deficiency.
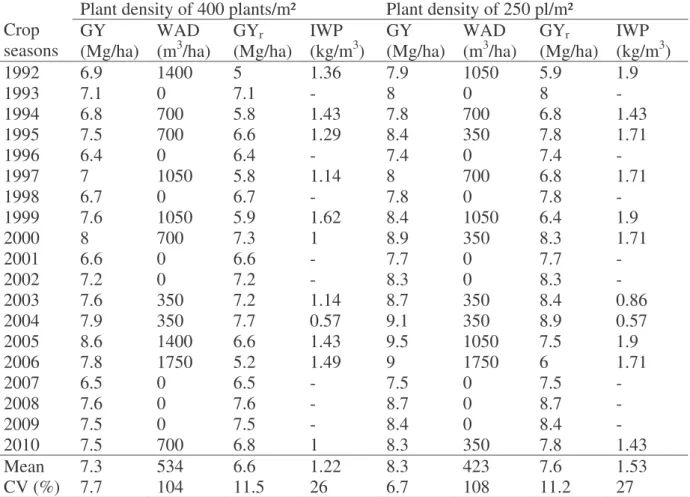
Table 3. Impacts of plant density on simulated grain yield (GY), water application depth (WAD), rainfed grain yield (GYr) and water productivity (WP) of durum wheat at Montpellier
(SE of France), for the sowing date: October the 15th or DOY: 288. Crop
seasons
Plant density of 400 plants/m² Plant density of 250 pl/m²
GY (Mg/ha) WAD (m3/ha) GYr (Mg/ha) IWP (kg/m3) GY (Mg/ha) WAD (m3/ha) GYr (Mg/ha) IWP (kg/m3) 1992 6.9 1400 5 1.36 7.9 1050 5.9 1.9 1993 7.1 0 7.1 - 8 0 8 - 1994 6.8 700 5.8 1.43 7.8 700 6.8 1.43 1995 7.5 700 6.6 1.29 8.4 350 7.8 1.71 1996 6.4 0 6.4 - 7.4 0 7.4 - 1997 7 1050 5.8 1.14 8 700 6.8 1.71 1998 6.7 0 6.7 - 7.8 0 7.8 - 1999 7.6 1050 5.9 1.62 8.4 1050 6.4 1.9 2000 8 700 7.3 1 8.9 350 8.3 1.71 2001 6.6 0 6.6 - 7.7 0 7.7 - 2002 7.2 0 7.2 - 8.3 0 8.3 - 2003 7.6 350 7.2 1.14 8.7 350 8.4 0.86 2004 7.9 350 7.7 0.57 9.1 350 8.9 0.57 2005 8.6 1400 6.6 1.43 9.5 1050 7.5 1.9 2006 7.8 1750 5.2 1.49 9 1750 6 1.71 2007 6.5 0 6.5 - 7.5 0 7.5 - 2008 7.6 0 7.6 - 8.7 0 8.7 - 2009 7.5 0 7.5 - 8.4 0 8.4 - 2010 7.5 700 6.8 1 8.3 350 7.8 1.43 Mean 7.3 534 6.6 1.22 8.3 423 7.6 1.53 CV (%) 7.7 104 11.5 26 6.7 108 11.2 27 4. Conclusion
PILOTE, an operative crop model has shown its capabilities to predict the yields of durum wheat for different plant densities. A limitation of this approach resides in the fact that plant density cannot be exactly predicted from the initial seed density adopted by the farmer although a good soil preparation insures a level of germination generally greater than 90%. Another limitation results from the empirical formulation adopted for predicting HIpot. But we
have to point out that harvest index is not always accurately predicted for field crops by Process Based Models (Marcelis et al. 1998; Nemeth 2001; Marcelis and Heuvelink 2007) a model category to which PILOTE belongs. Further works are required for improving the predictability of HIpot by integrating for instance new information from genetic (Hammer et
al. 2010; Lizaso et al. 2011) or by coupling with other crop growth models such as functional structural plant models based on sophisticated allocation functions (Feng 2011).
Having said that, an application of this adapted version of PILOTE have been carried out for identifying the best cropping strategy for a climatic series in a Mediterranean climate on a loamy soil. The results of these application showed that irrigation is far to be always necessary in the context of SE France. Indeed, an average grain yield value of 7.6 Mg/ha can be obtained under rainfed conditions at low plant density (250 pl/m2) and no nitrogen stress, a similar value obtained at high plant density by irrigation, the role of which being to reduce the inter-annual variability. In a perspective of irrigation profitability, every other year irrigation can be avoided under low plant density. Under such a climate, sowing at mid October instead of mid November results in significant water savings. The highest irrigation water
productivity (IWP=1.53 kg/m3, CV=27%) is obtained when durum wheat is sown on October the 15th compared with durum wheat sown on November the 15th (1.48 kg/m3, CV=38%) which requires more frequent water applications. The role of direct seeding into mulch as realised in this experimentation have to be taken into account for early sowing. Similar studies could be performed under other environmental (soil and climate) contexts for improving durum wheat cropping and its irrigation management.
References
Cavero J., Farre I., Debaeke P., Faci J.M. (2000): Simulation of maize yield under water stress with the EPICphase and CROPWAT models. Agronomy Journal, 92: 679-690. Cournède P.H., Mathieu A., Houllier F., Barthelemy D., De Reffy P. (2007): Computing
competition for light in the GreenLab model of plant growth: A contribution to the study of effect of density on resource acquisition and architectural development. Annals of Botany, 1-13, 2007.
Cournède P.H. (2009): Dynamics system of plant growth. HDR document, University of Montpellier II. 200p. (In French).
Dalianis C., Alexopoulou E., Dercas N., Sooter C. (1996): Effect of plant density on growth, productivity and sugar yields of sweet sorghum in Greece. Biomass for Energy and Environment. Proc. 9th European biomass conference. Ed. Chartier et al., Pergamon. Press, Oxford, UK, pp. 582-587.
Daynard T.B., Muldoon J.F. (1983): Plant to plant variability of maize plants grown at different densities. Canadian Journal of Plant Science, 63: 45-59.
Donald C.M., Hamblin J. (1971): The biological yield and harvest index of cereals as Agronomic and plant breeding criteria. Advance in Agronomy, 28: 361-405.
Feng L. (2011): Connection between plant community dynamics models and architectural-functional plant models- the Green-Lab case. PhD University of Montpellier II. Nov 17th, 117p.
Fisher K.S., Wilson G.I. (1975): Studies of grain production in sorghum bicolor (L). Moench).V. Effect of planting density on growth and yield. Australian Journal of Agricultural Research, 26: 31-41.
Hammer G., Ooterom E.V., McLean G., Chapman S., Broad I., Harland P., Muchow R. (2010): Adapting APSIM to model the physiology and genetics of complex adaptive traits in field crops. Journal of Experimental Botany, 61: 2185-2202.
Ismail A., Ali A.H. (1996): Plant population density effects on yield of sorghum grown in dry–land farming system. Qatar University Science Journal, 16(1): 89-93.
Jamaati-e-Somarin S., Zabihi-e-Mahmoodabad R., Yari A., Khayatnezhad M., Gholamin R. (2010): Effect of nitrogen fertiliser levels and plant density on some physiological traits of durum wheat. American-Eurasian Journal of Agricultural and Environmental Science, 9(2): 121-127.
Jamieson P.D., Porter J.R., Goudriaan J., Ritchie J.T., van Keulen H., Stol W. (1998): A comparison of the models AFRCWHEAT2, CERES-Wheat, Sirius, SUCROS2 and SWHEAT with measurements from wheat grown under drought. Field Crops Research, 55(1-2): 23-44.
Khaledian M.R., Mailhol J.C., Ruelle P., Rosique P. (2009): Adapting PILOTE model for water and yield management under direct seeding system (DSM). The case of corn and durum wheat in mediterranean climate. Agricultural Water Management, (96): 757-770.
Khaledian M.R., Mailhol J.C., Ruelle P., Mubarak I., Maraux F. (2010): Nitrogen balance and irrigation water productivity for corn, sorghum and durum wheat under direct seeding into mulch when compared with conventional tillage in the south-eastern France .Irrigation Science, 29(5): 413-422.
Khaledian M.R., Mailhol J.C., Ruelle P., Mubarak I. (2011): Impacts of direct seeding into mulch on the yield, water use efficiency and nitrogen dynamics for corn, sorghum and durum wheat. Irrigation and Drainage, 61: 398-409.
Lamm F.R., Aiken R.M., Abou Kheira A.A. (2009): Corn yield and water use characteristics as affected by tillage, plant density and irrigation. Transactions of the ASABE, 52(1): 133-143.
Lizaso J.I., Boote K.J., Jones J.W., Porter C.H., Echarte L., Westgate M.E., Sonohat G. (2011): CSM-IXIM: a new maize simulation model for DSSTAT Version4.5. Agronomy Journal, 103: 766-779.
Mailhol J.C., Olufayo O., Ruelle P. (1997): Sorghum and sunflower evapotranspiration and yield from simulated leaf area index. Agricultural Water Management, 35: 167-182. Mailhol J.C., Zaïri A., Slatni A., Ben Nouma B., El Amami H. (2004): Analysis of irrigation
systems and irrigation strategies for durum wheat in Tunisia. Agricultural Water Management, 70: 19-27.
Mailhol J.C., Ruelle P., Walser S., Schütze N., Dejean C. (2011): Analysis of AET and yield prediction under surface and buried drip irrigation systems using the crop model PILOTE and Hydrus-2D. Agricultural Water Management, 98(6): 1033-1044.
Maraux F., Scopel E., Findeling A. (2004): Using models for optimizing soil moisture management strategies. Drought-resistant soils. Optimization of soil moisture for sustainable plant production: Proceedings of the electronic conference, 15 November- 18 December 2004. Rome: FAO, 2005. 27 pp.
Marcelis L.F.M., Heuvelink E., Goudrian J. (1998): Modeling biomass production and yield of horticultural crops: a review. Science Horticulture, 74: 83-111.
Marcelis L.F.M., Heuvelink E. (2007): Concept of modeling carbon allocation among plant organs. In J Vos, LFM, Marcelis, PHB de Viser, JB Evers, eds. Functional-Structured Plant Modeling in crop Production, Dordrecht: Springer, 103-111.
Merah O. (2001): Potential importance of water status traits fro durum wheat improvement under Mediterranean conditions. Journal of Agricultural Science, 137: 139-145.
Nash J.E., Sutcliffe J.V. (1970): River flow forecasting through conceptual models Part 1. A discussion of principles. Journal of Hydrology, 10: 282–290.
Nemeth I. (2001): Fate of nitrogen under irrigation: application to the case of an irrigated region in Mexico. PhD dissertation, University of Montpellier II, 205 pp + Annexes. (In French).
Panahyan-e-Kivi M., Zabihi-e-Mahmoodabad R., Jamaati-e-Somarin S., Khayatnezhad M. (2010): Interaction Effect of Plant Densities and Nitrogen Fertilizer on Durum Wheat (CV. Seymareh) Growth. American-Eurasian Journal of Agricultural and Environmental Sciences, 9(3): 263-268.
Puckridge W., Ronald C.M. (1967): Competition among wheat plants sown at wide range densities. Australian Journal of Agricultural Research, (18): 193-211.
Reddy B.B., Kumar A., Swamy K.B. (1987): Effect of plant population on the performance of maize hybrids at different fertility levels in semi –arid environment. Indian Journal of Agricultural Sciences, 57: 705-709.
Singh I.D., Stoskopf N.C. (1971): Harvest index in cereals. Agronomy Journal, 63: 224-226. Uhart S.A., Andrade F.H. (1995): Nitrogen deficiency in maize, I. Effects on crop growth,