HAL Id: jpa-00247585
https://hal.archives-ouvertes.fr/jpa-00247585
Submitted on 1 Jan 1991
HAL is a multi-disciplinary open access
archive for the deposit and dissemination of
sci-entific research documents, whether they are
pub-lished or not. The documents may come from
teaching and research institutions in France or
abroad, or from public or private research centers.
L’archive ouverte pluridisciplinaire HAL, est
destinée au dépôt et à la diffusion de documents
scientifiques de niveau recherche, publiés ou non,
émanant des établissements d’enseignement et de
recherche français ou étrangers, des laboratoires
publics ou privés.
Brownian dynamics in a confined geometry.
Experiments and numerical simulations
Norbert Garnier, N. Ostrowsky
To cite this version:
Norbert Garnier, N. Ostrowsky.
Brownian dynamics in a confined geometry.
Experiments
and numerical simulations.
Journal de Physique II, EDP Sciences, 1991, 1 (10), pp.1221-1232.
J. Phys. II France 1 (J99J) J22J-J232 OCTOBRE 1991, PAGE J22J
CJassificafion
Physics Abstracts 05.40 42.J0 82.70
Brownian
dynamics
in
aconfined
geonletry.
Experiments
and
numerical
simulations
N. Gamier and N.
Ostrowsky
Laboratoire de Physique de la Matidre Condensde (*)
Universitd de Nice Sophia AnfipoJis, 06034 Nice Cedex, France
(Received 18 April 1991, accepted 17 July 1991)
Rkswd.- La dynamique brownienne de particules colloidales au voisinage immddiat d'une
paroi rigide est mesurde par la technique de diffusion quasi-dlasfique de la Iumidre en onde
dvanescente. On observe un net ddcroissenJent du coeffident de diffusion, d0 au ralentissement
hydrodynamique des particules trds proches de la paroi. Cet effet est d'autant plus marqud que [es
particules peuvent se rapprocher trds prds de la paroi, c'est-I-dire que la portde de la rdpulsion
statique paroilparticule est faible. II est donc possible de tester [es interactions statiques
paroilparticules via une expdrience de diffusion dynamique de la Iumidre. Los donndes sont
analysdes par une simulation de dynamique Brownienne, particulidrement adaptde I
I'interprdta-tion des rdsultats de diffusion de la lumidre par des diffuseurs
« grinds », tels que des particules
confindes au voisinage d'une paroi, ou pidgdes dans des milieux poreux ou des gels.
Altstract.- The Brownian dynamics of a colloidal suspension is measured in the immediate
vicinity of a rigid surface by the Evanescent Quasielasfic Light Scattering Technique. A net
decrease of the measured diffusion coefficient is observed, due to the hydrodynamic sloving
down of the particles very close to the wall. This effect is all the more important when the particles
are allowed to get closer to the wall, I-e- when the range of the static waII/particle repulsive interaction decreases. It thus provides a mean for testing the particle/waII static interactions via a
dynamic fight scattering measurement. The data are analysed by a Brownian dynamic simulation
which is proven to be quite valuable to interpret light scattering data from hindered » scatterers,
such as particles confined in the neighbourhood of a wall or trapped in a porous media or a gel.
1. Inwoducdon.
The interactions between
particles
suspended
in afiquid
and the solid wallconfining
thesuspension
are at the basis of a number ofimportant
practical
phenomena
such asparticle
sedimentation and adhesion on a substrate.
These interactions may be classified in two types :
The static interactions
mainly
include the Van der Waals attraction and the electrostaticinteractions between the
charges
carriedby
theparticles
and the solid wall. The stefic1222 JOURNAL DE PHYSIQUE II bt 10
interactions of
entropic
origin,
present when theinteracting
surfaces are flexible(for
example,
undulating
vesicles orparticles
coated with apolymer layer)
may beneglected
in ourproblem.
This type of interactions lead to a non-uniform concentrationprofile
in thevicinity
of the wall.
The
hydrodynamic
interactions due to the fact that theliquid
flow createdby
amoving
particle
isperturbed
by
the presence of the wall and thus reacts back onto the motion of theoriginal
particle.
A number of theoretical
[I]
and numerical [2] studies haveexplicited
the form andnumerical values of these interactions and more
recently
some moleculardynamics
simulations
[3, 4]
havehelped
understand their role in the Browniart motion ofparticles
in theimmediate
vicinity
of arigid
wall.As far as
experiments
go, theproblem
is far less advanced.Macroscopic
experiments
havemonitored the fall of
suspended
balls onto a solid surface, thusmeasuring
the frictioncoefficient
A(z)
as a function of the distance z between theparticle
and the wall [5]. On amore
microscopic
scale~particles
around lo ~m indiameter)
staticexperiments
have studiedthe
height
distribution ofsuspended
particles
above agiven
transparentplate,
from which thestatic interaction
potential
between theparticles
and the wall can be deduced[6].
StaticFluorescence
Techniques
have also been used to measure the concentrationprofile
ofparticles
doped
with fluorescentprobes
in thevicinity
of a transparent wall[7,
8].The purpose of this paper is to
give
some newexperimental
results on the Browriandynamics
ofparticles
close to asurface,
measuredby
artoriginal
methoddeveloped
in ourlaboratory:
Thequasi
elasticlight
scattering
technique
using
as the incidentlight
anevanescent wave which thus
only
probes particles
within a distance less than thepenetration
depth
of the wave(see
Sect.2).
Toanalyse
our data, we haveperformed
a «computersimulated
light
scattering
experiment
»(see
Sect.3)
to generate the correlation function ofthe electric field scattered
by
a Brownianparticle
submitted to both the static andhydrodynamic
interactions discussed above.2. Evanescent
Q.L.S.
experbnent.
2.I EXPEItIMENTAL CONDITIONS.
Material We have studied an aqueous latex
suspension ~particle
diameter= 0.09
~m)
whoseconcentration
(cm3
x10~~g/cm~,
I-e- mean distance betweenparticle
=
I
~m)
islarge
enough
toprovide
a confortablesignal
in the evanescent waveregime,
but lowenough
toallow us to
neglect
theparticle/particle
interactions. We have used different saltconcen-trations so as to be able to
partially
screen the electrostaticrepulsion
between thesuspended
particles
and theglass
wall, bothnegatively
charged.
Optical
set-up(see Fig. I)
: Theliquid sample
is contained in a halfcylindrical
cell, sealedby
an
optically
flat surface~polished
to A/20)
of alarger
semi-cylindrical
glass
prism.
This surface wasultrasonically
cleaned with distilled water after eachexperiment.
Thesample
holder isplaced
on aprecision
tumtable, so as toeasily change
the incidentangle
@~ of the
vertically
polarized
Argon
laser(300
mW at= 514.5
nm).
The criticalangle
for total reflection is
given
by
the usual relation : sin @~ =n~~~~Jn~~.
For @; ~ @~, the incident wave vector in themedium has a real component k~ =
2
wn~j~/A parallel
to theflat surface of
the prism, and animaginary
componentequal
to the inverse of thepenetration
depth
fgiven by
: f= (A /2
wn~j~~)
[sin~
@Isin~
@~]~~~ (l)
bt 10 BROWNIAN DYNAMICS IN A CONFINED GEOMETRY J223 Colloidal Argon Suspension . patial
ilter
beam Scope Micro PMJ224 JOURNAL DE PHYSIQUE II bt J0
2.2 EXPERIMENTALLY MEASURED CORRELATION FUNCTIONS.
Typical
correlationfunc-tions recorded for
@I
just
below(f
= 0.8~m)
andjust
above(f
=ml
the criticalangle
[,
but at the samescattering
angle
@, are shown infigure
2,illustrating
the so-called« surface » and « bulk correlation functions whose theoretical
expressions
are now recalled.Bulk correlation
function
: In aheterodyne
experiment,
theintensity
correlation function is alinear function of the first order correlation function of the scattered electric
field, which,
withhomogenous
illumination of thescattering
volume and in its normalized from, can be writtenas :
g
(t)
= Re(e"~'~
(~l) where thescattering
wave vector q = k ; k~(2)
is the difference between the incident
(k;)
and the scattered(k~)
wave vectors, andr (t) is the vector
position
of theparticle
which was at theorigin
at time zero. The average is tobe taken on a great number of
independent
Brownianparticles.
In the case of the usual bulk geometry, the
probability
density
for aparticle
to be at timet at a distance r from its
starting
point
at time zero is the well known Gaussianprobability
:P
(r,
tj
=
(4
qrDtj~
~'~exp
r~i4
Dtj
(3j
where
D=kT/6w~R
is the bulk diffusioncoefficient,
related to theparticle
radiusR and the
suspension's
viscosity
~.Using
thisprobability
density
to compute the average inequation
(2)
leads to the usualexpression
for the bulk correlation function :g~(t)
=
e'~'~~~~
P(r, t) d~r
(4j
= exp
(- Dq
~
t)
(5)
Surface
correlationfunction
: In the presence of a wall, it is useful todecompose
the 3DBrownian motion into two
independent
motions,
oneparallel
and oneperpendicular
to thewall,
along
the direction Oz.Neglecting,
tobegin vlith,
theparticles/wall
interactions,
the firstmotion
obeys
the usual 2D Brownian motion statistics, and the second one includes the« mirror » effect of the wall.
Accordingly,
the properprobability
density
to be used incomputing
the average inequation (2)
is nolonger given by
equation(3)
but now reads :~ (= zo12 (z+zo12
p
(
~ J~)-
3/2 4Dt 4 Di 4Dt(~)
~ll,Z, Z o, " " e e + e
where
(0,
zo)
and(q,
z are theparallel
andperpendicular
coordinates of theparticle
at time0 and t,
respectively
(see Fig. 5).
In the evanescent wave geometry, one must further take into account the fact that the
scattering
volume is notunifornfly
illuIninated, whichrequires
that the average inequation (2)
be
properly
weighted
by
the electric fieldamplitude
at theparticle's
position
at time 0[Eo
e ~°'~] and time t[Eo
e ~'fThe theoretical forrn of the «surface» correlation function
g~(t)
is thusgiven by
thefollowing
integral
:g~(t)
=
~°
e f
iii
P(rj,
z, zo, t)
ee'"
~ e'~"~~ ~°~d~q
dz(7)
f ~~
bt J0 BROWNIAN DYNAMICS IN A CONFINED GEOMETRY J225
which has been found [9] to be
equal
to :gs(t)
= eXP
(- Dq
IIt)
gz(qz,
f, D, t)
(8)
where qj and q~ are the components of the
scattering
vectorparallel
andperpendicular
to thewall, and
g~(q~,
f, D, t)
is ananalytical
function whose limitedexpansion
caneasily
beimplementd
on amicro-computer-The theoretical correlation functions
(5)
and(8)
have been used to draw the solid lines infigure
2,leaving
as anadjustable
parameter the diffusion coefficient D.Now,
the value foundfor the best
adjustment
of the surface correlation function wasalways
lower than the valuefound for the bulk measurement, the difference
being
all the greater when theparticles
wereallowed to come closer to the wall, I.e. when the
particles/wall
repulsion
was reducedby
increasing
the salt concentration of thesuspension.
This isinterpreted
as the combined effectof the
repulsive
hydrodynamic
and electrostatic interactions between theparticles
and thewall as we now discuss.
2.3 ROLE OF PARTICLES/1VALL INTERACTIONS. As mentioned in the
introduction,
twokinds of interactions must be considered.
The static
particle/wall
interactionsrepresented
by
aposition
dependent
potential
interactionU(z),
results in a non-uniform distribution ofparticles
in thevicinity
of the wall. As Westudied
negatively
charged
latexparticles
of radius Rsuspended
in salty Water, in thevicinity
of a
glass
wall, bothnegatively
charged,
the electrostatic interaction may be derived from theDLVO theory
[10]
:~~
~~~i~~~
~
~~'~ ~~'~
~~~''
~'~~ ~~ ~~
~~~ ~~~
~+
(#i+
WIH#1
#21in
Ii
A
1~°e-~l1
(91
with the
following
notation :s is closest distance between the
particle's
surface and the wall(I.e.
: s = zR)
x~ is the
screening
Debye
length
K "
[6~~/(2
~~~~iA Cw~t))~~~(IO)
(with N~
theAvogadro
number, e : the dielectric constant of the mediuTn, e the electroniccharge
and c~j~. the saltconcentration).
~j and ~~ are the surface
potentials
of the latexparticle
and theglass
wall(typically
on theorder of 50
mlo.
His a dimensionless
quantity
defined as :H= ~
~~~+
~~~~~~
(ll)
R+s R
To this
repulsive potential
must be added the attractive Van der Waalspotential
derived fromHamaker's
theory [11]
:with Am I kT.
The
resulting
interactionpotential
U(s)
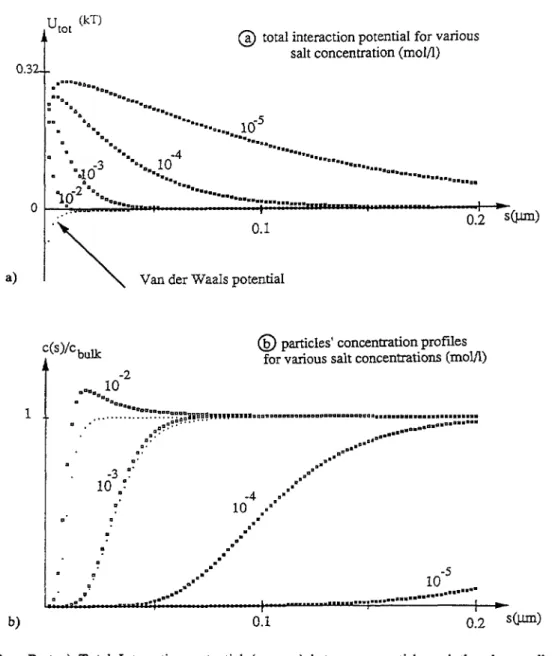
is shown infigure
3a for different salt1226 JOURNAL DE PHYSIQUE II bt J0
~t°t
~~~~@
total interac~ionpoten~ial
for Varioussalt concentration (molfl)
,oooo~ O ~OO~O OO °"°oO ~O ~°. °~ ~°COO ' "OO. ~ ~~ "o«.~ ~j ' °..o °.OO O °°O.O~ O _~ ""°OOOO.~~ " l~ ~~~°"OO.Oo ° °°°Oooooo ° *OOOOOOOOO a °°"' ° ... oi o.2 S~Un) a)
~
van der Waals
potential
c(s)/c~
~i
panicles'
concentrationprofiles
~ for various salt concentrations (mot/l)
-2 ao IO * °o~ a °a~~~~ I ,,...~~~~ll?ff??((11999"i'ioooooooooooooooooooooooooooooooooa.oooooooo«....»ooooooo««
~ .' ~a?..'~oo...' ~,,o««oO«~~~~oooooo
of" a.°°""" o. ~o°° o. ~o° o. o°" °. -3 1' oO"~ ~Q ° d O" " -4 o" o ] o~ ° o' o O~ / O ~° o O ~ O~ O ." . ~' a" -5 o' IO b) 0.1 0.2
~ll~~)
Fig. 3.- Part a) Total Interaction potential (squares) between a particle and the glass wall, both
negatively charged, for various salt concentrations. The attractive Van der Waals part of the potential is
shown vith the dotted line. Part b) Corresponding particles' BoluJnan concentration profiles (squares).
The profiles obtained when ignoring the Van der Waals attraction are shown with the dotted fines.
This
figure
clearly
shows that the effect of the Van der Waals attractivepotential
willonly
bedetectable for the
highest
salt concentration used(10~~ mol/I)
and the shortestpenetration
depth
(f
= 0.2 ~m
), enhancing by
lo fb the
hydrodynaniic
slowing
down as will beexplained
in the next section. This attractive
potential
was howeverhnportant
in all ourexperiments,
asit was
responsible
for a very slow but detectableaggregation,
all the morerapid
when the saltconcentration was increased.
Beyond
10~~mol/I,
theaggregation
was found to be too
rapid
toinsure
good
evanescent wave conditions on the flat surface of theprism
during
the databt 10 BROWNIAN DYNAMICS IN A CONFINED GEOMETRY 1227
The effect of the
hydrodynamic
interactions between theparticles
and the wall, mediatedby
the water molecules, are included
through
aposition-dependent
friction tensor Awhich,
multiplied
by
the vectorvelocity
V of theparticle,
yields
the friction force Fexperimented
by
the
particle
:1)'
=(/'
~'
).
(13)
z c : Vz
Using
the EinsteinSmoluchowsky
relation,
leads to aposition
dependent
diffusion tensorwhose component
Dj (s)
andD~(s)
have been calculated in the literature.Using
Faxen result[12, 4],
wecomputed
Dj
(s)
with thefollowing
linfitedexpansion
:D~(s)
was derived from Brenner'sexpression
[13, 4],
keeping
the first seven terrns of theseries :
l~b~k
Dz(S)
4 ~ " n(n
+ I 2 sinh(2
n + I a +(2
n + I sinh 2 a ~~~~ 3 ~~~ "~~
(2
n) (2
n + 3)
4sinh~
(n
+ 1/2 a(2
n + )~sinh~
a vlith a = cosh~ ' ~ ~ ~ RTo account for this
position
dependence
of the diffusion coefficient in thecomputation
of thecorrelation function
g~(t)
is not a trivial matter, except for short timescompared
to thecorrelation function relaxation time.
In this
finfit,
a limitedexpansion
ofequation (8) yields
:gli>(t)
m
ii
Di
gilt
Dz(q]+
il12)11
(161
For such short times, one can assume that a
given scattering
Brownianparticle
is confined to avolume small
enough
so that its diffusion coefficients Djj(z)
andD~(z)
can be considered asconstant. The observed correlation function is an average of
equation
(16)
over all theBrownian
particles
contained in thescattering
volume.Taking
into account the facts that theconcentration
c(z)
ofparticles
near the wall isposition
dependent
(see
Fig.
3b)
and thatparticles
closer to the wall receive and thus scatter ahigher
intensity
according
to theexponential
lawexp(-
2z/f),
leads to theapproximation
:~~~
j)
ii
Dj (z)
qi
tD=(zj
(qj
+lif~)
ii c(z)
exp(-
2 zif dz~~ ~~~
)~
c(z)
exp(-
2zif
dz~~~~
o
m
Ii
b(f) (q2+ 1/f2)j
(18)
thus
defining
theweighted
averagefi(f)
which has beennumerically
computed
for differentpenetration
depth
for[Nacl]
=
10~~ mol/I (see
dotted linesin
Fig. 4).
It must be
remembered,
however,
that thisapproach
15only
valid for shorttimes,
and the1228 JOURNAL DE PHYSIQUE II bt 10
D(I)
/
D~uu~ i _~_ ____--- n 4&=_==.=.
=-=-= .= --.=.=.-='
(
/R
0 5 10 15 20Fig. 4. Average diffusion coefficient D (f ), normalized to the bulk diffusion D~~~, as a function of the
penetration length f for two salt concentration (Q:
10~~mol/1;
m no salt added). The valuescomputed from the « short-time approximation are shown by the dotted line for [Nacl] = 10~
~ mol/I.
The computer simulated results for [Nacl] =
10~~ mol/I and [Nacl]
=
10~~ mol/I are indicated vith
dashed fines.
correlation function, I.e. its
slope
at theorigin.
Unfortunately,
thiscomparison
cannot be veryprecise,
as the surface correlation function is far from anexponential
and itsslope
at theorigin
canonly
bepoorly
defined. We thus looked for a better way toanalyze
ourexperimental
data, which led us to the Browniandynamics
simulations we now describe.3. Brownim dynandcs sbnviafions.
The idea is to simulate a
light scattering
experiment
on a computer and derivenumerically
theexpected
correlation functiong(t).
As weexplained
in section 2.2, anyphoton
correlationexperiment
measures the normalized correlation function of the electric fields scatteredby
awalker at time 0,
E(0 ),
andby
the same walker an instant t later,E(t).
If the walker at time 0and t receives the same incident
intensity
(constant
illuminationprofile),
theonly
differencebetween
E(0)
andE(t)
is aphase
factor cos(q
r(t))
where q is thescattering
wave vectorand
r(t)
is the distance coveredby
the walkerduring
the time t, and thus :g(tj
=
l~~~)
~(°)i
=
jars
(q.r
(iii>
(19)
iiE(0j
ii
If the
scattering
particle
is far from any wall, thusundergoing
a Brownian motion with adiffusion constant
D~,
it can be modelledby
a random walker which takes every time intervalr and in any direction a step ±
(2
D~
r )~'~. The time interval r chosen for the simulation mustbe small
compared
to the timedecay
of theLight
Scattering
correlation function, butlarge
enough
to allow for Brownian fluctuations todecay.
Thelight
scattering
correlation functionis then obtained as follows. Let a
given
walker move aroundduring
a time intervalt, thus
covering
a distancer(t)
compute thephase
factor cos(q.r(t))
and repeat theexperiment
a great number oftimes,
the average of thephase
factorprogressively
building
thebt 10 BROWNIAN DYNAMICS IN A CONFINED GEOMETRY 1229 z
~ll
~ w(li-$
,." ~~~ , »'~
J' ." i~(
-~i
z(0)/
)
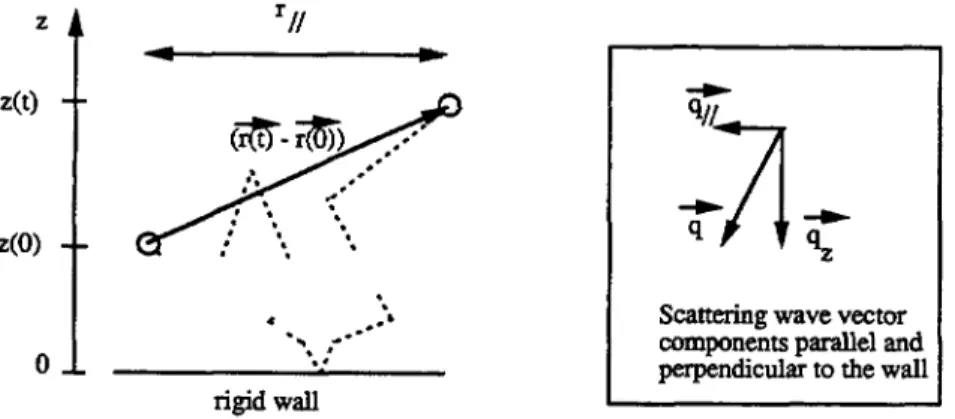
~ ~ ~z . ~)",Scattefing wave vector
",, ,-"' components parallel and
0 '' perpendicular to the wall
rigid wall
Fig. 5. Brownian walker in the vicinity of a wall showing the position dependent step and the nfirror
effect of the wall.
illumination
profile,
the simulations match the well knownanalytical
result(see Eq. (5)).
Ifwe now introduce the
exponential
illuwnationprofile,
together
with the mirror effect of thewall
(I.e.
a walkermeeting
the walljust
bounces back into thesuspension
seeFig. 5),
thesimulations exactly match the solution
given
inequation (8).
The method however takes onall its value when we introduce in addition the static and
hydrodynamic
interactions betweenthe walker and the wall, as we now describe.
Starting
from theLangevin
equation
describing
the motion of a Brownianparticle
submitted to a
position-dependent
friction coefficient and to a staticposition-dependent
force,
Errnak and MacGamrnon [3] derived theexpression
for theposition-dependent
stepsuch a Brownian
particle
accompfishes.
In ourproblem,
the randomdisplacement
L(z)
of a walkeralong
the Oz axisduring
a time interval r is tile sum of three terms :L
(z)
= =
(2
D~(zi
r)"2
+dD;/dz
r +iD=(z)/k11
F= r(20)
The first one is the usual random step,
Lo
= ±(2Dr)~'~
with a zdependent
diffusioncoefficient D. The second one is
merely
a correctiondLo
to the first one,taking
into accountthe fact that D is not constant over the whole step
Lo.
This correction terra may besimply
derivedby
differentiating
Lo
with respect to z :~ dD ~~ ~
dL0
" + ~(21)
2 Dr which, for dz =Lo, yields
the second terra of
equation
(20).
The third term ofequation (20)
issimply
the drift of the walker away from the wall, due to the staticrepulsive
forceF~
computed
by
taking
thegradient
ofequations
(9)
and(12).
Now the random
displacement
L'(z)
of that same walkerparallel
to the wall is somewhatsimpler
as it includesjust
the random step, whosemagnitude
however isposition
dependent
:L'(z)
= ±
(2 Dj (z)
T)~'~(22)
We have thus
implemented
on a MaCIImicrocomputer
a programcomputing
theposition
r(t)
of a walkerstaffing
at time zero from arandomly
chosenposition
r(0),
repeating
the1230 JOURNAL DE PHYSIQUE II bt 10
progressively
built upby sumnfing,
for eachcouple
ofpositions
[r(0),
r(t)],
theproperly
weighted phase
factor :w (
ig~(t)j~~~~~~
= ~ ~z
e f e f cosjq
(r(t)
r(0j)j
(23)
° P~" overatipmnThe
advantage
ofusing
asingle
walker andfollowing
himthroughout
thecomputation
isthat it will
sample
all the distances z from the wallaccording
to the proper distribution lawc(z),
as we checked infigure
6, and the non-uniform concentrationprofile
isautomatically
accounted for in the simulation.
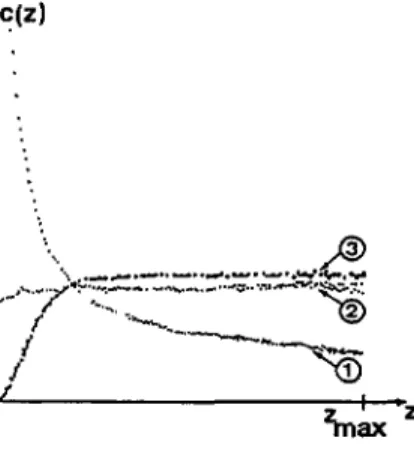
Fig. 6. Concentration profiles obtained by numerical simulation using in the walker's step only the first terra in equation 20 (curve I), the first two terms (curve 2) and finally aIJ three terrns (curve 3). The dashed lines indicate the anaJyticaJ concentration profile deduced from the BoJtzman distribution using
equations (9) plus (10) for the particles/wall interaction.
Note that
figure
6 illustrates theimportance
of all three terms inequation
(20).
Curve Ishows that
accounting
for thehydrodynamic
repulsion by merely
reducing
the Brownian stepas the
particle approaches
the wall leads to an accuTnulation ofparticles
in thevicinity
of thewall. It is
only by
adding
the second term(curve 2)
that theexpected
« flat » concentrationprofile
is obtained. The last curve(n° 3)
in the presence of the static interactionpotential
iswell fitted
by
the Boltnnan distributionusing
equation
(9) plus (12)
for theparticles/wall
interaction.
Finally
let us mention that to avoidloosing
too much time with the walkersampling
aregion
too far away from the wall
(where
the illuminationintensity
is too low togive
asignificant
contribution to the correlation
function)
we put a fictitiouspurely
reflecting
wall atz = z~~. TMs distance was chosen as a
good
compromise
betweensaving
time andavoiding
distorsions on the correlation function.
This « simulated » correlation function was then fitted vlith the theoretical
expression
(8)
found for g~ and the best fit
yielded
the simulated valueD(f ).
Repeating
thisprocedure
forseveral values
off
and salt concentrations allowed us toplot
the dashed lines shown infigure
4 and to fill the last column of table1.
4. Results and discussion.
All the
experimental
results are summarized in table I for differentpenetration
depths
andM 10 BROWNIAN DYNAMICS IN A CONFINED GEOMETRY 123J
Table I.
Summary
of
theexperimental
and simulation resultsfor
DjD~~j~
at variousfloacl]
concentrations and penetration
depths
f.Depth
c;pertinent)periment)(experiment)
No
salt
f
=
0.85
f = .43 ~m 4.35 ± 0. I1 4.49 ± 0.04 f = 0.20 ~m 4.35 ± 0.I1 0.97 0.95 .5 x 10-3 f = 0.85 ~m 4.26 ± f = 0.20 m 3.94 ± 0.04 0.85 0.75 .0 x 10-~ f = 0.85 ~m 4.10 ± f = 0.20 m 3.85 ± 0.04 0.81 0.74 .5 x 10-~ f = 0.85 ~m 4.05 ± f = 0.20 m 3.78 ± 0.04 0.79 0.73 .0 x 10-2 f = 0.85 ~m 4.09 ± f = 0.43 m 3.76 ± 0.08 4.80 ± 0.06 0.79 0.78f
= 0.20 ~m 3.77 ± 0.04 , 0.79 0.73The
experiments
were conducted as follows : the latexsuspensions
wereprepared
in purewater, and the bulk diffusion coefficient was measured. The
optical
set-up was thenaligned
for a
given
penetration
depth
f, and thecorresponding
surface diffusion coefficientmeasured. Without
changing
theoptics,
the necessary salt solution was added andD~ measured at different salt concentration.
Changing
back the incidentangle
to@; ~ o~, the bulk diffusion coefficient was measured on
suspensions
containing
the same salt
concentration. Note that the bulk diffusion coefficient
D~
islarger
in the salty solution than inpure water. This is
simply
due to the fact that thedangling
chainscovering
the extemal latexsurface carry OH~ groups at their
tips.
In pure water, these chains are more or lessfully
extended, so as to
spread
the OH groups as far apart aspossible,
whereas in the presence ofsalt,
they
can fold back to a more compact structure which allows theparticles
to have alarger
diffusion coefficient
[14].
The ratios
D~(f)/D~~j~
obtained from theexperiments
are summarized the next to lastcolumn of table I and the data extracted from the simulations are indicated in the last column of that table. As
expected,
we note that theexperimentally
measured ratioD~(f)/D~~i~
increases as the salt concentration is decreased, but that the values obtained in pure water are
still
significantly
lower than I. The simulations of pure water »given
at thebeginning
of thelast column were made
assuming
[Nacl]
=
10~~ mol/I.
As
experiments
and simulations are infairly good
agreement, we feel confident that theBrownian
dynamic
simulations will bequite
valuable tointerpret
light
scattering
data fromhindered » scatterers, such as
particles trapped
in a porous media or agel
; it isexpected
that the correlation function of the electric field scattered
by
suchparticles
Milldecay
Mith atime constant
reflecting
both :J232 JOURNAL DE PHYSIQUE II M lo
ii
thegeometrical
constraints which reduce the span of theparticles'
diffusive motion[15]
and
iii
thephysical
interactions between theparticles
and the walls, which slow down theparticles'
Brownian motion itself.To summarize, we have shown that the Evanescent
Quasielastic
Light
Scattering
Technique
is a sensitive tool for
measuring
Browniandynamics
in the immediatevicinity
of arigid
surface.
A net decrease of the measured diffusion coefficient is
observed,
due to thehydrodynamic
slowing
down of theparticles
very close to the wall. TMs effect is more observable when theparticles
are allowed to get closer to the wall, I.e. when the range of the staticwall/particle
repulsive
interaction decreases.This method could also prove to be very sensitive to the onset of
particles
aggregation
onthe surface,
introducing
in thecomputation
a « residence time »during
which agiven particle
would remain stuck on the wall before
drifting
again
in thesuspension.
Simulations arecurrently
being
done to test thispossibility.
Acknowledgtnents.
The authors
acknowledge
stimulating
discussions vlith Bruce Ackerson and Didier Sometteand wish to thank Pierre Bezot for his valuable
help
in theexperimental
part, and C.Vanneste and J. P. Roustan for their
friendly
help
in thewriting
of the computer programs.References
[J] See for example BATCUELOR G. K., J. Huid. Mech. 74 (J976) J.
[2] ADAMCzYK Z. and VAN DE VEN T. G. M., J. Colloid Inierface Sci. 84 (1981) 497. [3] EMAK D. L. and MCCAMMON J. A., J. Chem. Phys. 69 (4) (1978) 1352.
[4] CLARK A. T., LAL M. and WATSON G. M., Faraday Discuss. Chem. Soc. 83 (J987) J79.
[5] ADAMCzYK M. and VAN DE VEN T. G. M., J. Colloid. interface Sci. % (1983). [6] PRIEVE D. C. and FREJ N. A., Langmuir 6 (J990) 396-403.
[7J THomsoN N. L., BURGHART T. P. and AXELROD D., Biophys. J. 33 (J98J) 435.
[8] AUSSERE D., HERVET H. and RONDELEz F., Phys. Rev, Lett. 54 (J985) J948.
[9] LAN K. H., OSTROWSKY N. and SORNETTE D., Phys. Rev. Lent. 57 (J986) 17,
[J0] BELL G, M., LEVINE S, and MCCARTNEY L. N., J. Call. Inter. Sci, 33 (1970) 3, 335-359.
[JII HAMAKER H. C., Physica 4 (J937) J058.
[12] FAXEN H., Arkiv. Mat. Astron. Fys. 17 (1923) 27.
[J3] BRENNER H., Chem. Eng. Sci. 16 (J96J) 242.
[J4] TROTTER C. M. and PINDER D. N., J. Chem. Phys. 75 (J98J) J.

![Table I. Summary of the experimental and simulation results for DjD~~j~ at various floacl]](https://thumb-eu.123doks.com/thumbv2/123doknet/13596631.423484/12.765.79.693.149.520/table-summary-experimental-simulation-results-djd-various-floacl.webp)
