HAL Id: hal-02626986
https://hal.inrae.fr/hal-02626986
Submitted on 26 May 2020
HAL is a multi-disciplinary open access
archive for the deposit and dissemination of sci-entific research documents, whether they are pub-lished or not. The documents may come from teaching and research institutions in France or abroad, or from public or private research centers.
L’archive ouverte pluridisciplinaire HAL, est destinée au dépôt et à la diffusion de documents scientifiques de niveau recherche, publiés ou non, émanant des établissements d’enseignement et de recherche français ou étrangers, des laboratoires publics ou privés.
Distributed under a Creative Commons Attribution - NonCommercial - NoDerivatives| 4.0
A spatiotemporal multiscale analysis of runoff and
erosion in a mediterranean Marly catchment
Nesrine Inoubli, Damien Raclot, Insaf Mekki, Roger Moussa, Yves Le
Bissonnais
To cite this version:
Nesrine Inoubli, Damien Raclot, Insaf Mekki, Roger Moussa, Yves Le Bissonnais. A spatiotem-poral multiscale analysis of runoff and erosion in a mediterranean Marly catchment. Vadose Zone Journal, Soil science society of America - Geological society of America., 2017, 16 (12), 11 p. �10.2136/vzj2017.06.0124�. �hal-02626986�
A Spatiotemporal Multiscale
Analysis of Runoff and Erosion in a
Mediterranean Marly Catchment
Nesrine Inoubli, Damien Raclot,* Insaf Mekki,
Roger Moussa, and Yves Le Bissonnais
An intensive monitoring investigation was conducted within the Kamech catchment (Cape Bon, Tunisia) to document the effect of scale on the hydrological and erosive responses in a Mediterranean climate regime with cracking soils. An evaluation of the individual contribution of topsoil and gully processes to total sediment delivery at different spatial scales was also conducted. Continuous runoff and erosion measurements during a 7-yr period at four nested gauging stations were examined in a plot (P1; 1.32 ha), a plot + gully (P2+G; 1.37 ha), a micro-catchment (MC; 15.2 ha), and the entire catchment (C; 263 ha). Data analysis showed a high interannual vari-ability and contribution of only a few events; three major events generated approximately 20% of the total runoff and at least 50% of the total erosion at all of the monitoring stations. The results also highlight the strong seasonal dynamics of both water and sediment delivery, with a time lag observed between runoff and sediment responses. The presence of open cracks in autumn was identified as a main factor explaining this time lag. A constant monthly and annual specific runoff response was observed among the sta-tions, and a simple linear model combining a single rate of topsoil (17 t ha−1
yr−1) and gully (80 t ha−1 yr−1) erosion (weighted by their contribution area)
successfully predicted the differences observed in the mean annual erosion rates among the stations. Finally, this work showed the predominance of topsoil erosion processes in a Mediterranean catchment that is character-ized by cracking soils and very high hydro-sedimentary connectivity.
Currently, soil erosion
is a recognized environmental problem (Kefi and Yoshino, 2010). Scientists have devoted considerable efforts to understanding and predicting ero-sion occurrence. They have intensively studied soil eroero-sion processes throughout the last decades using monitoring systems at the plot scale and at larger scales (Boix-Fayos et al., 2006; Cerdan et al., 2010; Vanmaercke et al., 2012). If water erosion factors are now well known (Wischmeier and Smith, 1978), the complex hierarchy of erosion processes across a wide range of spatial and temporal scales still needs to be studied (Wei et al., 2012; Cerdà et al., 2013). The study of the scale effect on soil erosion processes requires different methods to understand the redistribution of sediments along the source–transport–sink continuum (Lane et al., 1997). Research on soil erosion has established that factors controlling the movement of water and sediment vary according to a range of spatial scales, and the con-nections are complex (Cammeraat, 2002; de Vente and Poesen, 2005). Furthermore, the evolution of the system and the subsequent hydrological and erosion response are highly dependent on the interactions and dominant processes at the studied scales (Cammeraat, 2002; Boix-Fayos et al., 2007). Indeed, different factors and processes controlling runoff and erosion may act at distinct scales in different ways. Therefore, we need to understand the fact that processes at one spatial or temporal scale interact with processes at another scale, and the results of such cross-scale interactions often have nonlinear dynamics (Zehe and Sivapalan, 2009).Several previous studies have shown a scale effect on runoff. Actually, hydrological stud-ies that focus on the scale issue have documented that runoff per unit area generally decreases with increasing area (Le Bissonnais et al., 1998; Cerdan et al., 2004; Yair
Core Ideas
• Runoff and erosion were con-tinuously monitored for 7 yr at four nested spatial scales.
• A small number of runoff and erosive events were very important.
• There was a seasonal time lag between runoff and erosive response due to shrink–swell processes.
• Topsoil erosion processes and high hydro-erosive connectivity were predominant.
• A simple linear model explained mean annual erosion rates between spatial scales.
N. Inoubli, INAT, Tunis, Tunisia; N. Inou-bli and D. Raclot, IRD-UMR LISAH, Montpellier, France; I. Mekki, INRGREF, Ariana, Tunisia; R. Moussa and Y. Le Bissonnais, INRA-UMR LISAH, Montpel-lier, France. *Corresponding author (damien.raclot@ird.fr).
Received 13 June 2017. Accepted 1 Sept. 2017.
Citation: Inoubli, N., D. Raclot, I. Mekki, R. Moussa, and Y. Le Bissonnais. 2017. A spatiotemporal multiscale analysis of runoff and erosion in a Mediterra-nean marly catchment. Vadose Zone J. 16(12). doi:10.2136/vzj2017.06.0124
Special Section: Erosion and Lateral Surface Processes
Vol. 16, Iss. 12, 2017
© Soil Science Society of America. This is an open access article distributed under the CC BY-NC-ND license (http://creativecommons.org/licenses/ by-nc-nd/4.0/).
and Raz-Yassif, 2004; Raclot et al., 2009; González-Hidalgo et al., 2011; Sadeghi et al., 2013). Some research has identified a dramatic effect of spatial scale on measured runoff and sedi-ment yields under semiarid conditions, which has been attributed to scale-dependent variation in the importance and number of control factors and dominant processes (Yair and Raz-Yassif, 2004; Sadeghi et al., 2013). However, in terms of erosion, this trend of decreasing erosion with increasing area may be more complex (Cammeraat, 2002), absent (Mathier and Roy, 1996), or even inverse (de Vente and Poesen, 2005; de Vente et al., 2007; Vanmaercke et al., 2011). In most cases, the lack of a simple rela-tionship demonstrates the complex and scale-dependent process domination throughout a catchment and emphasizes our uncer-tainty and the poor conceptual basis for direct extrapolation from the plot to catchment scale of erosion rates and sediment yields (Cammeraat, 2002; Parsons et al., 2006). At local scales (m2), where sediment mobilization is dominated by rain splash,
rills, and interrill erosion, sediment yield is likely to be relatively low. However, the variability in runoff and soil loss from plot measurements is reasonably high because local conditions can vary strongly (Nearing et al., 1999; Gómez et al., 2001). When moving from small (m2) to larger areas (km2), sediment yield is
expected to increase due to an increase in connectivity and active erosion processes such as gully processes (de Vente et al., 2007). However, more sediment deposition and storage is expected with increasing basin area at parcel boundaries, in depressions, and at footslopes (Walling, 1983). For example, Lane et al. (1997), by describing the dominant processes controlling sediment yield at various scales, showed that sedimentation may be a dominant process. Reducing sediment exports from catchments requires an understanding of the source–transport–sink continuum to be able to develop efficient management strategies to combat soil erosion (Valentin et al., 2005). An alternative explanation that might account for scale dependency of runoff coefficients and erosion rates under natural rainfall is the effect of temporal variations in rainfall amount and/or intensity. Natural rainfall exhibits considerable temporal variation in intensity so that even if the average rainfall intensity exceeds the infiltration rate for the soil, this might not be the case for some parts of the storm (Wainwright and Parsons, 2002). Thus, the temporal variability of rainfall may greatly affect runoff production (Assouline et al., 2007) and consequently the erosion response.
The Mediterranean basin is very prone to erosion in all of its forms. Several Mediterranean countries are threatened by this phenom-enon because of the climate, topography, soil sensitivity, and a very long history of human presence and intense cultivation (De Franchis and Ibanez, 2003; Raclot et al., 2017). The dominance of gully erosion as the main source of sediment in Mediterranean environments has been underlined by many researchers from the local (Roose et al., 2000; Collinet and Zante, 2005) to the catch-ment or watershed scale (Poesen et al., 1996, 2002, 2003). As a major sediment source, gully erosion is thus suspected to generate
subsequent downstream impacts in terms of reservoir siltation (de Vente et al., 2006, 2008). However, accurate field measurements of the respective contribution of individual erosion processes at the catchment scale are rarely available (Porto et al., 2014), and existing estimations are often given for a limited number of erosive events. As a result, there is a lack of information regarding the contribution of gully erosion to sediment fluxes from the local to the catchment scale in the mid- to long-term. Runoff and ero-sion processes are also very dependent on the soil type (Morgan, 2005). Vertisols or vertic intergrades are present in many parts of the Mediterranean landscape, especially where fine material with a high content of swelling clay minerals has accumulated (Yaalon, 1997). The highly dynamic shrink–swell processes of such soil types due to changing soil water storage conditions (Messing and Jarvis, 1993; Favre et al., 1997; Bagarello et al., 1999) generates soil cracks and extreme seasonal variations in soil infiltration rates. As a result, their hydro-erosive response appears to be very complex at the micro, plot, and catchment scales (Gómez et al., 2014; Inoubli et al., 2016). Therefore, studying the impact of cracking soils on runoff and erosion at different temporal and spatial scales also rep-resents a specific and interesting challenge. To our knowledge, only a few studies have analyzed the scale effect on long-term hydrologi-cal and erosive responses under a Mediterranean climate regime (e.g., Yair and Raz-Yassif, 2004), and no such study has been per-formed in the context of Mediterranean cracking soils.
The major purposes of this study were (i) to provide a quantitative analysis of the surface runoff and the soil erosion response at differ-ent timescales (evdiffer-ent to year) and at differdiffer-ent spatial scales (1–250 ha) inside a small Mediterranean marly catchment under natural rainfall conditions and (ii) to evaluate and discuss the processes explaining the temporal and spatial variability of runoff and ero-sion in such a context.
6
Materials and Methods
The Study Area
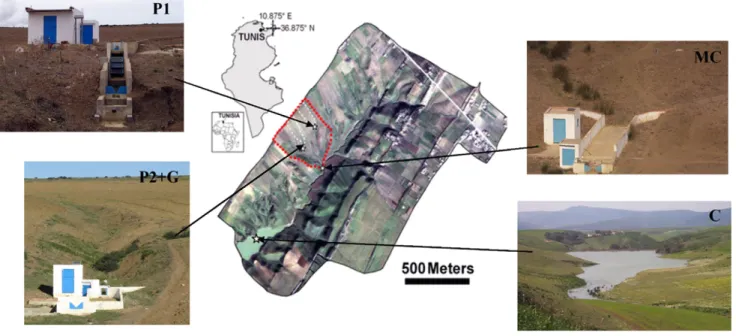
The Kamech experimental catchment belongs to a long-term envi-ronmental research observatory called OMERE (Mediterranean Observatory of Water and Rural Environment), which aims to study the anthropogenic impacts on water and sediment budgets at the catchment scale. It is a 263-ha catchment upstream from a hill reservoir built in 1994 with an initial storage capacity of 140,000 m3 (Fig. 1). The climate is semiarid, with a mean interannual
tem-perature of 14°C, a mean annual reference evapotranspiration of 1100 mm estimated from daily evaporation pan measurements using a pan coefficient of 0.8, and a mean interannual rainfall of 650 mm (Fig. 2). A very dry period is generally observed between June and August, whereas the rainy season occurs from mid-Sep-tember to mid-May. Rainstorm events with a short duration and high rainfall intensity predominantly occur during the hot months from May to October.
Land use has been stable from 1994 until now. Annually plowed croplands occupy 70% of the catchment area and mainly occur on slopes of <15%. They are predominantly composed of cereal crops, which are sometimes cultivated in rotation with leguminous crops. The remaining 30% of the catchment area consists of dwellings, low Mediterranean scrublands, and sparsely vegetated gully or channel features. The only feature prone to sediment deposits inside the Kamech catchment consists of the outlet reservoir. According to the FAO classification (2006), the soil types observed within the catchment are vertisols or assimilated (65%), regosols (25.5%), and eutric regosols (9.5%). Approximately two-thirds of soils in Kamech are consequently very sensitive to cracking and exhibit numerous wide and deep open cracks during the entire dry summer period (Inoubli et al., 2016).
Instrument Setup and Available Data
The catchment has been instrumented for the automatic acquisi-tion of instantaneous climatic and hydrologic data since 1995. The climatic instrument set was installed at the catchment outlet and includes tipping bucket rain gauges (0.5 mm), an evaporation pan, and an air thermometer. A water-level gauge was installed in the reservoir at the catchment outlet to provide continuous data on variations in the water level within the reservoir with 1-cm accu-racy (5-min time steps). The spillway and bottom drain valves were shaped in such a way that output discharge could be continuously estimated through precise level-discharge curves. Bathymetric sur-veys of the reservoir are made every 3 yr on average, which makes it possible to update the level-volume and level-surface curves for reservoir storage. Sediment concentrations during rare overflow through the spillway or emptying through the bottom drain valve were also evaluated using a few manual sampling surveys. These
sets of measurements enable the evaluation of the continuous runoff input into the reservoir by drawing a hydrologic budget of the reservoir, as explained by Albergel et al. (1999, 2007), Mekki et al. (2006), and Raclot and Albergel (2006). In addition, the sedi-ment input into the reservoir was computed between successive bathymetric surveys by adding the sediment trapped in the reser-voir and the sediment outputs through the spillway and bottom drain valve (Raclot and Albergel, 2006).
To describe the spatial and temporal variability of erosion, three hydrological stations following a hierarchical and nested design (Fig. 1) were installed between 2004 and 2005 at the outlet of (i) an experimental field (P1, 1.32 ha), (ii) a gully (P2+G, 1.37 ha) com-posed of a ravine (G) of 1700 m2 that drains a cultivated field (P2)
of 1.2 ha, and (iii) a micro-catchment (MC, 15.2 ha) that consists
Fig. 1. The location of the Kamech catchment and the different runoff and sediment monitoring stations: the downstream hillslope reservoir (C, 263 ha) that drains all of the catchment area and the three intermediate hydrological stations—the experimental field (P1, 1.32 ha), the gully (P2+G, 1.37 ha), and the micro-catchment (MC, 15.2 ha).
Fig. 2. Mean monthly rainfall, temperature, and mean annual refer-ence evapotranspiration (ET0) at the Kamech catchment for the period 2005 to 2012 as measured at the catchment outlet.
of 10.9 ha of cultivated land, 3.6 ha of scrublands, and 0.7 ha of gullies. Both P1 and P2+G are located within MC.
All of the gauging stations were equipped with two water level sen-sors that continuously monitored discharge (at a 1-min time step) using a combination of a rectangular channel (MC) or Venturi flume (P1 and P2+G) for high runoff rates and a V-shape weir for low runoff rates. An automatic water sampler with 24 glass bottles (Sigma Model 900P, Hach Company) was programmed to sample water in relation to the runoff level variations during floods. Automatic sampling was often complemented by manual sampling to increase the number of samples. The suspended sedi-ment concentration for each water sample was determined using a high-precision weighing scale (Gibertini Crystal 500 CAL). The total mass of the transported suspended sediment for an event was then calculated by integrating the sediment concentrations with the flow discharge.
In addition, vegetation cover development for the different crops and the evolution of topsoil cracks were documented every 15 or 30 d on 25 fields in Kamech that were selected to represent the main crop and soil type associations. Intra-annual evolution of vegetation cover was reported by Raclot and Albergel (2006) and intra-annual evolution of cracks by Inoubli et al. (2016). An inten-sive topographic monitoring of a representative permanent gully (included in P2+G) was also conducted in Kamech between 2002 and 2009 using a total station (El Khalili et al., 2013). This moni-toring enabled us to estimate the long-term mean interannual gully erosion rate in Kamech at 80 t ha−1 yr−1.
As a result, the Kamech monitoring system enabled us to derive the following variables:
ʶ continuous runoff (mm) and the long-term mean interannual soil erosion rate (t ha−1 yr−1) at the catchment outlet (C) during
the 1994 to 2012 period;
ʶ rainfall amount (mm), maximum rainfall intensity in 15 min (mm h−1), runoff amount (mm), soil erosion (t ha−1), and
mean sediment concentration (g L−1) at P1, P2+G, and MC
for all runoff events that occurred between 1 Sept. 2005 and 31 Aug. 2012;
ʶ vegetation cover and topsoil crack evolution during the same period;
ʶ the long-term mean interannual gully erosion rate in Kamech. Multiple uncertainty sources can impact measurement precision: instrumental uncertainties or failure, water-height to flow-rate calibration curve quality, suspended sediment concentration mea-surements, and an integration method to derive soil erosion from the flow rates and suspended sediment concentrations. Moreover, hydrological data precision varies greatly from one event to another because most of these uncertainties are not linear (e.g., water level
and discharge measurement precision depends on the water level). Repeated sensor calibration and control were performed to avoid bias in the data measurement and to derive good expertise of data quality for the Kamech monitoring system. Using this expertise, a global uncertainty value was evaluated to <15% for event runoff and <30% for event soil erosion.
Methodology Approach
Pretreatment of Experimental Data at the Event Scale
Every event that occurred between 1 Sept. 2005 and 31 Aug. 2012 with a rainfall amount >2 mm and separated by at least 1 h was considered, but only those that have generated runoff at least at one monitored station were included in the database. For some rare events, both water level and sediment concentration values were missing because of battery failures. For a few other events, only sediment concentration values were missing because the water level didn’t reach the minimum sampling water level or because of automatic water sampler malfunctioning.
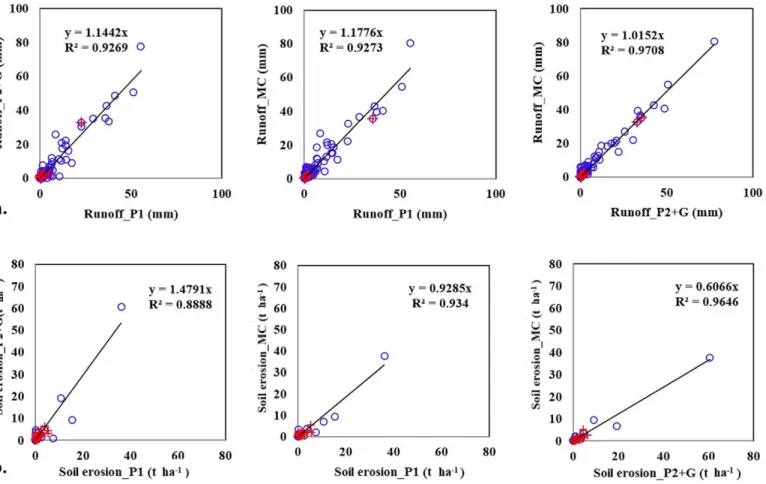
A pretreatment was proposed to identify and reconstruct the missing values. For missing runoff data, the inter-station rela-tionships (Fig. 3a; Table 1) were used because the rainfall–runoff relationships didn’t provide satisfactory prediction capacities. The inter-station relationship with the best determination coefficient was finally used:
ʶ P1 vs. MC relationship for missing runoff at P1.
ʶ P2+G vs. MC relationship for missing runoff at P2+G or MC. For the missing erosion values, the runoff parameters measured at the same station were used each time they were available to limit the impact of a possible shift in response between stations. In other cases, inter-station relationships (Fig. 3b) were used.
All of these relationships (Table 1) showed good prediction perfor-mance for the three stations. Depending on the considered station, 6 to 11% of the total runoff amount and 20 to 27% of the total erosion amount were reconstructed. The limited contributions of the reconstructed values and the strong prediction ability of the rela-tionships used to evaluate missing values enabled us to elaborate on a reconstructed database that can be used with acceptable confidence.
Spatial and Temporal Multiscale Analysis
The analysis of the temporal and spatial scale effect on runoff and erosion was based on the temporal pattern of rainfall–runoff–ero-sion rates at the four nested spatial scales for 7 consecutive yr. This pattern was first described using plots of cumulative event-based values for each of the seven monitored hydrological years and for each of the four nested gauging stations. A synthetic view of the temporal pattern of these variables was also provided at monthly and annual timescales for the different stations. The main fac-tors and processes explaining the runoff and erosion response at
different spatial and temporal scales were then discussed based on these plots.
A simple linear model that combines sediment sources due to gully erosion processes and sediment sources due to topsoil erosion pro-cesses was tested to explain the relative long-term contribution of erosive processes at the P2+G, MC, and C outlets:
Total Topsoil Gullies
E =aE +bE [1]
where ETotal is the long-term total erosion load (t ha−1 yr−1),
ETopsoil is long-term erosion (t ha−1 yr−1) of topsoil in the
cultivated field, EGullies is long-term erosion (t ha−1 yr−1) from
gullies, a is the percentage of cultivated topsoil surface, and b is the percentage of gully surface.
In this model, a and b were quantified through a combination of aerial photograph interpretation and field surveys, whereas long-term topsoil (ETopsoil) and gully (EGullies) erosion rates were assumed to be known and representative of any parts of the Kamech catchment. In this study, ETopsoil was set to the mea-sured erosion rate between 2005 and 2012 at the experimental plot P1 (Es_P1, this study) and EGullies was set to 80 t ha−1 yr−1
as estimated by El Khalili et al. (2013). Erosion from dwellings
Fig. 3. (a) Runoff and (b) soil erosion inter-correlations among the gauging stations for the downstream hillslope reservoir (C) that drains all of the catchment area, the experimental field (P1), the gully (P2+G), and the micro-catchment (MC) (blue circles represent event measured data and red crosses represent event reconstructed data).
Table 1. The reconstruction procedure for runoff (R, mm) or soil erosion (Es, t ha−1) used to evaluate missing data in the event database at the three
monitoring stations: the experimental field (P1), the gully (P2+G), and the micro-catchment (MC); Qmax is the maximum specific runoff discharge (m3 s−1 ha−1) and R2 is the linear determination coefficient.
Event with missing data Only erosion data missing Both runoff and erosion data missing
Runoff amount evaluation relationships R_P1 = R_MC/1.12 (R2 = 0.92)
R_P1 = R_P2+G/1.06 (R2 = 0.90)
R_MC = 1.01R_P2+G (R2 = 0.95)
Erosion rate evaluation relationships Es_P1 = 21.29Qmax1.16R0.45 (R2 = 0.74) Es_P1 = Es_MC/0.54 (R2 = 0.62)
Es_MC = 5.96Qmax1.27R0.45 (R2 = 0.92) Es_P1 = Es_P2+G/1.24 (R2 = 0.58)
and scrublands was assumed to be negligible because (i) dwellings are located in the northeastern part of the catchment, which is a very flat area, (ii) most of dwellings are sedimentologically dis-connected from the catchment by dense vegetative hedges at their edges that are used as animal enclosures and field fence, and (iii) the scrublands are located on sandstone outcrops that represent <10% of the catchment area and don’t show field evidence of
impor-tant erosion activities.
6
Results
Rainfall and Runoff Event Distribution
A total of 346 distinct rainfall events were recorded between 1 Sept. 2005 and 31 Aug. 2012 in the Kamech catchment (Table 2). Most rainfall events occurred during the winter and spring seasons (September–April), whereas a smaller number of rainfall events occurred in May, and the summer months were nearly always dry. Only approximately 50% of these rainfall events generated runoff at least at one of the gauging stations during the same period. These runoff events predominantly occurred between October
and March.
Runoff and Erosion at an
Event-Based Timescale
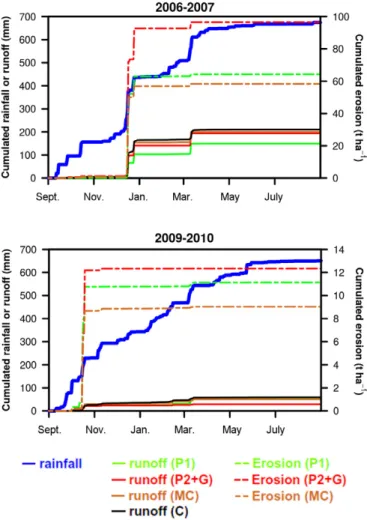
The cumulative rainfall curves for the 7 hydrological yr between 2005 and 2012 (Fig. 4a) show similar inter-annual trends, with a clear distinction between the rainy and dry seasons. However, some inter-annual differences related to the rainfall distribu-tion and amount occurred. For example, annual rainfall varied
between 518 mm for the hydrological year 2006–2007 and 793 mm for 2008–2009. For 2 yr with similar annual amounts (for example 2006–2007 and 2009–2010), the rainfall regime can also be quite different.
Compared with rainfall, the runoff patterns show a higher inter-annual variability (Fig. 4b). Both the runoff regime and inter-annual runoff amounts were considered. For example, annual runoff amounts varied from 25 mm for 2006–2007 to 216 mm for 2008–2009. The runoff regime is more compressed in time than the rainfall regime, as only a few rainfall events contributed to the annual runoff amounts. Runoff generally began only after October (2009–2010) and more generally in the beginning of December, with a significant increase until April. An exceptional 80-mm rainfall event was recorded in December 2006, contributing up to 40% of the total runoff amount in 2006–2007 at MC (37% at P1 and 40% at P2+G).
Intra-annual soil erosion patterns were approximately similar to intra-annual runoff patterns, but some significant increments in the cumulative erosion curve have disappeared compared with the cumulative runoff curves. Time compression was higher for erosion than for runoff because fewer erosion events than runoff events contributed to the total annual amounts. The contribution of a single event in December 2006 (Fig. 4c) represents approxi-mately 65% of the total soil erosion at MC in 2006–2007 (56% at P1 and 63% at P2+G) and 38% of the total soil erosion at MC during the 7 yr (30% at P1 and 36% at P2+G). The contribution of the three largest events represented >50% of the total eroded mate-rial at the three stations. Because the three largest erosive events
Table 2. The distribution of monthly rainfall and runoff events for the seven hydrological years between 2005 and 2012.
Year Sept. Oct. Nov. Dec. Jan. Feb. Mar. Apr. May June July Aug. Annual Number of rainfall events
2005–2006 5 1 10 5 11 4 4 1 2 1 0 1 45 2006–2007 5 4 5 8 1 10 9 2 1 0 0 2 47 2007–2008 2 10 10 8 2 7 9 2 3 0 0 0 53 2008–2009 7 4 3 3 11 7 6 7 1 0 0 1 50 2009–2010 11 11 6 5 7 6 3 5 4 0 0 0 58 2010–2011 6 6 6 5 5 6 3 4 3 0 0 0 44 2011–2012 1 7 6 6 9 8 5 4 2 0 1 0 49 Sum 37 43 46 40 46 48 39 25 16 1 1 4 346
Number of runoff events
2005–2006 0 0 0 4 12 3 0 0 0 0 0 0 18 2006–2007 1 2 0 6 0 5 4 0 0 0 0 0 18 2007–2008 1 7 6 7 0 1 1 0 0 0 0 0 23 2008–2009 0 3 0 1 6 8 5 4 0 0 0 0 26 2009–2010 0 11 5 1 4 4 3 1 1 0 0 0 30 2010–2011 2 3 3 4 3 5 2 0 0 0 0 0 22 2011–2012 0 3 3 5 5 8 3 1 0 0 0 0 28 Sum 4 29 17 28 30 34 18 6 1 0 0 0 167
occurred consecutively in the same month (December 2006), the 2006–2007 hydrological year clearly appears as an exceptional erosive year with >58 t ha−1 at MC (64 t ha−1 at P1 and 96 t ha−1
at P2+G), whereas the total erosion rate in 2010–2011 was only 0.65 t ha−1 at MC (0.41 t ha−1 at P1 and 0.31 t ha−1 at P2+G).
The comparison of runoff and erosion responses at the different stations is illustrated in Fig. 5 by considering two hydrological years with a similar rainfall amount but a different rainfall regime. The comparison of the runoff response at the different stations
shows a very low variability. The inter-station runoff response vari-ability appears to be much smaller than the inter-annual runoff response variability at one station. Very similar runoff responses for MC and C were always observed, whereas the runoff response
at a fine spatial scale can differ from the runoff response at large scales (P1 in 2006–2007 or P2+G in 2009–2010). In terms of soil loss, similar patterns were observed, with generally higher erosion rates at P2+G than at P1 or MC.
Runoff and Erosion at a Monthly Timescale
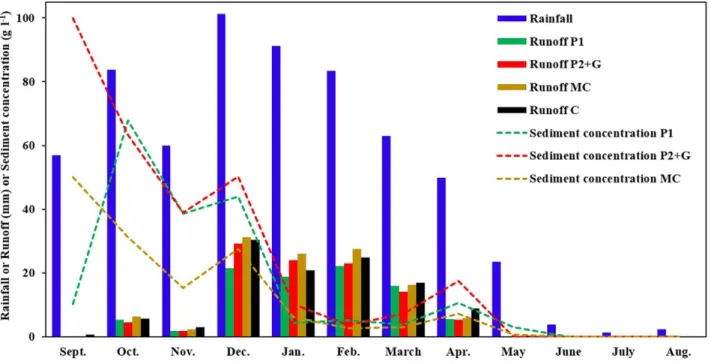
The mean monthly rainfall, runoff, and sediment concentration distributions at the four gauging stations were analyzed and com-pared for the period from 2005 to 2012 (Fig. 6).
Runoff rates at the four stations exhibited approximately similar evolution throughout the year: low runoff from September to November and high runoff from December to March or April. Approximately 70% of the total annual runoff occurred between December and February, whereas only 40% of the total annual rainfall occurred during these 3 mo. In contrast, <8% of the runoff occurred from September to November, whereas these 3 mo con-tributed >35% of the annual rainfall. If topsoil moisture plays a role in runoff generation in Kamech, the monitoring of several piezom-eters showed that the soil profile was never completely saturated
Fig. 4. Mean cumulative rainfall, runoff, and soil loss, for the different hydrological years (2005–2012) at the micro-catchment (MC) station.
Fig. 5. Mean cumulative rainfall, runoff, and soil loss at the gauging stations for the downstream hillslope reservoir (C) that drains all of the catchment area, the experimental field (P1), the gully (P2+G), and the micro-catchment (MC) for the hydrological years 2006–2007 and 2009–2010. Note that the right-hand axes are scaled differently.
except very locally along the main channel features (results not shown). Consequently, an infiltration excess (Hortonian) overland flow process dominated the runoff generation process in Kamech, and the intra-annual evolution of runoff cannot be explained by the saturation excess overland flow process.
In terms of sediment concentrations, some very similar seasonal variations were observed at the three stations, with the exception of September values that are based on nonsignificant runoff amounts. Very high mean monthly sediment concentrations (generally up to 20 g L−1) were observed from October to December. During these
3 mo, quite similar sediment concentration values were recorded for P1 and P2+G, whereas the sediment concentration at MC was lower. From January to May, sediment concentrations were similar for the three stations and clearly lower (approximately 5 g L−1) except for
April, where the mean monthly sediment concentrations increased to approximately 10 g L−1 for MC and P1 and to 20 g L−1 for P2+G.
A time lag between runoff and soil erosion responses is apparent, with maximum sediment concentrations occurring in autumn while the maximum runoff response occurred in winter (Fig. 6).
As a result, the month of December clearly appears to be the critical month for soil erosion because of the convergence of high runoff rates and still high sediment concentration values. October appears to be the second most significant month in terms of the soil erosion contribution and despite its low runoff amount.
Runoff and Erosion at the Annual Scale
The mean annual runoff at the different stations was not significantly different (Fig. 7a) when considering the range of mea-surement uncertainties. The annual runoff coefficients varied from approximately 5% for 2010–2011 to about 30% for 2006–2007 and differed slightly from one station to another.
Only erosion at the P2+G station was significantly higher than erosion at the other stations (Fig. 7b). This higher soil budget recorded for P2+G compared with P1 may be attributed to the high contribution of gully erosion processes.
Contributions of Erosion Processes
Table 3 presents the repartitioning among cultivated topsoil, gul-lies, and other areas (dwellings and scrublands) at different scales.
Fig. 6. Mean monthly rainfall, runoff, and sediment concentrations at the gauging stations for the downstream hillslope reservoir (C) that drains all of the catchment area, the experimental field (P1), the gully (P2+G), and the micro-catchment (MC) for the period from 2005 to 2012.
Fig. 7. Mean annual (a) runoff and (b) soil erosion calculated between 2005 and 2012 at the down-stream hillslope reservoir (C) that drains all of the catchment area, the experimental field (P1), the gully (P2+G), and the micro-catchment (MC) (the soil erosion rate at C was calculated for the period between 1994 and 2012). A systematic range of 15% for runoff measurements and 30% for soil erosion measurements was considered to depict measurement uncertainties.
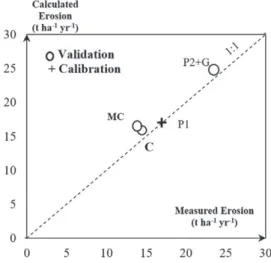
Based on these values, the results of the linear model (Fig. 8) showed that the values for long-term erosion rates calculated by the model fit well with measured erosion data whatever the con-sidered station (R2 = 0.97). In other words, the erosion amount in
the Kamech catchment seems to linearly depend on the relative percentage of the upstream cultivated and gully areas.
The determination of the sediment sources in the Kamech catch-ment using this simple linear model showed that the surface topsoil delivered approximately 75% of the sediment at the MC and C stations (Fig. 9). This result implies that surface erosion processes, including rill and interrill erosion, are the dominant processes at the catchment scale and that gully erosion processes contribute only 25% of the sediment entering into the lake reservoir.
6
Discussion
Temporal Variability of Runoff
and Soil Erosion
Our study, which is based on seven continuous years of mea-surements, showed important temporal variability for both surface runoff and soil erosion. First, runoff and soil erosion showed a strong inter-annual variability that is quite typical in a Mediterranean context (Rodrigo Comino et al., 2016; Raclot et al., 2017) and can be directly related with rainfall regime variabil-ity. Second, our results highlighted a strong seasonality of runoff and soil erosion responses that resulted in a quite unusual time lag between runoff and soil erosion responses. Both the presence of cracks, especially in autumn, and the vegetation cover growth in spring were identified as major factors explaining the intra-annual evolution of the runoff and erosion response. Four characteristic periods were identified:
ʶ September–November: Heavy rainfall on bare soil with open cracks induced very low runoff with very high sediment con-centrations. The low runoff that occurred when topsoil cracks were present can be related to bypass flow, which enters the soil through open topsoil cracks (Inoubli et al., 2016). The high sediment concentration in surface runoff in autumn may be the
result of soil shrinkage processes that occurred during the dry season and destroyed topsoil crusting and aggregation, which favored future soil particle detachment and export. Another hypothesis is that the shrink–swell process generates microde-pressions close to the cracks that can channelize runoff and locally activate micro-rill processes. Agricultural tillage opera-tions that generally occurred in November when a cumulated rainfall amount had reached 150 mm may also contribute to maintain both high infiltration rates and topsoil conditions that favor the detachment process. Finally, the cumulated soil loss amount during this period reached approximately 15% of the total soil loss, whereas cumulated runoff reached only approximately 7%. In fact, significant sediment yields occurred only during a very few runoff events. This period could be con-sidered a high sediment yield risk because of very high sediment fluxes as soon as runoff occurred.
ʶ December–February: High rainfall amounts with low vegeta-tion cover and recently closed cracks produced the majority of the runoff (approximately 70% of the total runoff) and soil losses (approximately 75% of the total soil losses). December alone appeared to be by far the riskiest month in terms of soil
Table 3. Percentages of cultivated topsoil, gullies, and other areas at the spatial scales of the downstream hillslope reservoir (C) that drains all of the catchment area, the experimental field (P1), the gully (P2+G), and the micro-catchment (MC).
Scale Cultivated topsoil surface Gully surface Other area ———————————————— % —————————————— —— P1 100 0 0 P2+G 87.6 12.4 0 MC 71.7 4.6 23.7 C 70 4.7 25.3
Fig. 8. Erosion calculated with the linear model as a function of measured erosion at the different stations: the downstream hillslope reservoir (C) that drains all of the catchment area, the experimental field (P1), the gully (P2+G), and the micro-catchment (MC).
Fig. 9. Percentages of contributions of processes to total sediment load at the different gauging stations: the downstream hillslope reservoir (C) that drains all of the catchment area, the experimental field (P1), the gully (P2+G), and the micro-catchment (MC).
losses, with a contribution to total soil loss of 60% despite a con-tribution to total runoff of <30%. The very significant decrease in sediment concentration that occurred between December and January was probably the result of (i) the combined effects of high particle flushing that occurred in December, (ii) the evolution of soil surface characteristics induced by successive rainfall events, and (iii) progressive vegetation growth. ʶ March–May: Medium to dense vegetation cover with low
rain-fall amounts produced low runoff, low sediment concentration, and low soil erosion.
ʶ June–August: Very low rainfall amounts on bare soil and newly opened cracks generated no runoff and no soil erosion.
Numerous previous studies have already identified a seasonality of the infiltration–runoff response in the Mediterranean context. For example, Cerdà (1997, 2002) described the evolution of the infiltra-tion rate in relainfiltra-tion to soil moisture and showed greater soil erosion rates on eroded surfaces in eastern Spain during the wet season. Jorgensen and Gardner (1987) found the importance of the surface morphology for seasonal infiltration and runoff rates on disturbed soils, as already mentioned by Schümm and Lusby (1963) on badland slopes. In Kamech, the presence of open cracks in autumn was clearly the main factor affecting both runoff and erosion in the beginning of the hydrological year. This is the first time to our knowledge that a time lag between the erosion response and the runoff response has been so clearly highlighted as a result of the complex temporal interactions between several factors and processes.
In some cases, soil erosion can be dominated by a few extreme events. Therefore, monitoring and simulation studies need to be long enough to capture these erosive events. For our study and despite the variation in rainfall–runoff–sediment responses at different scales, the contribution of the major events to the annual balance was remarkably high. The data show a strong sediment time com-pression, with the contribution of a few events representing a very high proportion of the total soil losses. A similar result was found by González-Hidalgo et al. (2007) in western Mediterranean areas, where three daily erosive events per annum represented >50% of the soil erosion and regardless of the total amount of soil eroded. Analyses of the extreme events already suggested that a single event (or just a few events) may produce a high amount of sediment trans-port, and they can exceed the annual or interannual geomorphic activity (Lane and Kidwell, 2003; Lenzi et al., 2003). This explains why research attention has focused on major events and their effects (Hudson, 2003; Tomkins et al., 2007). In Kamech, the high avail-ability of soil particles eroded during extreme events seems to be promoted by the shrink–swell processes occurring during the dry season. This behavior is different of what occurs in other catchments, where the availability of soil particles can result from successive and previous low-intensity events, especially in the case of catchments with low sedimentological connectivity where intra-catchment deposition is favored (Raclot et al., 2009).
Spatial Variability of Runoff and Soil Erosion
In Kamech, runoff slightly increased from the field to the micro-catchment and then was constant from the micro-micro-catchment to the catchment outlet. Previous studies in Mediterranean areas (Cammeraat, 2004; Boix-Fayos et al., 2007) and in other semi-arid areas throughout the world (Estèves and Lapetite, 2003; Yair and Raz-Yassif, 2004; Parsons et al., 2006) generally described a decrease of runoff with an increase in the spatial scale. These researchers explained this decrease in runoff with increasing spa-tial area by an increase in spaspa-tial heterogeneity in the soil surface characteristics and the emergence of other processes such as re-infiltration in downslope areas of a catchment or transmission losses in stream channels. In the studied catchment, the runoff response didn’t follow this downward trend but was found to be similar between the monitored spatial scale at an event (Fig. 3) or monthly (Fig. 6) timescale. Such a linear runoff response across the spatial scale can be explained by the specific context of the Kamech catchment, which combines (i) a large predominance of a Hortonian overflow process, (ii) a very high hydrological connec-tivity induced by a dense permanent gully network, and (iii) a very dry summer season that limits vegetation cover inside the gully and channel features. Some minor deviations from this linear behavior may be noticed, however. For example, the runoff amount at the catchment outlet is slightly higher than at other station outlets during March and April, which is in line with the observation of short periods of wadi baseflow that occurred in spring at the catchment outlet and indicated a small contribution of shallow groundwater to wadi flow. Another example is the small increase in runoff between the field and the micro-catchment that can be explained by the presence of a compacted track inside the micro-catchment that behaved as a low-infiltration area.
Sediment loads usually depend on a wide range of variables and reflect the combined effect of all active and interacting runoff, erosion, and sediment deposition processes and the time duration of the measurements (de Vente and Poesen, 2005). Surprisingly, soil erosion dynamics in the studied area showed very similar pat-terns from field to catchment outlets. The difference in mean inter-annual soil erosion amounts when moving from one sta-tion to another was well explained using a linear model based on the percentage of gully and cultivated areas. Again, the very high hydro-sedimentary connectivity of the Kamech catchment, which is confirmed by field evidence of the absence of significant perma-nent sediment deposition areas upstream of the outlet reservoir, is likely to be the main reason of such a linear behavior. In fact, the dense network of permanent gullies and wadis in the Kamech catchment acts as both sediment sources and connectivity features that facilitate sediment transport from field to catchment outlet.
Erosion Processes and Sediment Sources
The determination of the sediment sources in the Kamech catch-ment using a simple linear model showed that the topsoil erosion processes delivered approximately 75% of the sediment at the
Kamech catchment lake during a period of 7 yr. This result is consistent with results of Ben Slimane et al. (2013), who found, using a mixing model based on radionuclides, that 80% of the soil inputs into the Kamech reservoir during the 1994 to 2012 period came from topsoil sources. This result is also in agreement with the results obtained by Jebari et al. (2010), who used a rainfall erosiv-ity analysis to calculate that interrill processes produced 83% of the erosion within the Kamech catchment. However, the results presented here differ from the conclusions of several other erosion studies conducted in the Mediterranean region that indicate a pre-dominance of gully erosion (Poesen et al., 1996, 2002, 2003). One explanation for this difference may be that the low rates of sheet and rill erosion and the relatively large importance of gully erosion have often been attributed to the shallow depth and high extent of stoniness of many Mediterranean soils (Poesen et al., 1994; Poesen and Hooke, 1997; Cerdan et al., 2010), which is not the case in the study catchment.
6
Conclusions
This study documented the temporal dynamics of the runoff and erosion response during a 7-yr period at the outlet of four nested gauging stations in a cultivated Mediterranean catchment domi-nated by cracking soils. The presence of open cracks was identified as a major factor controlling both the runoff and soil loss response in autumn whatever the spatial scale. December was identified as a very risky month in terms of soil losses, and this single month con-tributed 60% of the total soil loss in the year. The autumn period was also identified as an erosion-risk period, with very high average sediment concentrations (up to 50 g L−1). The contribution of a
very few major events to the annual balance was remarkably high for the whole study period, which revealed an extreme sediment time compression in this catchment. In terms of spatial variations, the runoff amounts increased with an increase in the drainage area or scale so that the specific runoff rate was quite similar across scales. This behavior has been explained by a high predominance of the Hortonian runoff process and very high hydrological con-nectivity. For soil erosion, a slight decrease in the erosion budgets was observed between the field and the catchment scale. A simple linear model combining a single rate of topsoil erosion and a single rate of gully erosion and weighted by their respective surface areas successfully reproduced the differences observed in the mean annual erosion rates between the spatial scales. The numerous per-manent gullies in Kamech have to be considered both as sediment contributing sources and as connectivity components. Finally, our results showed that major erosion processes within the Kamech catchment were related to sheet and rill erosion, which contributed 75% of the total soil erosion budget at the catchment outlet, and that most of sediment yields occurred from October to December. Thus, this study contributed to our understanding of hydrologi-cal and erosive processes in a cultivated marly Mediterranean catchment and provided important information to help identify effective sediment control techniques adapted to such a context.
Acknowledgments
Nesrine Inoubli benefited from a Ph.D. grant from IRD. This study was financially supported by ARIMNet2 (ERA-NET) MASCC project (Grant Agreement no. 618127) and ANR TRANSMED ALMIRA project (Grant Agreement no. ANR-12-TMED-0003-01). The OMERE observatory (http://www.obs-omere.org), funded by the French institutes INRA and IRD and coordinated by INAT Tunis, INRGREF Tunis, and UMR LISAH Montpel-lier, is acknowledged for providing a portion of the data used in this study. We would like to acknowledge the field staff, and especially Radhouane Hamdi, for the help in data collection.
References
Albergel, J., S. Nasri, and M. Boufaroua. 1999. Small dams water balance: Experi-mental conditions, data processing and modeling in arid and semiarid areas. In: R. Berndtsson, editor, Proceedings of the International Seminar on Rain Water Harvesting and Management of Small Reservoirs in Arid and Semiarid Areas, Lund, Sweden. 29 June–2 July 1998. Dep. of Water Resour. Eng., Lund Inst. of Technol., Lund, Sweden. p. 45–48.
Albergel, J., S. Nasri, and J.-M. Lamachère. 2007. Les lacs et barrages collin-aires: Infrastructures hydrauliques d’aménagement et de conservation des terres agricoles en zone semi-aride méditerranéenne. Sols Tunisie 2:7–20. Assouline, S., J.S. Selker, and J.-Y. Parlange. 2007. A simple accurate method to
predict time of ponding under variable intensity rainfall. Water Resour. Res. 43:W03426. doi:10.1029/2006WR005138
Bagarello, V., M. Iovino, and W. Reynolds. 1999. Measuring hydraulic conduc-tivity in a cracking clay soil using the Guelph permeameter. Trans. ASAE 42:957–964. doi:10.13031/2013.13276
Ben Slimane, A., D. Raclot, O. Evrard, M. Sanaa, I. Lefèvre, A. Mehdi, et al. 2013. Fingerprinting sediment sources in the outlet reservoir of a hilly cultivated catchment in Tunisia. J. Soils Sediments 13:801–815. doi:10.1007/s11368-012-0642-6
Boix-Fayos, C., M. Martínez-Mena, E. Arnau-Rosalén, A. Calvo-Cases, V. Castillo, and J. Albaladejo. 2006. Measuring soil erosion by field plots: Understand-ing the sources of variation. Earth Sci. Rev. 78:267–285. doi:10.1016/j.earsci-rev.2006.05.005
Boix-Fayos, C., M. Martinez-Mena, A. Calvo Cases, E. Arnau Rosalén, J. Al-baladejo, and V. Castillo. 2007. Causes and underlying processes of mea-surement variability in field erosion plots in Mediterranean conditions. Earth Surf. Processes Landforms 32:85–101. doi:10.1002/esp.1382
Cammeraat, L.H. 2002. A review of two strongly contrasting geomorphologi-cal systems within the context of sgeomorphologi-cale. Earth Surf. Processes Landforms 27:1201–1222. doi:10.1002/esp.421
Cammeraat, L.H. 2004. Scale dependent thresholds in hydrological and ero-sion response of a semi-arid catchment in southeast Spain. Agric. Ecosyst. Environ. 104:317–332. doi:10.1016/j.agee.2004.01.032
Cerdà, A. 1997. Seasonal changes of the infiltration rates in a Medi-terranean scrubland on limestone. J. Hydrol. 198:209–225. doi:10.1016/S0022-1694(96)03295-7
Cerdà, A. 2002. The effect of season and parent material on water erosion on highly eroded soils in eastern Spain. J. Arid Environ. 52:319–337. doi:10.1006/ jare.2002.1009
Cerdà, A., R. Brazier, M. Nearing, and J. de Vente. 2013. Scales and erosion. Catena 102:1–2. doi:10.1016/j.catena.2011.09.006
Cerdan, O., G. Govers, Y. Le Bissonnais, K. Van Oost, J. Poesen, N. Saby, et al. 2010. Rates and spatial variations of soil erosion in Europe: A study based on erosion plot data. Geomorphology 122:167–177. doi:10.1016/j.geo-morph.2010.06.011
Cerdan, O., Y. Le Bissonnais, G. Govers, V. Lecomte, K. van Oost, A. Coutu-rier, et al. 2004. Scale effect on runoff from experimental plots to catch-ments in agricultural areas in Normandy. J. Hydrol. 299:4–14. doi:10.1016/j. jhydrol.2004.02.017
Collinet, J., and P. Zante. 2005. Analyse du ravinement de bassins versants à retenues collinaires sur sols à fortes dynamiques structurales (Tunisie). Geo-morph.: Relief, Processus, Environ. 1:61–74.
De Franchis, L., and L. Ibanez. 2003. Threats to soils in Mediterranean countries. Document review. Plan Bleu Pap. 2. Plan Bleu UNEP, Sophia Antipolis, Val-bonne, France.
de Vente, J., and J. Poesen. 2005. Predicting soil erosion and sediment yield at the basin scale: Scale issues and semi-quantitative models. Earth Sci. Rev. 71:95–125. doi:10.1016/j.earscirev.2005.02.002
de Vente, J., J. Poesen, M. Arabkhedri, and G. Verstraeten. 2007. The sediment delivery problem revisited. Prog. Phys. Geogr. 31:155–178. doi:10.1177/0309133307076485
de Vente, J., J. Poesen, P. Bazzoffi, A. Van Ropaey, and G. Verstraeten. 2006. Predicting catchment sediment yield in Mediterranean environments: The importance of sediment sources and connectivity in Italian drainage ba-sins. Earth Surf. Processes Landforms 31:1017–1034. doi:10.1002/esp.1305 de Vente, J., J. Poesen, G. Verstraeten, A. Van Rompaey, and G. Govers. 2008.
Spatially distributed modelling of soil erosion and sediment yield at regional scales in Spain. Global Planet. Change 60:393–415.
doi:10.1016/j.glopla-cha.2007.05.002
El Khalili, A., D. Raclot, H. Habaieb, and J.M. Lamachère. 2013. Fac-tors and processes of permanent gully evolution in a Mediterranean marly environment (Cape Bon, Tunisia). Hydrol. Sci. J. 58:1519–1531. doi:10.1080/02626667.2013.824086
Estèves, M., and J.M. Lapetite. 2003. A multi-scale approach of runoff genera-tion in a Sahelian gully catchment: A case study in Niger. Catena 50:255– 271. doi:10.1016/S0341-8162(02)00136-4
Favre, F., P. Boivin, and M. Wopereis. 1997. Water movement and soil swelling in a dry, cracked Vertisol. Geoderma 78:113–123. doi:10.1016/S0016-7061(97)00030-X
Gómez, J.A., M.A. Nearing, J.V. Giraldez, and E.E. Albert. 2001. Analysis of sources of variability of runoff volume in a 40 plots experiment using a nu-merical model. J. Hydrol. 248:183–197. doi:10.1016/S0022-1694(01)00402-4 Gómez, J.A., T. Vanwalleghem, A. De Hoces, and E.V. Taguas. 2014.
Hydrologi-cal and erosive response of a small catchment under olive cultivation in a vertic soil during a five-year period: Implications for sustainability. Agric. Ecosyst. Environ. 188:229–244. doi:10.1016/j.agee.2014.02.032
González-Hidalgo, J.C., M. Brunetti, and M. de Luis. 2011. A new tool for monthly precipitation analysis in Spain: MOPREDAS database (monthly precipita-tion trends December 1945–November 2005). Int. J. Climatol. 31:715–731. doi:10.1002/joc.2115
González-Hidalgo, J.C., M. de Luis, and J.L. Peña. 2007. A review of daily soil erosion in western Mediterranean areas. Catena 71:193–199. doi:10.1016/j. catena.2007.03.005
Hudson, P.F. 2003. Event sequence and sediment exhaustion in the Lower Pa-nuco basin, Mexico. Catena 52:57–76. doi:10.1016/S0341-8162(02)00145-5 Inoubli, N., D. Raclot, R. Moussa, H. Habaieb, and Y. Le Bissonnais. 2016. Soil
cracking effects on hydrological and erosive processes: A study case in Mediterranean cultivated vertisols. Hydrol. Processes 30:4154–4167. doi:10.1002/hyp.10928
Jebari, S., R. Berndtsson, A. Bahri, and M. Boufaroua. 2010. Spatial soil loss risk and reservoir siltation in semi-arid Tunisia. Hydrol. Sci. J. 55:121–137. doi:10.1080/02626660903529049
Jorgensen, D.W., and T.W. Gardner. 1987. Infiltration capacity of disturbed soils: Temporal change and lithologic control. J. Am. Water Resour. Assoc. 23:1161–1172. doi:10.1111/j.1752-1688.1987.tb00868.x
Kefi, M., and K. Yoshino. 2010. Evaluation of the economic effects of soil erosion risk on agricultural productivity using remote sensing: Case of watershed in Tunisia. In: K. Kahiwara et al., editors, Networking the world with remote sensing: ISPRS Technical Commission 8 Symposium, Kyoto, Japan. 9–12 Aug. 2010. ISPRS Arch., Vol. 38, Part 8. Copernicus, Göttingen, Germany. p. 930–935.
Lane, L.J., M. Hernandez, and M. Nichols. 1997. Processes controlling sediment yield from watersheds as functions of spatial scale. Environ. Modell. Softw. 12:355–369. doi:10.1016/S1364-8152(97)00027-3
Lane, L.J., and M.R. Kidwell. 2003. Hydrology and soil erosion. In: M.P. Mc-Claran et al., editors, Santa Rita Experimental Range: 100 Years (1903 to 2003) of Accomplishments and Contributions: Confer-ence Proceedings, Tucson, AZ. 30 Oct–1 Nov. 2003. USDA For. Serv. Proc. RMRS-P-30. Rocky Mtn. Res. Stn., Fort Collins, Co. p. 92–100. https://www.fs.fed.us/rm/pubs/rmrs_p030/rmrs_p030_092_100.pdf
Le Bissonnais, Y., C. Montier, J. Daroussin, and D. King. 1998. Cartographie de l’aléa “érosion des sols” en France. Collection Etudes et Travaux 18. Inst. Français de l’environnement, Orléans, France. http://www.side.devel- oppement-durable.gouv.fr/EXPLOITATION/Infodoc/ged/viewportalpub-lished.ashx?eid=IFD_FICJOINT_0012020
Lenzi, M.A., L. Mao, and F. Comiti. 2003. Interannual variation of suspended sediment load and sediment yield in an alpine catchment. Hydrol. Sci. J. 48:899–915. doi:10.1623/hysj.48.6.899.51425
Mathier, L., and A.G. Roy. 1996. A study of the effects of spatial scale on param-eters of sediment transport equation for sheet wash. Catena 26:161–169. doi:10.1016/0341-8162(95)00038-0
Mekki, I., J. Albergel, N. Ben Mechlia, and M. Voltz. 2006. Assessment of over-land flow variation and blue water production in a farmed semi-arid wa-ter harvesting wawa-tershed. Phys. Chem. Earth 31:1048–1061. doi:10.1016/j. pce.2006.07.003
Messing, I., and N. Jarvis. 1993. Temporal variation in the hydraulic conductivity of a tilled clay soil as measured by tension infiltrometers. J. Soil Sci. 44:11–24. doi:10.1111/j.1365-2389.1993.tb00430.x
Morgan, R.P.C. 2005. Soil erosion and conservation. 3rd ed. Blackwell Publ., Ox-ford, UK.
Nearing, M.A., G. Govers, and L.D. Norton. 1999. Variability in soil erosion data from replicated plots. Soil Sci. Soc. Am. J. 63:1829–1835. doi:10.2136/ sssaj1999.6361829x
Parsons, A.J., R.E. Brazier, J. Wainwright, and D.M. Powell. 2006. Scale relation-ships in hillslope runoff and erosion. Earth Surf. Processes Landforms 31:1384– 1393. doi:10.1002/esp.1345
Poesen, J., and J. Hooke. 1997. Erosion, flooding and channel management in Mediterranean environments of southern Europe. Prog. Phys. Geogr. 21:157–199. doi:10.1177/030913339702100201
Poesen, J., J. Nachtergale, G. Vertstraeten, and C. Valentin. 2003. Gully ero-sion and environmental change: Importance and research needs. Catena 50:91–133. doi:10.1016/S0341-8162(02)00143-1
Poesen, J., D. Torri, and K. Bunte. 1994. Effects of rock fragments on soil ero-sion by water at different spatial scales: A review. Catena 23:141–166. doi:10.1016/0341-8162(94)90058-2
Poesen, J., K. Vandaele, and B. Van Wesemael. 1996. Contribution of gully ero-sion to sediment production on cultivated lands and rangelands. IAHS Publ. 236:251–266.
Poesen, J., L. Vandekerckhove, J. Nachtergaele, D.O. Wijdenes, G. Verstraeten, and B. Van Wesemael. 2002. Gully erosion in dryland environments. In: L.J. Bull and M.J. Kirkby, editors, Dryland rivers: Hydrology and geomorphology of semi-arid channels. John Wiley & Sons, Chichester, UK. p. 229–262. Porto, P., D.E. Walling, C. Alewell, G. Callegari, L. Mabit, N. Mallimo, et al. 2014.
Use of a 137Cs re-sampling technique to investigate temporal changes in soil erosion and sediment mobilisation for a small forested catchment in southern Italy. J. Environ. Radioact. 138:137–148. doi:10.1016/j.jen-vrad.2014.08.007
Raclot, D., and J. Albergel. 2006. Runoff and water erosion modelling using WEPP on a Mediterranean cultivated catchment. Phys. Chem. Earth 31:1038–1047. doi:10.1016/j.pce.2006.07.002
Raclot, D., Y. Le Bissonnais, M. Annabi, M. Sabir, and A. Smetanova. 2017. Main issues for preserving Mediterranean soil resources from water erosion under global change. Land Degrad. Dev. doi:10.1002/ldr.2774
Raclot, D., Y. Le Bissonnais, X. Louchart, P. Andrieux, R. Moussa, and M. Voltz. 2009. Soil tillage and scale effects on erosion from fields to catchment in a Mediterranean vineyard area. Agric. Ecosyst. Environ. 134:201–210. doi:10.1016/j.agee.2009.06.019
Rodrigo Comino, J., J.D. Ruiz Sinoga, J.M. Senciales González, A. Guerra-Merchán, M. Seeger, and J.B. Ries. 2016. High variability of soil erosion and hydrological processes in Mediterranean hillslope vineyards (Montes de Málaga, Spain). Catena 145:274–284. doi:10.1016/j.catena.2016.06.012 Roose, H., R. Chebbani, and L. Bourougaa. 2000. Ravinement en Algérie:
Ty-pologie, facteurs de contrôle, quantification et réhabilitation. Sécheresse 11:317–326.
Sadeghi, S.H.R., M.B. Seghaleh, and A.S. Rangavar. 2013. Plot sizes dependen-cy of runoff and sediment yield estimates from a small watershed. Catena 102:55–61. doi:10.1016/j.catena.2011.01.003
Schümm, S.A., and G.C. Lusby. 1963. Seasonal variations of infiltration capacity and runoff on hillslopes of western Colorado. J. Geophys. Res. 68:3655–3666. doi:10.1029/JZ068i012p03655
Tomkins, K.M., G.S. Humphreys, M.T. Wilkinson, D. Fink, P.P. Hesse, S.H. Doerr, et al. 2007. Contemporary versus long-term denudation along a passive plate margin: The role of extreme events. Earth Surf. Processes Landforms 32:1013–1031. doi:10.1002/esp.1460
Valentin, C., J. Poesen, and Y. Li. 2005. Gully erosion: Impacts, factors and con-trols. Catena 63:132–153. doi:10.1016/j.catena.2005.06.001
Vanmaercke, M., W. Maetens, J. Poesen, B. Jankauskas, G. Jankauskiene, G. Verstraeten, and J. de Vente. 2012. A comparison of measured catchment sediment yields with measured and predicted hillslope erosion rates in Eu-rope. J. Soils Sediments 12:586–602. doi:10.1007/s11368-012-0479-z Vanmaercke, M., J. Poesen, G. Verstraeten, and J. de Vente. 2011. Sediment
yield in Europe: Spatial patterns and scale dependency. Geomorphology 130:142–161. doi:10.1016/j.geomorph.2011.03.010
Wainwright, J., and A.J. Parsons. 2002. The effect of temporal variations in rain-fall on scale dependency in runoff coefficients. Water Resour. Res. 38:1271. doi:10.1029/2000WR000188
Walling, D.E. 1983. The sediment delivery problem. J. Hydrol. 65:209–237. doi:10.1016/0022-1694(83)90217-2
Wei, W., L. Chen, L. Yang, B. Fu, and R. Sun. 2012. Spatial scale effects of wa-ter erosion dynamics: Complexities, variabilities, and uncertainties. Chin. Geogr. Sci. 22:127–143. doi:10.1007/s11769-012-0524-2
Wischmeier, W.H., and D.D. Smith. 1978. Predicting rainfall erosion losses: A guide to conservation planning. Agric. Handb. 537. USDA Science and Educ. Admin., Hyattsville, MD.
Yaalon, D.H. 1997. Soils in the Mediterranean region: What makes them differ-ent? Catena 28:157–169. doi:10.1016/S0341-8162(96)00035-5
Yair, A., and N. Raz-Yassif. 2004. Hydrological processes in a small arid catch-ment: Scale effects of rainfall and slope length. Geomorphology 61:155– 169. doi:10.1016/j.geomorph.2003.12.003
Zehe, E., and M. Sivapalan. 2009. Threshold behaviour in hydrological systems as (human) geoecosystems: Manifestations, controls, implications. Hydrol. Earth Syst. Sci. 13:1273–1297. doi:10.5194/hess-13-1273-2009