HAL Id: insu-03096513
https://hal-insu.archives-ouvertes.fr/insu-03096513
Submitted on 5 Jan 2021
HAL is a multi-disciplinary open access
archive for the deposit and dissemination of
sci-entific research documents, whether they are
pub-lished or not. The documents may come from
teaching and research institutions in France or
abroad, or from public or private research centers.
L’archive ouverte pluridisciplinaire HAL, est
destinée au dépôt et à la diffusion de documents
scientifiques de niveau recherche, publiés ou non,
émanant des établissements d’enseignement et de
recherche français ou étrangers, des laboratoires
publics ou privés.
present-day soil erosion in the agricultural Middle Hills
of Nepal
A.J. West, M. Arnold, D.L. Bourles, Karim Keddadouche, M. Bickle, T. Ojha
To cite this version:
A.J. West, M. Arnold, D.L. Bourles, Karim Keddadouche, M. Bickle, et al.. High natural erosion
rates are the backdrop for present-day soil erosion in the agricultural Middle Hills of Nepal. Earth
Surface Dynamics, European Geosciences Union, 2015, 3 (3), pp.363-387. �10.5194/esurf-3-363-2015�.
�insu-03096513�
www.earth-surf-dynam.net/3/363/2015/ doi:10.5194/esurf-3-363-2015
© Author(s) 2015. CC Attribution 3.0 License.
High natural erosion rates are the backdrop for
present-day soil erosion in the agricultural
Middle Hills of Nepal
A. J. West1, M. Arnold2,*, G. Aumaître2,*, D. L. Bourlès2,*, K. Keddadouche2,*, M. Bickle3, and T. Ojha4
1Department of Earth Sciences, University of Southern California, Los Angeles, CA 90089, USA 2Aix-Marseille Université, CNRS-IRD-Collège de France, UM 34 CEREGE, Technopôle de l’Environnement
Arbois-Méditerranée, BP80, 13545 Aix-en-Provence, France
3Department of Earth Sciences, University of Cambridge, Cambridge CB2 3EQ, UK 4Department of Geosciences, University of Arizona, Tucson, AZ 85721, USA
*The ASTER Team
Correspondence to: A. J. West (joshwest@usc.edu)
Received: 9 July 2014 – Published in Earth Surf. Dynam. Discuss.: 11 August 2014 Revised: 1 May 2015 – Accepted: 13 May 2015 – Published: 23 July 2015
Abstract. Although agriculturally accelerated soil erosion is implicated in the unsustainable environmental degradation of mountain environments, such as in the Himalaya, the effects of land use can be challenging to quantify in many mountain settings because of the high and variable natural background rates of erosion. In this study, we present new long-term denudation rates, derived from cosmogenic10Be analysis of quartz in river sediment from the Likhu Khola, a small agricultural river basin in the Middle Hills of central Nepal. Calculated long-term denudation rates, which reflect background natural erosion processes over 1000+ years prior to agri-cultural intensification, are similar to present-day sediment yields and to soil loss rates from terraces that are well maintained. Similarity in short- and long-term catchment-wide erosion rates for the Likhu is consistent with data from elsewhere in the Nepal Middle Hills but contrasts with the very large increases in short-term erosion rates seen in agricultural catchments in other steep mountain settings. Our results suggest that the large sediment fluxes exported from the Likhu and other Middle Hills rivers in the Himalaya are derived in large part from natural processes, rather than from soil erosion as a result of agricultural activity. Catchment-scale erosional fluxes may be similar over short and long timescales if both are dominated by mass wasting sources such as gul-lies, landslides, and debris flows (e.g., as is evident in the landslide-dominated Khudi Khola of the Nepal High Himalaya, based on compiled data). As a consequence, simple comparison of catchment-scale fluxes will not necessarily pinpoint land use effects on soils where these are only a small part of the total erosion budget, unless rates of mass wasting are also considered. Estimates of the mass wasting contribution to erosion in the Likhu im-ply catchment-averaged soil production rates on the order of ∼ 0.25–0.35 mm yr−1, though rates of mass wasting are poorly constrained. The deficit between our best estimates for soil production rates and measurements of soil loss rates supports conclusions from previous studies that terraced agriculture in the Likhu may not be associated with a large systematic soil deficit, at least when terraces are well maintained, but that poorly managed terraces, forest, and scrubland may lead to rapid depletion of soil resources.
1 Introduction
The loss of soil by erosion can present an environmental challenge with potentially grave social and economic con-sequences, including decreased agricultural productivity (Pi-mentel et al., 1995; Montgomery, 2007), damage to hy-dropower infrastructure and reduction of reservoir life spans (e.g., Harden, 1993), and increased flooding hazards (e.g., Costa, 1975). In steep mountain environments, deforestation and agricultural intensification have been linked to increased soil loss (Eckholm, 1975; Hewawasam et al., 2003; Rapp, 1975; Swanson and Dyrness, 1975) and associated “environ-mental degradation” (Ives and Messerli, 1989). Unsustain-able soil loss potentially puts at risk rural mountain commu-nities that rely on the economy of local agriculture and that are highly susceptible to sediment-related hazards in down-stream environments (Brown, 1981). Restoration of dense vegetation has been shown to remediate erosional losses (Vanacker et al., 2007), but population pressure and intense competition for land use means that permanent re-vegetation is not always possible or sustainable for rural communities. Techniques such as terracing and low-till agriculture can mit-igate erosional losses (Chow et al., 1999; van Dijk and Brui-jnzeel, 2003; Gardner and Gerrard, 2003; Inbar and Ller-ena, 2000; Montgomery, 2007; Morgan, 2005), but signif-icant questions remain about the extent to which specific agricultural practices prevent or exacerbate erosion and land degradation (Bai et al., 2008). Answering these questions is critical to optimizing the strategy for preventing unsustain-able soil loss in mountain regions.
One major challenge lies in assembling robust data on how erosion rates change under mountain agriculture. In particu-lar, it not always straightforward to define baseline “natu-ral” rates of erosion for comparison to the present-day rates that are influenced by agricultural land uses. The simple observation of rapid erosion from hillslopes and high sed-iment fluxes in rivers does not distinguish agricultural ef-fects, because background rates of landscape denudation are high in mountain environments. Plot studies are frequently used to compare soil loss under different land uses (e.g., Boix-Fayos et al., 2006; Gardner and Gerrard, 2003; Hud-son, 1993; Merz, 2004; Morgan, 2005; Mutchler et al., 1970). Plots provide valuable information but face methodological challenges (e.g., Boardman, 2006; Bruijnzeel and Critchley, 1996; Toy et al., 2002) and are inherently small in scale and site-specific. Other studies have compared catchments with different land use make-up, but natural spatial heterogeneity can make it difficult to find appropriate catchments that ef-fectively isolate variables such as agricultural activity (e.g., Heimsath, 1993).
One additional source of information may come from comparing subannual to decadal sediment fluxes with erosion rates integrated over longer periods of time (Hewawasam et al., 2003; Vanacker et al., 2007, 2014; Reusser et al., 2015). The concentration of the cosmogenic
nuclide 10Be in quartz separated from river sands (here-after “10Beqtz”) can be used to infer long-term denudation rates, typically integrated over ∼ 1000+ year timescales (von Blanckenburg, 2006; Brown et al., 1995; Granger et al., 1996). Land use can change10Beqtzitself, but such effects are often relatively small (see further discussion below, and Appendix A3). Thus in many cases this method effectively captures “natural background” rates not strongly affected by agricultural activity. Insights into catchment-scale effects of land use may then emerge by comparing10Beqtz-derived ero-sion rates with sediment fluxes measured over more recent agricultural times (e.g., 1–10+ years). Specifically, present-day sediment fluxes may be increased relative to long-term erosion rates as a result of active soil loss from agricultural areas, or they may be reduced if historical agriculture has led to pervasive depletion of fine soil material. Hewawasam et al. (2003) and Vanacker et al. (2007) used such compar-isons to show that deforestation has dramatically increased erosion rates in the highlands of Sri Lanka (presently dom-inated by tea plantations) and the Andes of Ecuador (dom-inated by mixed cropland and pasture). Similarly, Reusser et al. (2015) found that upland erosion rates increased dur-ing intensive land use in the Appalachian piedmont of the southeastern United States. Restoring vegetation cover in Ecuador returned catchment erosion rates to background val-ues (Vanacker et al., 2007), as did soil conservation prac-tices in the United States (Reusser et al., 2015). Vanacker et al. (2014) noted that even degraded lands in the Spanish Baetic Cordillera show little difference between short- and long-term rates, perhaps because natural vegetation was not a major erosional inhibitor in this region even before agricul-ture. They hypothesized that the extent of deviation from nat-ural vegetation cover exerts a first-order control on the mag-nitude of anthropogenic acceleration of erosion.
Additional comparative studies such as these promise to add information about how land degradation depends on the setting and the type of agricultural activity in mountain environments. In this study, we focus on the Middle Hills of the Nepal Himalaya, where there is a rich literature on soil erosion (e.g., Gardner and Jenkins, 1995; Shrestha et al., 1997; Blaikie and Sadeque, 2000; Merz, 2004; amongst many others) and where the concept of dwindling Himalayan soil resources and the associated theory of Himalayan envi-ronmental degradation (Eckholm, 1975; Ives and Messerli, 1989) have been widely discussed (e.g., Asia Development Bank and ICIMOD, 2006; Sitaula et al., 2005). High rates of soil loss have been frequently observed in association with degraded lands in the Middle Hills region (e.g., Burton et al., 1989; Gardner and Jenkins, 1995; Merz, 2004). Mean-while, plot-erosion investigations have suggested that tradi-tional terracing practices are associated with relatively low rates of soil loss (Gardner and Gerrard, 2003; Smadja, 1992; Tiwari et al., 2009), indicating that terraces can be effective at mitigating erosion. However, such plot-scale studies may not capture losses from terrace risers (Bruijnzeel and Critchley,
1996; Toy et al., 2002), and it is unclear how the plot study results relate to degradation at the wider landscape scale in the Middle Hills (Hamilton, 1987).
The extensive previous work in Nepal studying rates of agricultural soil loss has been complemented by no less ex-haustive efforts investigating erosion and denudation rates across large-scale climatic and tectonic gradients in the cen-tral Himalaya (e.g., Wobus et al., 2005; Gabet et al., 2008; Lupker et al., 2012; Andermann et al., 2012; Godard et al., 2014; see Fig. 1). The data sets resulting from this work show that long-term (millennial and longer timescale) erosion rates are highly spatially variable and controlled to first order by tectonic activity, with higher erosion rates north of the thrust faults that demarcate the transition from the Middle Hills to High Himalayan topography (Wobus et al., 2005; Godard et al., 2014). A comparison of short- and long-term ero-sion rates thus needs to consider spatial differences between catchments together with any temporal evolution due to land use change. There are some sites in Nepal where short- and long-term erosion rates have both been measured in the same catchment, specifically the High Himalayan Khudi Khola (Gabet et al., 2008; Gallo and Lavé, 2014; Godard et al., 2012; Niemi et al., 2005; Puchol et al., 2014) and some of the large river basins (Andermann et al., 2012; Lupker et al., 2012). Data from these catchments are discussed in detail in Sect. 5, but existing sites where long-term erosion rates have been measured previously do not overlap with the lo-cations where erosion has been studied in detail in agricul-tural systems in the Middle Hills. As a consequence, despite the wealth of prior research on erosion in Nepal, detailed comparisons of erosion rates over relatively short and long timescales have thus far not been widely explored in the agri-cultural context in this region.
To shed additional light on the problem of soil degradation associated with agriculture in the Himalaya, here we present new cosmogenic10Beqtzdata from well-studied agricultural catchments in the Nepal Middle Hills, and we compare these data with previously determined sediment yields, soil loss rates from plots, and first-order estimates of mass wasting fluxes. By comparing two catchments with varying extents of agricultural land use, and by setting our results in the con-text of other10Beqtzand sediment flux data from Nepal, we attempt to gain additional insight into the extent of agricul-tural reworking of the Himalayan landscape.
2 Study site
The focus of this study is on the Likhu Khola Valley, an east–west-trending river valley in central Nepal that lies im-mediately north of the Kathmandu Valley (at approximately 27◦500N, 85◦200E; Fig. 2). The proximity of the Likhu Val-ley to the city of Kathmandu (∼ 50–60 km distance) has led to intense population pressure on this rural environment. The Likhu Khola itself is a tributary of the Trisuli River, which
flows via the Narayani River to the Ganges. The elevation of the Likhu drainage basin ranges from 530 to 2720 m. The bedrock is composed of Kathmandu Complex gneisses and schists, overlain by a deep weathered zone (several meters’ depth) and loamy soils up to 2–3 m thickness, with typical A horizons 10–40 cm thick and B horizons 10–220 cm thick (Shrestha, 1997). Slopes in the Likhu are steep, at 10–45◦ (mean slopes for the Likhu and its subcatchments are shown in Table 1). The Likhu Fault, a geologic structure associ-ated with but distinct from the Main Central Thrust (MCT), is thought to run with an east–west strike through the bot-tom of the valley (Fig. 2). Annual rainfall is approximately 2500 mm, as measured at the Kakani meteorology station on the ridge that defines the southern watershed boundary of the Likhu; rainfall shows complex spatial variability across the catchment (Gardner and Jenkins, 1995), as is often the case in mountain environments.
Natural land cover in the Likhu catchment is predomi-nantly subtropical and tropical hardwoods at lower elevations and mixed broadleaf forest at higher elevations, with some mixed pine forest of Pinus roxburghii (Gardner and Gerrard, 2002; Shrestha et al., 2007). Agricultural practices in the Nepal Middle Hills include rainfed bari terraces and irrigated khet terraces. Bari terraces typically have sloping surfaces and are used primarily for maize production. Bari terraces in the Likhu are gently sloping (∼ 5◦, usually sloping outwards and/or sideways), and about 2–10 m wide, with typical riser heights up to a few meters (see details in Gardner and Ger-rard, 2003). Riser angles are typically > 60◦, though angles on slumped risers are lower. Crops on typical bari terraces in Nepal depend on monsoon rainfall and are usually cycled between maize (Zea mays L.), sometimes interplanted with legumes (grown May–August), and millet (Eleusine
cora-cana L., grown August–December). Khet terraces are often
built with bunds (raised edges designed as barriers to runoff) and flooded. Khet terraces are typically used to grow irri-gated paddy rice (Oryza sativa L.), sometimes followed by wheat (Triticum aestivum L.) or other winter crops (Shrestha et al., 2006). Wooden plows and hand hoes are used on both bari and khet lands; fertilizers include both farmyard ma-nure and chemical fertilizer. Some of the forested lands are “degraded” due to grazing and partial deforestation, particu-larly harvesting of sal (Shorea robusta) wood, and some of the land formerly in cultivation has been abandoned and is now degraded shrubland. Other forested lands, particularly on steep slopes, have remained relatively pristine (Gardner and Gerrard, 2002; Shrestha et al., 2007).
In this study, we focus specifically on the Bore Khola (Fig. 3; Table 1), a subcatchment of the Likhu Khola with to-tal catchment area 4.8 km2, spanning elevations from ∼670 to 2200m. Of the catchment area, ∼ 50 % was forested and
∼40 % was terraced (30 % khet and 10 % bari) when sedi-ment fluxes were measured in the early 1990s (see below). The main Bore Khola has two headwaters: the upstream Bore (catchment area 2.0 km2), and the Chinnya Khola (area
Figure 1.Map of Nepal showing erosion rate data collected in previous studies. Grayscale background shows elevation from SRTM digital elevation map at ∼ 90 m resolution. Data points are color-coded by erosion rate. (a) Sediment fluxes from Chalise and Khamal (1997) and Andermann et al. (2012), with overlain symbols representing sites with data from both studies. (b) Denudation rates determined from
10Be
qtzfrom Godard et al. (2012), Godard et al. (2014), Lupker et al. (2012), and Wobus et al. (2005). White circles are expanded to show
data collected from multiple times or grain sizes by Lupker et al. (2012). (c) Magnified scale of central Nepal region showing data from (a) and (b) along with location of several previous studies of agricultural soil erosion identified from published literature: (1) Likhu Khola (Gardner and Jenkins, 1995; location of this study), (2) Kulekhani (Upadhaya et al., 1991), (3) Pokhare Khola (Tiwari et al., 2008), and (4) Jhiku Khola and Kavre catchments (e.g., Merz, 2004).
Figure 2.Map of central Nepal north of the Kathmandu Valley (a) and close-up map of the Likhu Khola (b), showing sampling sites for river sediment and corresponding10Beqtz-derived long-term denudation rates (see text). MCT: Main Central Thrust.
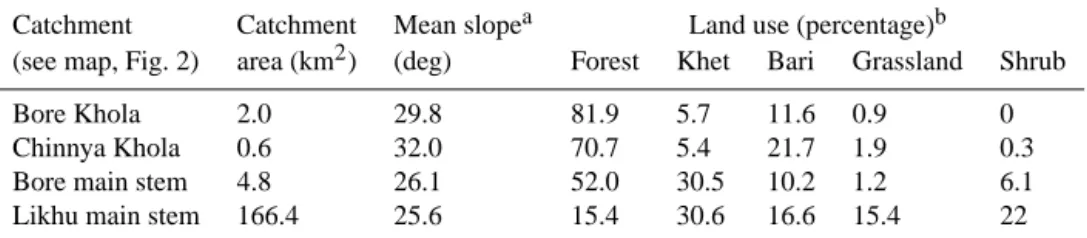
Table 1.Characteristics of the study catchments in the Likhu Khola.
Catchment Catchment Mean slopea Land use (percentage)b
(see map, Fig. 2) area (km2) (deg) Forest Khet Bari Grassland Shrub
Bore Khola 2.0 29.8 81.9 5.7 11.6 0.9 0
Chinnya Khola 0.6 32.0 70.7 5.4 21.7 1.9 0.3
Bore main stem 4.8 26.1 52.0 30.5 10.2 1.2 6.1
Likhu main stem 166.4 25.6 15.4 30.6 16.6 15.4 22
aMean slope calculated from 30 m DEM.
bLand use percentages from Gardner and Jenkins, 1995, and maps therein. Khet: irrigated terraces; bari: rainfed terraces.
N 500 m N Khet Bari Grassland Forest Shrub 85˚18'00" 85˚19'12" 27˚49'12" 27˚50'24" 0 0.5 km 1000 2000 elevation (meters) (a) (b)
Bore Khola 10Be sample
Chinnya Khola 10Be sample
Bore mainstem sediment flux site Land Use Type
1500 2500
Figure 3.Detailed maps of elevation (a) and land use (b) of the Bore Khola subcatchment of the Likhu Khola. The Bore Khole includes the Bore and Chinnya headwater catchments that were sampled for determining long-term denudation rates from10Beqtz.
Note that these low-order, headwater catchments are predominantly forested with little agricultural land use, so they are expected to provide a robust background erosion rate. Land use map is adapted from Gerrard and Gardner (1999), with unknown projection that does not exactly match panel (a). Bari are rainfed terraces; khet are irrigated terraces (see text).
0.6 km2), both of which are predominantly forested (> 70– 80 %; Table 1). For comparison, we also consider the larger Likhu Khola Basin (catchment area 166.4 km2) just upstream of its confluence with the Trisuli (shown in Fig. 2). Across this larger Likhu Basin, the predominant land use during the study period was khet terraces (30.6 % total catchment area), with some bari (16.6 % area) and grassland (15.4 %). The re-mainder of land was forest (15.4 %) and scrubland (Table 1).
3 Methods
3.1 Short-term erosion rates
Data on short-term (annual to decadal) erosion rates were assembled from previously published measurements of soil loss from plots (Gardner and Gerrard, 2001, 2002, 2003), quantification of sediment transported by streams (Brasing-ton and Richards, 2000), and mapping of the distribution and volumes of landslides, slumps, and debris flows over multiple years (Gerrard and Gardner, 1999, 2000, 2002). The methods used in these previously published studies are summarized briefly here.
Plot studies of soil loss were conducted in 1992 and 1993 using existing agricultural ditches at the base of terrace risers to channel runoff and sediment into collection drums. Mul-tiple terrace plots were selected and studied in order to cap-ture a representative range of agricultural practices. Runoff and suspended sediment were determined after storms from material in the collection drums (Gardner and Gerrard, 2001, 2002, 2003).
Stream sediment transport was measured by installing gauging stations with pressure transducers monitoring stream stage height. Sediment concentrations were deter-mined from depth-integrated sampling at regular (biweekly) intervals supplemented by storm event sampling, and by tur-bidity loggers. Fluxes for 1992 were determined from rating curves (Brasington and Richards, 2000).
Mass wasting fluxes were measured during 1991, 1992, and 1993 by identifying, mapping, and measuring all slope failures over this time period (Gerrard and Gardner, 1999, 2000, 2002). Most failures were either slumps or debris slides. Dimensions of failures were mapped in the field and used to calculate volumes lost by mass wasting each year. Connectivity of failures to the stream system was used to determine a sediment delivery ratio to streams of 50 % on average over the three years studied (Gerrard and Gardner, 2000).
3.2 Measurement of10Beqtz
Rates of natural background erosion were calculated from the concentration of in situ-produced10Be in quartz (10Beqtz)
separated from stream sediments. Sediment samples (∼ 5 kg each) were collected from material in active transport in the streambed of the headwater Bore Khola and Chinnya Khola catchments, and of the higher-order Likhu Khola main stem (Figs. 2, 3). Samples were returned to the UK and sieved to size fractions < 0.25 mm, 0.25–0.71 mm, 0.71–2.0 mm, and 2.0–4.0 mm. Quartz grains in the < 0.25 mm fraction are too small to determine the concentrations of10Be in quartz. The other three size fractions were analyzed separately for the Bore and Chinnya samples. There was little coarse-grained material in the Likhu main stem sample, so only the 0.25– 0.71 mm fraction was processed. Sample processing and 10Be analysis was completed at the Cosmogenic Nuclides National Laboratory (LN2C) and the French national AMS facility ASTER at CEREGE (Aix-en-Provence, France). Samples were leached in HF to separate quartz and to remove meteoric contamination (Kohl and Nishiizumi, 1992). AMS analyses were calibrated against NIST SRM 4325 based on a10Be /9Be ratio of (2.79 ± 0.03) × 10−11 and a10Be half-life of (1.36 ± 0.07) × 106 years (Nishiizumi et al., 2007). Blanks run together with the samples had 10Be /9Be values of 1.447 × 10⁻¹⁵ and 2.624 × 10⁻¹⁵, compared to samples ranging from 1.476 × 10⁻¹⁴to 5.286 × 10−14.10Be concen-trations in each sample were calculated from measured ratios and are reported in Table 2.
3.3 Inferring long-term denudation rates from10Beqtz
The widely used approach to determining denudation rates from 10Beqtz (e.g., von Blanckenburg, 2006; Dunai, 2010; Granger and Riebe, 2007; Granger et al., 2013) assumes that erosion occurs at steady state from the Earth’s surface, such that (see the Appendix A1 for more details)
Csed= X i Pi(0) λ + ρε/3i , (1)
where Csedis the measured10Be concentration in river sedi-ment quartz, i denotes each cosmogenic production pathway of 10Be, Pi(0) is the production via pathway i at the sur-face (i.e., where depth z = 0), λ is the10Be decay constant,
ρ is the density of eroding rock (we use ρ = 2.6 g cm−3),
ε is the steady-state denudation rate, and 3i is the attenua-tion length associated with producattenua-tion pathway i. We use two terms in Eq. (1) – one term for production by neutron spal-lation and another for muonic production. For neutrons, we use 3n=160 g cm−2(a widely adopted value; cf. Goethals et al., 2009) and Pn(0) calculated for the mean latitude, lon-gitude, and elevation of each catchment based on scaling of a sea level high-latitude spallation production rate of 4.49 at g−1yr−1(Stone, 2000; using code of Balco et al., 2008). For muons, we use 3m=4200 g cm−2 (the median value from the compilation of Braucher et al., 2013) and Pm(0) cal-culated for the mean elevation of each catchment based on scaling of a sea level high-latitude muonic production rate of 0.028 at g−1yr−1(Braucher et al., 2011, 2013).
Characteristic surface production rates for each catchment were determined for the elevation and latitude of each pixel in a 30 m catchment DEM, with neutron production rates at each pixel corrected for topographic shielding based on a skyline estimation (using an adapted version of the code from http://depts.washington.edu/cosmolab/shielding.m). Median corrected production rates and median shielding values are reported for each catchment in Table 3. The corrected pro-duction rates calculated by this method are similar to those for the mean catchment elevation and latitude (cf. von Blanckenburg, 2006).
Steady-state denudation rate is found by inverting Eq. (1) for ε (see Table 3 for the Likhu sample results). Uncertainties in erosion are reported 16th and 84th percentiles (i.e., 68 % confidence interval) of the Monte Carlo distributions derived from repeating the inversion taking into account 1σ measure-ment error on Csed(Table 1), uncertainties of 10 g cm−2and 500 g cm−2on 3
n and 3mrespectively, and the 68 % con-fidence interval of the distribution of calculated Pm(0) and
Pn(0) within each catchment. This Monte Carlo approach al-lows for estimating what are found to be non-normal, asym-metric uncertainties on ε.
3.4 Additional data
Additional data from other catchments in Nepal were assem-bled from the literature to provide wider context for the mea-surements from the Likhu Khola reported here. In all cases, calculated denudation rates (in mm yr−1average surface low-ering, as reported in the data tables in this study) were con-verted to erosional fluxes (in t km−2yr−1) for comparison to sediment yields. Mass conversion was done based on den-sity of 2.6 g cm−3, because rock density controls the amount of sediment production over depths measured by10Beqtz de-nudation rates. The dede-nudation rates and fluxes calculated from10Beqtz reflect long-term losses via both physical ero-sion and chemical weathering, as discussed in greater detail below.
4 Erosion rates
4.1 Long-term background rates from the Likhu Khola
Background denudation rates (Table 3) inferred from10Beqtz using Eq. (1) range from 702 + 156/ − 130 to 1066 + 364/ − 234 mm yr−1 (median ± 68 % confidence interval from Monte Carlo error propagation) in the headwater Bore and Chinnya catchments, which are only minimally affected by agricultural land use. At these erosion rates,10Beqtz in-tegrates over timescales of ∼ 1600–2500 years. The inferred erosion rates are identical for all size fractions of the river sediment from the Chinnya catchment. In the Bore catch-ment, rates in the 0.25–0.71 mm and 0.71–2 mm size frac-tions of river sediment were identical, while best estimate rates in the 2–4 mm fraction were 50 % higher but not
quan-Table 2.10Beqtzin river sediment from the Likhu Khola Basin in the Nepal Middle Hills.
Sample Name Date Sample Sample Mean Grain size 10Beqtz
collected lat/long elevation catchment (mm) (103at g−1±1σ )
(m) elevation* (m)
CT71 Likhu Khola 9 May 2002 27.8975◦N, 533 1366 0.25–0.71 13.51 ± 3.13
85.2212◦E
CT84 Chinnya Khola 16 May 2002 27.8413◦N, 960 1308 0.25–0.71 22.85 ± 2.79
85.3072◦E 0.71–2 22.33 ± 1.91
2–4 21.87 ± 5.40
CT85 Bore Khola 16 May 2002 27.8411◦N, 962 1646 0.25–0.71 29.73 ± 2.51
85.3076◦E 0.71–2 29.10 ± 3.80
2–4 19.60 ± 3.56
∗Mean elevation calculated from 30 m DEM, with catchment areas delineated using a flow-routing algorithm in Grass GIS.
Table 3.Cosmogenic production rates and inferred denudation rates for Likhu Khola samples.
Sample Catchment Grain Topo. Pn(0)b Pm(0)c Steady-state denudation Equivalent erosion Averaging Inferred soil size shieldinga (at g−1 (at g−1 rated(mm yr−1) fluxe(t km−2yr−1) timescale production ratef
(mm) yr−1) yr−1) (yr) (mm yr−1) CT71 Likhu Khola 0.25–0.71 0.973 9.37 0.052 0.49 + 0.23/ − 0.18 1274 + 598/ − 468 1430 ∼0.35 CT84 Chinnya 0.25–0.71 0.943 8.83 0.051 0.27 + 0.06/ − 0.05 702 + 156/ − 130 2570 ∼0.27 Khola 0.71–2 0.28 + 0.05/ − 0.05 728 + 130/ − 130 2520 2–4 0.28 + 0.11/ − 0.06 728 + 286/ − 156 2460 CT85 Bore Khola 0.25–0.71 0.959 11.87 0.060 0.27 + 0.06/ − 0.06 728 + 156/ − 156 2510 ∼0.26 0.71–2 0.28 + 0.07/ − 0.06 728 + 182/ − 156 2460 2–4 0.41 + 0.14/ − 0.09 1066 + 364/ − 234 1660
aCorrection ratio for topographic shielding of10Beproduction, used in determiningPn(0).
bCatchment-average10Beproduction rate in quartz atz =0by neutron spallation (calculated based on Balco et al., 2008). cCatchment-average10Beproduction rate in quartz atz =0by muons (calculated based on Braucher et al., 2013).
dDenudation rate from Eq. (1) for steady state; errors reflect 16th and 84th percentiles of Monte Carlo distributions (n =10 000). Bold values are medians of the distributions, and are equivalent to direct
solution of Eq. (1) for best estimates of parameter values.
eCalculated for density of eroding rock of 2.6 g cm−3.
fUncertainties not reported on soil production rates because they were not estimated for landslide fluxes.
titatively distinguishable within analytical error. There is no statistically significant difference between rates in the Bore and Chinnya. Calculated steady-state denudation rates at the Likhu main stem site were 1274 + 598/ − 468 t km−2yr−1, higher than in either of the smaller subcatchments for the equivalent grain size range (0.25–0.71 mm) of river sedi-ment.
4.2 Anthropogenically perturbed rates from the Likhu
Khola
Suspended sediment yields in the Bore Khola, measured at the outlet of the larger catchment that comprises both the Bore and Chinnya headwaters and includes significant (∼ 40 %) agricultural area (Fig. 2; Table 1), totaled 341– 1527 t km−2 during the monsoon season of 1992 (Table 4; from Brasington and Richards, 2000). The wide range in these estimates is attributable to the different methods of cal-ibrating the field measurements (Brasington and Richards,
2000). This range provides a reasonable estimate of the to-tal annual sediment yield, since over 90 % of rainfall and the majority of sediment removal takes place during the mon-soon season (Gerrard and Gardner, 1999). However, mea-sured suspended sediment fluxes in this system are probably sensitive to the runoff in any given year of observation (Bras-ington and Richards, 2000).
Plot studies from bari terraces yielded soil loss rates from 270 to 1290 t km−2 during the monsoon seasons in 1992 and 1993 (Gardner and Gerrard, 2003), with a median and 68 % confidence interval of 460 + 469/ − 138 t km−2 (n = 14). Soil loss rates on grassland and natural forest were lower, ∼ 50 t km−2, but rates on degraded forest were sub-stantially higher, ∼ 1000–2000 t km−2(Gardner and Gerrard, 2001, 2002).
Gerrard and Gardner (1999, 2002) estimated an av-erage denudation rate from mass wasting equivalent to 406 t km−2yr−1for the Likhu Basin as a whole (note their 1999 paper reports rates in mm yr−1 that are 10 times too
high due to a conversion error, but this is corrected in the 2002 paper). They measured lower rates (∼ 57 t km−2yr−1) for the Bore subcatchment and suggested that this lower value is more representative of the southern slopes of the Likhu, based on aerial images (Gerrard and Gardner, 1999).
4.3 Comparative data from Middle Hills region of Nepal
Other than our study in the Likhu, we are not aware of any other data pairing short-term (annual to decadal) erosion rates with10Beqtz-derived long-term denudation rates where both data have been collected at the same site in the agricul-tural Himalayan Middle Hills. However, there are additional erosion rate data from a variety of other sites in Nepal (see Fig. 1 and discussion below).
Previously reported10Beqtz-derived denudation rates from other small catchments in Nepal are equivalent to erosion fluxes ranging from 260 ± 26 to 4706 ± 1274 t km−2yr−1 (Godard et al., 2014; Wobus et al., 2005; see Supplement Ta-ble S1). The large range in observed rates has been attributed to variable tectonic position, with significantly higher de-nudation rates in the more rapidly uplifting High Himalaya (Godard et al., 2014; Wobus et al., 2005). Data that are com-parative to the region of the Likhu Khola are those restricted to catchments south of the MCT, and south of the physio-graphic and denudational transition that may demarcate blind thrusting (Wobus et al., 2005). The data from these catch-ments (n = 20, catchment area = 4 − 110 km2) yield a me-dian denudation rate of 494 + 565/ − 182 t km−2yr−1(68 % confidence interval). This value is similar to the 10Beqtz -derived denudation rates we have measured in the Bore and Chinnya. These rates from Nepal are also similar to those observed in the lower-elevation regions of the Garwhal Hi-malaya in India (Scherler et al., 2014). The rates we measure for the Likhu main stem are notably higher, and approach rates found in the High Himalaya. The values discussed here are all previously published denudation rates, and are not re-processed with the same method as used in this study for cal-culating denudation rate from10Be concentrations. Compari-son of10Beqtz-derived rates between different studies should be interpreted in the context that reported rates were not all calculated with the same10Beqtzproduction scheme.
Additional data on short-term soil loss from agricultural lands in Nepal provide widely varying erosion rates, with plot study data ranging from < 10 to > 10000 t km−2yr−1 (as compiled by Chalise and Khanal, 1997; Jha and Paudel, 2010). This variability may partly reflect different land use practices at the different sites that have been studied. Such variation is consistent with observations in the Likhu Khola of varying plot-level soil loss, depending on the type of land use.
The data most immediately comparable to the river sedi-ment10Beqtzdenudation rates are river sediment fluxes that integrate across multiple land use types. Many of the rivers monitored for suspended sediment in Nepal have very large
catchment areas that drain significant High Himalayan re-gions (e.g., data in Andermann et al., 2012), while others drain significant portions of the lowland Terai floodplain. Since these different physiographic regimes may be charac-terized by considerably different background erosion rates (Wobus et al., 2005; Godard et al., 2014; see Fig. 1), the sediment yields from the large river basins do not provide a robust comparison to the long-term rates determined specifi-cally for the Middle Hills, as in this study. Considering only sediment yields from rivers with catchment areas restricted to the Middle Hills, suspended sediment fluxes range from 173.5 to 3700 t km−2yr−1(as reported by Andermann et al., 2012; Bajracharya et al., 2004; Chalise and Khanal, 1997; see Table S2). The distribution of rates is positively skewed, with a median value (± 68 % confidence interval; n = 8) of 892 + 1074/ − 458 t km−2yr−1. This value should be inter-preted with caution since sediment yields calculated by An-dermann et al. (2012) in some cases yield significantly dif-ferent values compared to the estimates from Chalise and Khanal (1997), for example lower by 2 times or more at some gauging stations (Table S2; Fig. S1 in the Supple-ment). Important methodological details such as the length of record and the number of measurements were not reported by Chalise and Khanal (1997), so it is difficult to identify rea-sons for these differences, and the Andermann et al. (2012) data set does not include enough basins that drain exclusively the Middle Hills to allow an independent estimate.
4.4 Comparative data from other Himalayan regions
In addition to the variety of data from Middle Hills locations discussed above, data sets from large Himalayan rivers and from the Khudi Khola catchment, which has a predominantly High Himalayan catchment area and more limited agricul-tural activity, allow direct comparison of sediment fluxes and 10Be
qtz-derived denudation rates more widely across Nepal. These comparisons are discussed in Sect. 5.3, below.
5 Discussion
5.1 Spatial variability in erosion rates in the Likhu Khola
Rates of long-term erosion inferred from10Beqtzare similar across different grain sizes for the Bore and Chinnya, both of which are on the southern slopes of the Likhu Valley. In contrast, the10Beqtz-derived erosion rate for the Likhu main stem is significantly higher. In previous work, mass wasting losses were also found to be higher in the Likhu Valley as a whole, when compared to the Bore, and rates were particu-larly identified as being higher on the northern slopes of the Likhu Valley (Gerrard and Gardner, 1999, 2002). Based on 1992–1993 precipitation measurements at rain gauges dis-tributed throughout the Likhu Khola, there is no evidence for systematically greater rainfall on the northern slopes (Gard-ner and Jenkins, 1995). There are multiple possible other
ex-planations for differences in denudation rate between south-ern and northsouth-ern slopes of the Likhu:
1. Differences in 10Beqtz-derived erosion rates might re-sult from artifacts due to reworking of cosmogenically shielded alluvial by the Likhu main stem (cf. Wittman and von Blanckenburg, 2009), or from the stochastic supply of sediment with variable 10Be concentrations to this site, for example due to supply from different tributaries (cf. Lupker et al., 2012) or from mass wast-ing sources (cf. Niemi et al., 2005; West et al., 2014; Puchol et al., 2014). These explanations would not, on their own, also explain differences in mass wasting rates between northern and southern slopes.
2. The different rates of mass wasting might be attributable to differences in land use effects, with more land degra-dation on northern slopes. This idea was suggested by Gerrard and Gardner (1999, 2002) and is evident in the soil erosion modeling analysis of Shrestha et al. (2004). If land degradation is hastening mass wasting on north-ern slopes, it might contribute to the lower10Beqtzin the Likhu main stem, explaining both sets of observations. 3. Alternatively, the observed difference may be related
to the presence of the Likhu Fault that runs east–west through the middle of the valley (Fig. 1). If this fault ac-commodates deformation, for example associated with the Main Central Thrust (MCT), then higher tectoni-cally driven denudation rates might be expected on the northern slopes (cf. Godard et al., 2014; Wobus et al., 2005). This might be expected to increase both the ob-served mass wasting rates and the inferred long-term de-nudation rates. The10Beqtzdenudation rates in the Bore and Chinnya are similar to other denudation rates in the Middle Hills of Nepal, while the rates for the Likhu Khola as a whole approach the higher rates observed in association with more rapid tectonic uplift in the Nepal High Himalaya (Godard et al., 2014; Wobus et al., 2005). The northern slopes of the Likhu do not have obviously different relief structure (e.g., river channel steepness), as might be expected for a different uplift and erosion regime (Godard et al., 2014; Scherler et al., 2014). However, nonlinearity in such relationships mean that differences in topographic parameters asso-ciated with the ∼ 2-fold difference in denudation rate might not be easy to identify across the Likhu.
5.2 Short-term versus long-term erosion rates in the
Likhu Khola
5.2.1 Comparative rates
To first order, the10Beqtz-derived, natural background ero-sion rates measured for the headwater Bore and Chinnya are similar to present-day sediment fluxes, lying in the middle of
the range of river suspended sediment flux estimates for the Bore main stem (Table 4, Fig. 4a). The long-term denuda-tion rates are also indistinguishable from the soil loss rates from plots on well-maintained bari terraces. In contrast, soil loss rates from degraded lands are higher (Table 4). Terrac-ing is intended to reduce soil erosion (cf. Gardner and Ger-rard, 2003; Smadja, 1992; Tiwari et al., 2009), so a lower rate of sediment losses from terraces is expected. Rapid soil loss from degraded lands has also been widely observed (e.g., Burton et al., 1989; Gardner and Jenkins, 1995; Merz, 2004); the comparison presented here confirms that this an-thropogenically associated loss exceeds the rate of long-term background erosion in the Likhu.
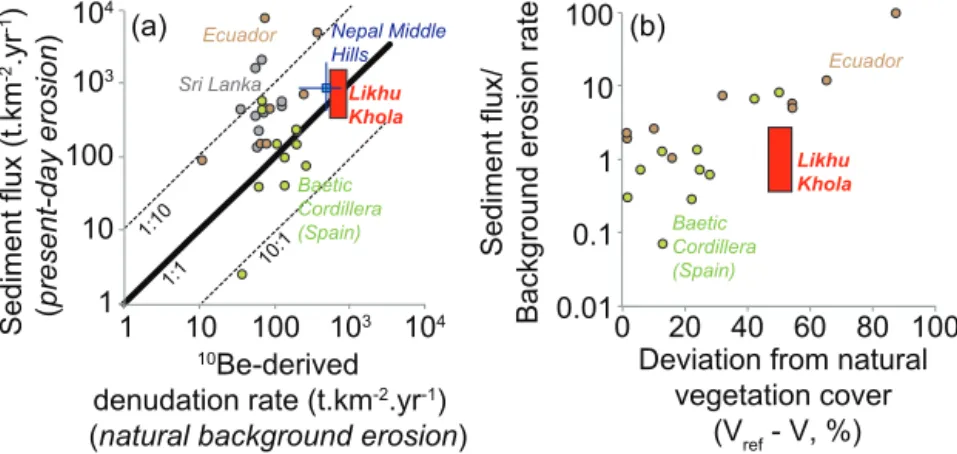
The similarity of long-term and present-day erosion rates that we observe in the agricultural Likhu Khola contrasts with the significantly higher present-day versus long-term fluxes measured in agricultural catchments in Sri Lanka and Ecuador (Fig. 4a). Even the difference between the long-term erosion rates in the Likhu and the soil loss rates on de-graded lands (∼ 3-fold increase) is lower than the > 10-fold erosional flux increase observed in some of the Sri Lanka and Ecuador catchments when comparing short- and long-term rates. Vanacker et al. (2014) observed little difference between short- and long-term erosion rates in agricultural catchments of the Baetic Cordillera of Spain and suggested that the difference between present-day vegetation cover (V ) and natural vegetation cover (Vref) exerts a primary control on the extent of agricultural enhancement of erosion. Com-pared to the data from Spain and Ecuador, the data from the Likhu Khola point to relatively lower agricultural en-hancement of erosion for a given change in vegetation cover (Fig. 4b).
Land use is not the only factor that may differ between ero-sion rates derived from10Beqtz and those determined from other measurements such as sediment fluxes. Erosion rates often vary as a function of spatial scale (Covault et al., 2013; de Vente et al., 2007; Milliman and Syvitski, 1992; Saun-ders and Young, 1983; Bierman and Nichols, 2004), po-tentially complicating comparison of plot-level soil losses with catchment-wide denudation rates. The 10Beqtz-based denudation rates and river suspended sediment fluxes for the Bore are at comparable scale, but the results from terrace plots are not. Other relevant factors include (i) differences between measuring suspended sediment fluxes compared to total denudation rate; (ii) whether sediment fluxes over ob-served timescales are representative; and (iii) whether there are biases in the10Beqtz-based denudation rates, potentially resulting from non-steady-state effects. These issues are dis-cussed in turn in the following subsections.
5.2.2 Dissolved and bedload contributions to total
denudation
Suspended sediment flux measurements do not include ei-ther dissolved mass losses or particulate transport in bedload,
Sediment flux ( t.km -2.yr -1) (present-day erosion ) 10Be-derived
denudation rate (t.km-2.yr-1)
(natural background erosion) 1 10 100 103 104 1 10 100 103 104 Sri Lanka Nepal Middle Hills Likhu Khola Ecuador 1:1 10:1 1:10 Baetic Cordillera (Spain) 0.01 0.1 1 10 100 0 20 40 60 80 100 Deviation from natural
vegetation cover
(Vref - V, %)
Sediment flux/
Background erosion rate
Likhu Khola Ecuador Baetic Cordillera (Spain) (b) (a)
Figure 4.(a) Comparison of short-term erosion rates from sediment fluxes and long-term denudation rates from10Be concentrations in quartz from river sediment, from mountain catchments in different settings all with significant agricultural land use. The red box shows range of10Beqtz-derived rates for Bore Khola determined in this study, compared to sediment fluxes from the Bore in 1992 (Brasington and
Richards, 2001). The light-blue point shows the median ± 68 % confidence interval of the data set on10Beqtzdenudation rate and sediment
flux from other catchments in the Nepal Middle Hills (note that these data are not from paired catchments and that the sediment fluxes are highly uncertain; see text and Tables S1, S2). The Nepal data indicate little increase in present-day sediment fluxes above background denudation rates, in contrast to the large increases in present-day rates observed in many catchments in Sri Lanka (gray points; Hewawasam et al., 2004) and Ecuador (brown points; Vanackar et al., 2007), but similar to many agricultural catchments in the Baetic Cordillera of Spain. (b) Comparison of the present-day enhancement of erosion rate to the extent of anthropogenic disturbance of native vegetation. The data from the Likhu Khola indicate less enhancement of erosion for a given change in vegetation cover compared to catchments in Spain and Ecuador.
both of which are part of the total denudation flux captured by10Beqtz. In the Bore and Chinnya, dissolved fluxes are low relative to the total denudation (dissolved fluxes are less than
∼5–10 % of the total denudation flux; West et al., 2002), so this flux is not expected to be a major factor in our analy-sis. Bedload transport may comprise a significant portion of the total denudation flux in mountain systems. Measurements in the High Himalaya of the Marsyandi River basin suggest bedload may account for as much as ∼ 35 % of the total de-nudation flux (Pratt-Sitaula et al., 2007), such that total an-nual to decadal erosion rates may be ∼ 50 % higher than sus-pended sediment fluxes. If the sediment fluxes measured in the Bore underestimate total present-day erosion by approx-imately this magnitude, actual total present-day rates may be slightly higher than long-term rates (as in Fig. 4a), but the dif-ferences would still be lower than the ∼ 10-fold increases in present-day erosion over the long term observed elsewhere. Moreover, it is unclear whether erosion in the Nepal Mid-dle Hills is in fact characterized by as much as 35 % bed-load transport, as measured in the High Himalaya. Bedbed-load transport may be less important in other mountainous en-vironments (Lane and Borland, 1951), and Hewawasam et al. (2003) observed similarity in total sediment delivery to reservoirs (which includes bedload material) and suspended sediment fluxes in the tropical highlands of Sri Lanka, sug-gesting relatively low bedload transport there.
5.2.3 How representative are the short-term flux
measurements?
The short-term data on stream sediment flux and soil loss from plots in the Likhu were all collected from a short time window (over 1–3 years) in the early 1990s. Erosion over longer (e.g., decadal or even centennial) timescales is most relevant for soil degradation, reservoir sedimen-tation, and similar environmental concerns. Rainfall and runoff were slightly lower than the longer-term average dur-ing the observational period in the 1990s in the Likhu, so the measured fluxes may underestimate actual erosion rates over decadal timescales (Brasington and Richards, 2000). Moreover, short-term measurements can inherently underes-timate longer-term erosion rates if they miss episodic high-magnitude, low-frequency events (e.g., Covault et al., 2013; Kirchner et al., 2001). The similarity between short- and long-term rates that we observe might be an artifact of mea-surement if decadal sediment fluxes are actually significantly elevated relative to the long-term rates but measured sedi-ment fluxes were underestimated during our observational period. Sediment fluxes have been measured over a much longer period of time in the nearby Trisuli River (Fig. 1), with calculated sediment yields of 970 t km−2yr−1(Chalise and Khanal, 1997; unknown number of samples and time in-terval) and 542 t km−2yr−1 (Andermann et al., 2012; based on 665 measurements between 1973 and 1979). These val-ues are similar to the 341–1527 t km−2yr−1observed in the Bore Khola (Table 3). The Trisuli Basin (∼ 4500 km2area) covers a much larger area than the Likhu and includes
signifi-Table 4.Summary of erosional fluxes measured in the Likhu Khola.
Measurement Source Site Sediment flux
t km−2yr−1
Suspended Brasington and Bore Khola 341–1527
sediment flux Richards (2001)
Soil loss rate Gardner and Gerrard Irrigated terraces n.a.
from plots (2001, 2003) Rainfed terraces 460+469/−138
Grassland 50
Forest 50
Degraded forest 100–2000
Mass wasting flux Gerrard and Gardner Irrigated terraces 48
by land use type (2002) Rainfed terraces 364
Grassland 186
Forest 80
Degraded forest 2395
and scrubland
Mass wasting flux Gerrard and Gardner Bore Khola 57
by catchment (1999, 2002) Likhu Khola 551
Likhu Khola* 406
Flux from long- Table 3 Bore Khola 572–910
term denudation Likhu Khola 806–1872
* Area-weighted average for Likhu catchment, based on estimated denudation rate of 0.325 mm yr−1and landslide material density of 1.25 g cm−3, after Gerrard and Gardner (2002).
cant portions of the High Himalaya, so comparing rates from these two catchments is not straightforward. The High Hi-malaya generally produce higher long-term background ero-sion rates than the Middle Hills (Gabet et al., 2008; Godard et al., 2014), so if anything we might expect the Trisuli erosion rates to be higher than in the Likhu over similar time win-dows. The similarity of the Trisuli sediment fluxes to those measured in the Likhu provides a first-order indication that the Likhu fluxes are not grossly underestimated.
5.2.4 How representative are the background
denudation estimates?
The long-term, background denudation rates calculated from 10Be
qtzusing Eq. (1) assume steady state, which may be per-turbed in settings such as the Likhu over the long-term by mass wasting (e.g., Niemi et al., 2005; Puchol et al., 2014; West et al., 2014; Yanites et al., 2009), and in the short term by anthropogenic soil reworking (e.g., von Blanckenburg et al., 2004; Brown et al., 1998; Ferrier et al., 2005). We con-sider the importance of these non-steady-state processes for calculated rates in the Likhu by modeling the perturbation to 10Be concentration–depth profiles (see details in Appendices A2 and A3). In brief summary:
– Observed mass wasting fluxes in the Bore and the
Chin-nya are low (Table 3), so we expect that landslide ac-tivity does not strongly bias our calculated steady-state
denudation rates for these sites (see Appendix A2). This is supported by the lack of significant grain size de-pendency of 10Beqtz for the Bore and Chinnya sam-ples, since significant landslide contributions have been found to generate large grain size differences (e.g., Aguilar et al., 2014; Belmont et al., 2007; Brown et al., 1995; Puchol et al., 2014). Such grain size variations are not universally observed (Clapp et al., 2002; Kober et al., 2012; Safran et al., 2005), so this cannot be taken as absolute confirmation that landslides are unimportant, but the combination of low present-day landslide fluxes and similarity across grain sizes suggests mass wasting processes probably do not strongly bias our estimated rates.
– Landslide occurrence is greater in the Likhu main stem,
and is high enough to theoretically introduce significant uncertainty in our calculations. The Likhu catchment area is sufficiently large (> 100 km2) that it may be ex-pected to effectively average mass wasting inputs that occur stochastically in time and space across the catch-ment area (cf. model predictions of Niemi et al., 2005; Yanites et al., 2009), although episodic events may bias denudation rates estimates to some extent even in large catchments (West et al., 2014). In any case, the denuda-tion rates we infer for the Likhu main stem are presented only for wider context and are not the primary reference for comparison to present-day sediment yields.
– Anthropogenic reworking of soils due to agricultural
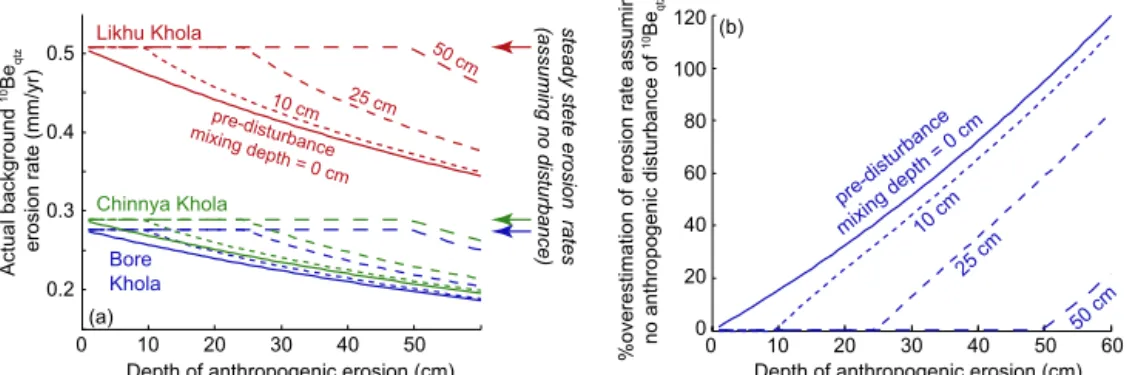
ac-tivity may influence long-term erosion rates calculated from cosmogenic nuclide concentrations. For example, if land use has led to the loss of upper soil horizons, thereby removing10Be-enriched surface material, then lower10Be surfaces supplying sediment to the streams today may yield a higher inferred erosion rate than is characteristic of natural background rates (e.g., von Blanckenburg et al., 2004; Brown et al., 1998; Ferrier et al., 2005). The uncertainty introduced as a result of such land use effects depends on (i) the depth of agricultural reworking and (ii) the depth of natural background soil mixing (see Appendix A3). We anticipate that the depth of reworking is not significantly greater than the depth of the mixed layer, since Likhu soils are on steep slopes and typically in the range of 0.5–2 m thickness. In this case, agricultural reworking would have no significant influence on denudation rates calculated from 10Beqtz (Granger and Riebe, 2007). However, if the depth of re-working exceeded the mixing depth by ∼ 0.5 m, for ex-ample via rill formation (e.g., von Blanckenburg et al., 2004), we estimate that the actual long-term denudation rates could be as much as ∼ 50 % lower than those we infer from Eq. (1). For the headwater Bore and the Chin-nya samples, which provide the reference for compari-son to the short-term erosion rates, agricultural rework-ing is expected to be minimal since the upstream areas are predominantly forested (Fig. 3; Table 1).
Non-steady-state effects may also arise in river systems due to stochastic variability in sourcing of sediment, as suggested for large rivers draining the High Himalaya in central Nepal (Lupker et al., 2012). In particular, variation over time in in-put of sediment from source areas with distinct elevations and thus distinct10Be production rates may lead to variable 10Be
qtz. The Bore and Chinnya are both low-order, headwa-ter catchments, and these systems are not large enough to ex-pect large changes in sources from different tributaries. Vari-able sourcing might be one explanation for the lower10Beqtz and thus higher inferred erosion rates in the Likhu main stem, as discussed above.
Although we cannot conclusively rule out some non-steady-state bias in our calculation of background denuda-tion rates, addidenuda-tional confidence in our inferred steady-state rates comes from comparison to long-term rates observed in other studies in the Nepal Middle Hills (Fig. 4; Table S1). Calculated steady-state denudation rates are similar across a wide range of catchments, despite differences in land use and catchment size; larger variability in steady-state rates from one catchment to another would be expected if10Beqtz -derived denudation rates were significantly influenced by land use or mass wasting in this environment. Moreover, the spatially consistent rates across the Nepal Middle Hills are also temporally consistent with long-term exhumation rates determined from thermochronology (Godard et al., 2014),
! 9
0 5 km
84˚18' 84˚24'
28˚18' 28˚24'
Khudi Khola mainstem
Sediment flux:
1.5-3.0 mm/yr (Gabet et al., 2008)
10Beqtz denudation rate:
2.8±0.7 mm/yr (Godard et al., 2012) 3.4±0.3 mm/yr (Niemi et al., 2006)
10Beqtz denudation rate:
0.7-2.4 mm/yr (Puchol et al., 2014) MCT Large landslides Volume losses: 2.6±0.9 mm/yr (Gallo & Lavé, 2014)
10Beqtz denudation rate:
0.8-4.4 mm/yr (Puchol et al., 2014) elevation (m) Marsyandi River 1000 2000 3000 4000 5000 Khudi Khola
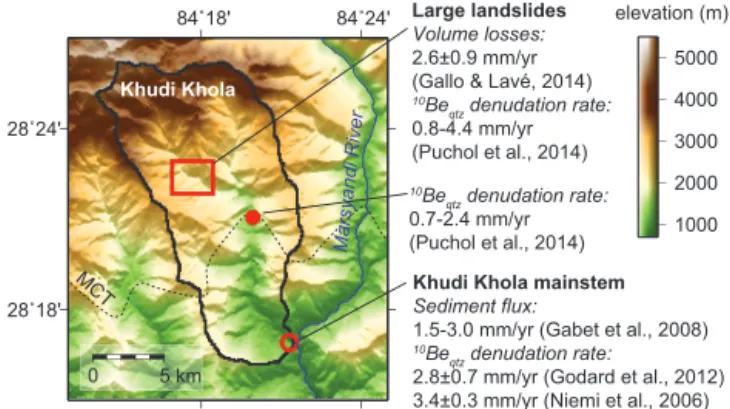
Figure 5.Khudi Khola catchment and reported erosion rates. Back-ground elevation map from SRTM data at 90 m resolution; the solid black line is the Khudi catchment boundary and the dashed line (MCT) is the location of the Main Central Thrust from Puchol et al. (2014). Data are shown from a range of studies of both short- and long-term erosion rates in this catchment, which is eroding much more rapidly compared to the Likhu Khola (Fig. 3), is dominated by landslide erosion, and has little agricultural activity compared to the Likhu Khola.
suggesting that the inferred rates provide a reasonable esti-mate of actual long-term denudation.
5.3 Comparison of short- vs. long-term rates across
Nepal
Additional short- and long-term erosion rate data from simi-lar sites elsewhere in Nepal help provide more information to assess whether the short- versus long-term comparison in the Likhu data is representative. The significant spatial variabil-ity in erosion rates across Nepal (Fig. 1) and uncertainty in the wider Nepal sediment flux data (e.g., comparing data cal-culated by two different methods in Table S2; see Fig. S1) complicate direct comparison of erosion rates determined at other sites with those from the Likhu specifically. More-over, none of the other short- and long-term data are paired from the same sites in the Middle Hills. However, consid-ering the distribution of denudation rates across the Nepal Middle Hills, the picture is consistent with the Likhu data (range plotted for “Nepal Middle Hills” in Fig. 4). Overall, there may be a hint of a slight increase in short-term fluxes compared to long-term, and this may reflect a slight anthro-pogenic enhancement of erosion. But there is no evidence to support a large systematic difference, consistent with the similarity of short- and long-term erosion rates observed for the Likhu.
One other intensively studied site in Nepal, the Khudi Khola, also shows similar long-term denudation rates and sediment fluxes (Fig. 5). Both short- and long-term rates of erosion were measured at this site over a period of sev-eral years (Gabet et al., 2008; Niemi et al., 2005; Godard et al., 2012; Puchol et al., 2014). The Khudi catchment en-compasses mostly areas north of the MCT with very high
total denudation rates (∼ 2–3 mm yr−1for the catchment as a whole), and with little agricultural activity compared to the Likhu Khola. The high erosion rates in this catchment are thought to be largely dominated by landslides, and most of the decadal-timescale mass flux has been attributed to one large landslide source (Gallo and Lavé, 2014). The Khudi thus represents a significantly different geomorphic regime when compared to the Likhu, but again in this case the data do not suggest a dominant anthropogenic imprint on total erosional fluxes in the Nepal Himalaya (although such an im-print would probably be unexpected, given the high landslide rate and limited extent of agricultural activity in this catch-ment).
Similarly, the10Beqtzdenudation rates and sediment fluxes from larger river basins in Nepal are generally similar in magnitude in most cases (e.g., when comparing 10Beqtz -derived rates from Lupker et al., 2012, and sediment fluxes from Andermann et al., 2012; see Fig. 1). These basins span across multiple physiographic regimes, which are charac-terized by distinct erosion rates (with typically higher ero-sion rates in the High Himalaya relative to the Middle Hills; Wobus et al., 2005; Godard et al., 2014). This heterogeneity means that it is not straightforward to isolate a single vari-able such as the effect of land use from these data, but the first-order similarity is consistent with the range of other ob-servations including our results from the Likhu.
5.4 Implications: sediment delivery, mass wasting, and
soil production
The implications of our results are that most of the sediment carried by the Likhu Khola, and by other similar rivers drain-ing the Nepal Middle Hills, does not come from agricultural land degradation but rather from naturally high rates of land-scape denudation. This observation suggests that soil man-agement efforts should not necessarily be expected to dra-matically reduce sediment delivery to downstream reservoirs and floodplains.
However, the lack of difference between short- and long-term erosion rates in Nepal cannot be taken on its own as evidence that land use is not affecting soil loss and hasten-ing potential degradation of soil resources. This is because it is difficult to use catchment-scale fluxes to tease apart land use effects on soils specifically in cases where total erosion is dominated by gullies, landslides, debris flows, and analo-gous mass wasting sources. Where these processes are im-portant, the observed catchment-scale rates (both short- and long-term) become dominated by the mass wasting supply, rather than by soil erosion, and small changes in erosion from soils become indistinguishable at the catchment scale. The comparison of short- and long-term rates then would not, on its own, reveal the extent to which agricultural land use degrades soil resources. The High Himalayan Khudi Khola (Fig. 5) represents an end-member case where most sedi-ment is derived from mass wasting (cf. Niemi et al., 2005);
the question is to what extent the same is true for the Likhu Khola and other Middle Hills catchments.
We can assess the relative importance of different erosion processes by mass balance. For a steady-state natural erosion system in the absence of agricultural activity, the erosional flux from long-term denudation (FLT, derived from10Beqtz) should be the sum of losses in dissolved form through chem-ical weathering, FDISS, the denudation driven by mass wast-ing (FMW), and the rate of incremental sediment loss from hillslopes, predominantly via diffusion-like sediment trans-port processes such as sheet erosion and rain splash erosion (collectively, FDIFF). If FLT, FMW, and FDISSare known, and the erosional system is assumed to be at steady state at the catchment scale, then catchment-average rates of incremen-tal sediment loss can then be estimated as
FDIFF=FLT−FMW−FDISS. (2)
We can consider an analogous mass balance relation for soil production. The mobile solid material that makes up soil is produced via a range of biotic and abiotic processes on hillslopes (e.g., Heimsath et al., 1999). This soil material does not accumulate indefinitely but is removed by a com-bination of incremental, diffusive erosion and slope failures that remove soil from hillslopes (FMW,SOIL). Again assum-ing steady state, soil production (FSP) at the catchment scale should be described by
FSP=FDIFF+FMW,SOIL. (3)
Combining Eqs. (2 and 3) yields
FSP=FLT+FMW,SOIL−FMW−FDISS (4) or
FSP=FLT−FDISS−FMW×(1 − RMW,SOIL), (5) where RMW,SOILis the proportion of the mass wasting flux constituted by mobile soil material.
For the Likhu Khola case, FLTis known from the10Beqtz -based denudation rates (Table 3), and FDISS is consid-ered to be a minor (< ∼ 5-10 %) portion of the total bud-get (see discussion in Sect. 5.1, above). Lacking more ro-bust constraints, we assume here that the present-day mass wasting rates measured in the Likhu Khola (Table 4) re-flect background natural fluxes from mass wasting, pro-viding a first-order estimate of FMW. Neither RMW,SOIL nor FMW,SOIL is known for this case, but we can calcu-late a minimum value for soil production by assuming that these values are zero, i.e., assuming that the mass wast-ing flux of soil material is negligible. For these assump-tions, then from Eq. (4), resulting steady-state soil production rates (Fig. 6) would be 868 ± 598 t km−2yr−1for the Likhu catchment (1274 ± 598 t km−2yr−1 total denudation minus 406 t km−2yr−1 mass wasting) and 671 ± 156 t km−2yr−1 for the Bore subcatchment (728 ± 156 t km−2yr−1 total
diffusive sediment transport 0 400 800 1200 2000 1600 Bore Khola Likhu Main stem mass wasting Denudational Flux (t.km -2.yr
-1) Denudation Rate (mm/yr)
0.60
0 0.20 0.40 0.80
Figure 6.Contribution to catchment-wide denudation from mass wasting (determined from present-day measurements) and incre-mental sediment transport via diffusive-type processes (inferred as difference between mass wasting and total measured denudation rates; see text). Assuming present-day catchment-wide mass wast-ing fluxes represent the long-term average, then fluxes of diffusive sediment transport are similar for the Likhu main catchment and the Bore subcatchment. The diffusive fluxes provide a minimum estimate for soil production rates (see Sect. 5.4). Note that this par-titioning yields a value for catchment-averaged soil production, and does not capture significant heterogeneity in soil production rates from one soil site to another within each catchment.
denudation and 57 t km−2yr−1 mass wasting). Interest-ingly, these soil production rates, equivalent to ∼ 0.25– 0.35 mm yr−1, are similar for both the Likhu and the Bore despite the very different rates of total denudation. Nonzero
FMW,SOILwould have little effect on the calculated soil pro-duction rate of the Bore, since the correction for mass wast-ing is small; the effect would be larger for the Likhu though it is possible that landslides in this catchment are domi-nated by non-soil material (i.e., with relatively low values of FMW,SOIL).
There are several reasons that the estimates of FMWused here may not accurately reflect long-term mass wasting rates, thus biasing our calculation of soil production rates. Present-day mass wasting estimates may be enhanced due to land use (Gerrard and Gardner, 2002), and if actual long-term mass wasting fluxes are lower, actual soil production rates would be higher. On the other hand, the episodic nature of landslides, particularly in a seismically active region (e.g., Keefer, 2004), may mean that the present-day mass wast-ing volume underestimates long-term rates by not captur-ing storm- or earthquake-triggered landslides, in which case soil production rates would be lower than our estimates. More comprehensive mapping of landslides over time could provide the foundation for more robustly determining de-nudation by mass wasting in the Middle Hills (cf. Hovius et al., 1997). However, this would require time series of high-resolution imagery, or other means of deriving landslide maps, that are not available in this study. We regard the mass wasting fluxes used here as an initial estimate allowing us to consider the balance of soil production as a proportion of
to-Catchment-average
Soil Erosion Budget (t.km
-2.yr -1) Degraded forest & scrubland -2000 -1500 -1000 -500 0 500 1000 0 0.25 Pristine forest Grassland Rainfed bari terraces -0.25 -0.50 -0.75 Surface change equivalent (mm/yr) partially degraded highly degraded
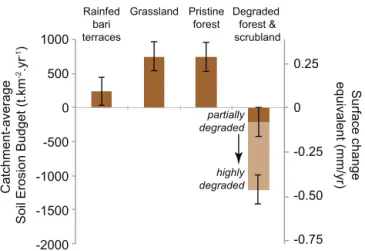
Figure 7.Net soil production/loss budget for different land use types in the Likhu Khola. Annual catchment-wide soil erosion bud-get based on inferred minimum soil production rates and mea-sured soil losses from plots (Gardner and Gerrard, 2001, 2003). Site-specific soil production (and erosional loss) is likely to be highly variable, so the budget shown here will not apply to all soils. Nonetheless, the net budget illustrates that some land uses such as well-maintained terraces may have minimal effects on soil degra-dation, while other land uses may lead to highly unsustainable soil losses.
tal denudation in the Likhu. We emphasize that further work to better constrain the quantities in Eq. (5) – including direct measurement of soil production rates on hillslopes, longer-term information about landslide rates, and data on the pro-portion of the landslide flux from soil material – would help to provide better understanding.
Nonetheless, despite the uncertainties in our assumed val-ues, it is interesting to consider the possible implications of our estimated soil production rates. These rates for the Likhu are relatively high in the global context but within the range observed for other mountain environments (Heimsath et al., 2012; Larsen et al., 2014). They suggest that the natural con-version of bedrock to soil is expected to yield relatively high sediment fluxes from hillslopes. Thus erosional losses from agricultural soils in the Middle Hills should not inherently be a cause for alarm on their own, although very high rates of soil loss, for example from degraded or abandoned lands, should be of concern (consistent with conclusions of Burton et al., 1989; Gardner and Jenkins, 1995; Merz, 2004). The inferred soil production rates can be compared to plot-scale soil losses to estimate the agricultural soil budget (Fig. 7). For degraded forests and scrubland, the deficit that results from anthropogenic modification is significant, in the range of 500–1500 t km−2yr−1, or ∼ 0.2–0.6 mm yr−1 excess soil removal. This rate of removal could rapidly deplete soil re-sources (i.e., in comparison to A-horizon depths of ∼ 10– 40 cm in the Likhu). Data on soil loss rates are not avail-able for khet terraces, but for bari terraces, the resulting deficit from soil erosion is insignificant, suggesting that these
terraces are effective at retaining soil. However, this result should be treated cautiously. For example, slumping of ter-race risers is frequently observed (e.g., Gerrard and Gard-ner, 2000) and if such damage is not repaired it could lead to longer-term enhanced erosion. Moreover, modeling of soil erosion in the Likhu suggests that rainfed bari terrace soil losses may be significantly higher than the measured rates used in Fig. 7, while degraded forest losses may be lower (Shrestha, 1997). If bari terraces loss rates are in the range of 1000 s of t km−2yr−1, as suggested by the model results, associated soil deficits would be much larger for this land use type than shown in Fig. 7.
Despite the many uncertainties, the conceptual framework illustrated in Figs. 6 and 7 may provide a useful context for considering how soil loss from agricultural land use com-pares to the long-term rates of soil production. One important consideration in such budgets is that the calculated soil pro-duction rates represent catchment-wide average values, and site-specific soil production rates are expected to vary signif-icantly within the catchment, e.g., as a function of soil depth (Heimsath et al., 1997, 2012), which typically varies with to-pographic position. The deficits calculated for specific land use types provide a broad landscape perspective but are not expected to apply to all individual soil sites. It is also im-portant to recognize that soil development and thickening is expected to take place in the short term where the soil erosion budget is positive under a given land use type, but over the long timescales of landscape evolution, these soils are likely to be disturbed by episodic losses, e.g., by slumping or other hillslope failure. Thus positive values in Fig. 7 will not neces-sarily lead to continued soil thickening across the catchment area over the long term.
6 Conclusions
Data on denudation rates from the agriculturally modified Middle Hills of Nepal show little measurable differences be-tween short-term erosion rates, determined from river sedi-ment fluxes and plot soil loss rates, compared to long-term “natural” background denudation rates, determined from cosmogenic 10Beqtz. The exception is on highly degraded lands where present-day soil losses are higher than back-ground rates. The measured long-term cosmogenic rates are independent of the grain size analyzed for the catchments studied. The only significantly different long-term denuda-tion rate is for the Likhu Khola main stem, which may be associated with enhanced denudation from activity on the Likhu Fault, but also may be influenced by sourcing effects, by the greater portion of agricultural land use in the catch-ment area, and/or by alluvial reworking of sedicatch-ments with low10Beqtzby the larger river.
The similarity of short- and long-term rates in the Likhu Khola, and more widely in the Nepal Middle Hills, is in notable contrast to the large enhancement of short-term
fluxes observed in other montane agricultural catchments. The Nepal data suggest that
1. much of the sediment carried by rivers out of the Nepal Middle Hills is derived from natural erosion, resulting from a combination of mass wasting and soil production from hillslopes, and does not result from soil degrada-tion as a result of agriculture;
2. as suggested in previous research, well-maintained ter-raced agricultural practices in the Nepal Middle Hills appear to prevent very rapid acceleration of erosion that may take place under other mountain agriculture; 3. since overall erosion rates and rates of soil production
are high, the loss of soil may not be unsustainable from well-maintained terraces, although less well-managed lands may be subject to rapid soil depletion relative to soil production, confirming previous work that has high-lighted the risk of soil erosion on degraded lands in the Himalaya.
The sustainability of soil resources with respect to natural rates of hillslope soil production in the Himalayan Middle Hills depends on how lands are maintained. Our study sup-ports the idea that poor land management indeed leads to un-sustainable deficits of soil loss, while well-maintained ter-races effectively mitigate such degradation. Additional data from longer time intervals that include higher magnitude ero-sional events would be important for confirming these obser-vations. It is also important to recognize that the results from this study only concern the physical rates of soil loss and do not capture other potential aspects of environmental degra-dation associated with intensive agricultural land use, such as nutrient losses from soils and impacts on aquatic systems (e.g., Schreier et al., 2006).