HAL Id: hal-03194765
https://hal.archives-ouvertes.fr/hal-03194765
Submitted on 9 Apr 2021HAL is a multi-disciplinary open access
archive for the deposit and dissemination of sci-entific research documents, whether they are pub-lished or not. The documents may come from teaching and research institutions in France or abroad, or from public or private research centers.
L’archive ouverte pluridisciplinaire HAL, est destinée au dépôt et à la diffusion de documents scientifiques de niveau recherche, publiés ou non, émanant des établissements d’enseignement et de recherche français ou étrangers, des laboratoires publics ou privés.
Kamal Agharroud, Lionel Siame, Abdelkhalak Ben Moussa, Olivier Bellier,
Valéry Guillou, Jules Fleury, Younes El Kharim
To cite this version:
Kamal Agharroud, Lionel Siame, Abdelkhalak Ben Moussa, Olivier Bellier, Valéry Guillou, et al.. Seismo-tectonic model for the southern Pre-Rif border (Northern Morocco): Insights from mor-phochronology. Tectonics, American Geophysical Union (AGU), In press, �10.1029/2020TC006633�. �hal-03194765�
Seismo-tectonic model for the southern Pre-Rif border (Northern Morocco): Insights
1from morphochronology
2Kamal Agharroud1, Lionel L. Siame*,2, Abdelkhalak Ben Moussa1, Olivier Bellier2, Valéry 3
Guillou2, Jules Fleury2, Younes El Kharim1 4
1Faculté des Sciences de l’Université Abdelmalek Essaâdi, Département de Géologie, Tétouan, 5
Maroc. 6
2Aix Marseille Univ., CNRS, IRD, INRAE, Coll France, CEREGE, Aix-en-Provence, France. 7
*Corresponding author: Lionel Siame (siame@cerege.fr)
8 9
Key Points: 10
• High resolution digital topography helps locate morphological indexes of active tectonics 11
in Morocco. 12
• Cosmogenic nuclides allow placing time constraints for landscape development in the 13
Southern Rif Front. 14
• The Southern Rif Front is an important geodynamic boundary with a non-negligible 15
seismogenic potential. 16
(The above elements should be on a title page) 17
Abstract 19
Located at the southern boundary of the Alpine chain in Morocco, the deformation front of the 20
Southern Rif Mountains is a region of moderate tectonic activity, which makes it a good natural 21
laboratory to understand whether, and how, low compressional strains are located on specific 22
structures. Along the ≈80 km-long left-lateral, transpressive and reverse fault zone that runs at the 23
toe of the Pre-Rif Ridges, an analysis of high-resolution digital topography provides new 24
geomorphic lines of evidence supporting Quaternary activity along, 20 km-long fault segments. 25
The fault zone can be divided into the Meknès and the Fès segments, which are constrained at 26
depth by reactivated, NE-trending basement faults, delimitating paleo-grabens associated with the 27
Late Triassic-Jurassic opening of the Atlantic Ocean. For selected sites, we used in situ-produced 28
36Cl, 10Be and 26Al and high-resolution topography to infer the timing of abandonment of fluvial 29
markers, which suggest incision rates on the order of 0.6-2 mm/yr. Given their lengths, scaling 30
laws suggest that the identified fault segments should root at about 7-12 km-depth, possibly 31
reactivating former basement normal faults and making them potential seismogenic sources 32
capable of generating Mw6+ earthquakes, with return times of the order of several hundreds of 33
years. Our new morphochronological dataset confirms that the Southern Rif deformation front is 34
a key structure that may have accommodated most of the lateral extrusion of the Rif between the 35
Nubia and Iberia tectonic plates. 36
1 Introduction 37
In intraplate tectonic regions characterized by moderate seismic activity, the recognition of active 38
zones of deformation has long been a challenging task (e.g., Landgraf et al., 2017). Like Northern 39
Africa, such regions are generally characterized by low hazard but high risk due to the 40
concentrations highly vulnerable population and/or infrastructures (Moreno et al., 2004). 41
Moreover, when low strain rates are combined with meteorological and anthropogenic overprints, 42
the geomorphic signatures associated with active faults fade away as fault slip rates decrease. 43
Consequently, diagnostic criteria established in areas of high strain rates may not be effectively 44
applied. Furthermore, low-levels of seismic strain induce low displacement rates, which may be 45
distributed over numerous fault segments rather than localized on a single fault. At the regional 46
scale, such a distribution of the tectonic deformation can also obscure the seismogenic potential of 47
any given single structure, as, for example, the La Rouvière Fault reactivation during the 2019 48
Mw 4.9 Le Teil Earthquake (Ritz et al., 2020), in southeastern France, which was previously 49
considered as inactive (Jomard et al., 2017). 50
Part of the peri-Mediterranean Alpine chain surrounding the Alboran Sea, the Rif Mountain belt 51
in Morocco is an area of moderate tectonic activity. Located within the diffuse convergence zone 52
between the Nubia and Iberia plates (Fig. 1), this region experienced an oblique NW-SE 53
shortening, with an estimated rate of about 4 mm/yr from global positioning system (GPS) data 54
(McClusky et al., 2003) and geologically current plate motions (DeMets et al., 2010). At a first 55
order, the present-day pattern of GPS displacement is in good agreement with the regional 56
evidence for tectonic activity in Northern Morocco (Morel and Meghraoui, 1996) and in the Baetic 57
Ranges (Giaconia et al., 2012), which indicates a combination of crustal shortening in the Rif and 58
extension in the Alboran Sea (e.g., Vernant et al., 2010). However, the southward-directed crustal 59
motions observed in the Central Rif (Fig. 1), almost normal to the direction of Nubia-Iberia plate 60
motion, are incompatible with a simple two-plate model (Fadil et al., 2006; Vernant et al., 2010; 61
Pérouse et al., 2010). This particular situation is still a matter of debate and models involving 62
complex relationship between mantle processes and crustal tectonics have been put forward such 63
as, among others, oceanic lithosphere slab rollback or slab break-off of a subducting continental 64
lithosphere (e.g., Bazada et al., 2013 and references therein). Recent numerical models and gravity 65
data indeed suggest an efficient coupling between the upper mantle and the crust (e.g., Baratin et 66
al., 2016), which could be triggered by a rollback of the delaminated African lithospheric mantle 67
pulled by a sinking oceanic Western Mediterranean slab (e.g., Faccenna et al., 2004; Bezada et al., 68
2013). These recent advances in geodesy, seismology, and gravimetry indicate that much of the 69
Rif kinematics cannot be simply associated with the convergence between the Nubia and Iberia 70
plates, but is rather linked to some ongoing delamination and convective removal of the 71
lithospheric mantle beneath the orogen and back-arc opening in the Alboran Sea (Vernant et al., 72
2010). This complex geodynamic setting yielded shortening in the upper brittle crust 73
approximately along the southern termination of the Rif, as defined by GPS measurements and 74
fault block models (Fadil et al., 2006; Vernant et al., 2010; Koulali et al., 2011). 75
76
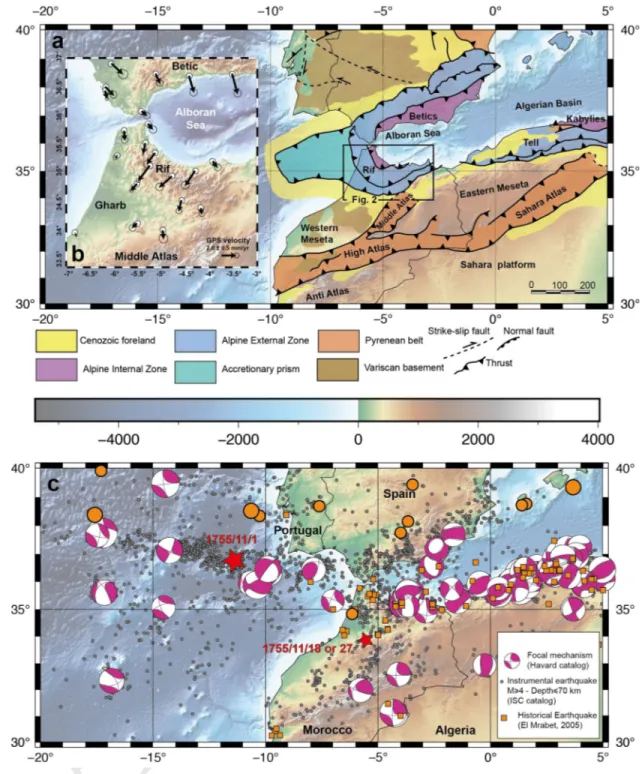
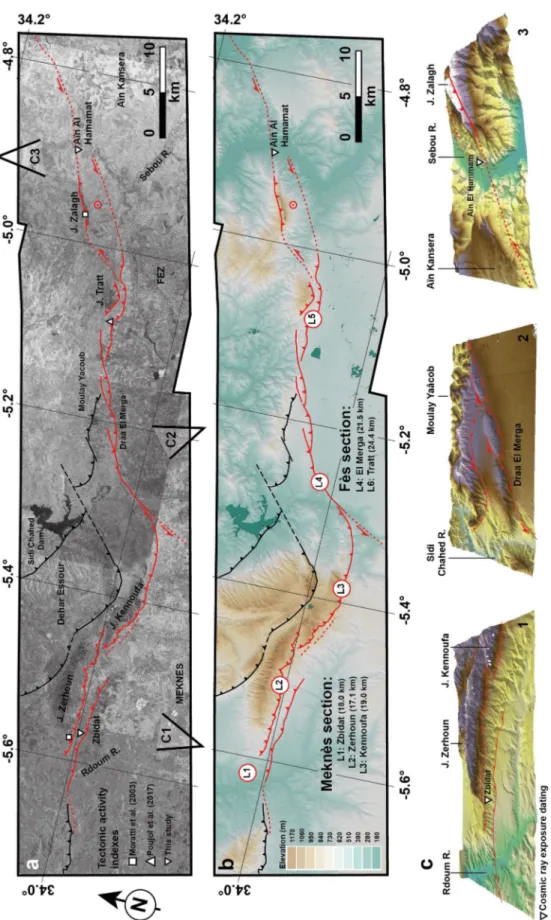
Figure 1. Geodynamic setting of Morocco. (a) Simplified map of the major Cenozoic structural trends
77
centered on the Baetic-Rif Belt (modified after Etheve et al., 2016); (b) GPS-derived kinematics (relative 78
to fixed Nubia) in northern Morocco and in the Alboran region (after Koulali et al., 2011); (c) Map of the 79
instrumental (International Seismological Center, 2020), focal mechanisms (Harvard global centroid 80
moment tensor catalogue; e.g., Dziewonski et al., 1981; Ekström & Dziewonski, 2012), and historical 81
epicentres in the Maghreb region (El Mrabet, 2005). Red stars locate the epicentre areas of the November 82
1, 1755 and November 18 or 27, 1755 (see text for discussion). 83
While geomorphic studies have long demonstrated the tectonic activity of the Rif and the Pre-Rif 84
Ridges (Morel, 1988, 1989), it is only recently that dating techniques such as optically-stimulated 85
luminescence or in situ-produced cosmogenic nuclides have enabled determination of time 86
constraints on fault activity in the Rif, such as along the Nekor Fault (Poujol et al., 2014) or the 87
Pre-Rif Ridges (Poujol et al., 2017). The latter have also been identified as a probable source for 88
several historical earthquakes in the Fès-Meknès region (Moratti et al., 2003; El Mrabet, 2005; 89
Chalouan et al., 2014; Poujol et al., 2017) but a reappraisal of the morpho-structures associated 90
with the Pre-Rif front, and their relationships with inherited basement structures, is still needed in 91
order to better characterize their segmentation, kinematics, and seismogenic potential. 92
This study presents a new set of diagnostic criteria to identify and characterize the tectonic activity 93
of the faults running along the southern Pre-Rif border, taking into account different spatial scales 94
and time windows (Fig. 2). Starting from a regional reappraisal of already published data, we 95
provide a new morpho-chronological dataset, using structural morphology and cosmogenic 96
exposure dating (in situ produced 10Be, 26Al and 36Cl) of alluvial terraces, bringing additional lines 97
of evidence for tectonic activity along the boundary between the Pre-Rif Ridges and the Saïss 98
Basin (Fig. 2). All together, this new data set enables us to identify and characterize active 99
structures with slip rates of the order of about 1 mm/yr, providing a basis for a renewed seismic 100
hazard assessment in a region where the large cities of Meknès and Fès host nearly 2 million 101
people. 102
2 Active tectonics of Northern Morocco 103
Although the seismic hazard in Morocco is not as important as in other Mediterranean countries 104
like Italy, Turkey or Greece, it is far from being negligible. Indeed, the relatively superficial nature 105
of the seismicity may combine with weak ground mechanical properties to induce relatively strong 106
accelerations that may lead to significant damage to buildings that do not always meet construction 107
standards (Mourabit et al., 2014). During the last decades, Morocco suffered from several 108
destructive earthquakes such as the Mw 5.9 Agadir event in 1960 or more recently those that struck 109
the region of Al Hoceima in 1994 (Mw 5.7), 2004 (Mw 6.3) and 2016 (Mw 6.3). 110
In the Gulf of Cadiz, oceanic earthquakes may also be tsunamigenic, like the Lisbon Earthquake 111
on November 1st, 1755 (M≈8.5-9) (Martinez-Solares et al., 1979; Johnston, 1996; Gutscher, 2004; 112
Gutscher et al., 2006). However, the frequency of such large events remains a major unknown 113
given the uncertainties weighting on the length of the seismic cycle in a context where the tectonic 114
rates are only a few mm/yr (Vernant et al., 2010). In the Gulf of Cadiz, the strongest recent 115
earthquake is that of February 28, 1969 (Mw 7.8; Fukao, 1973). Since 1970, only 19 events have 116
been recorded with a magnitude larger than five and only two with a magnitude larger than six 117
(Matias et al., 2013). 118
In Morocco, the most seismically active zone is located within the Rif domain (Fig. 1). This 119
regional seismicity is mainly distributed within the upper 30 km of crust, although deeper activity 120
is recorded in the eastern part of the Gibraltar Strait, the western Alboran, and in the Middle Atlas 121
(Hatzfeld & Frogneux, 1981; Cherkaoui, 1991; deVicente et al., 2008; Thiébot & Gutscher, 2006). 122
South of the Rif Mountains, seismicity is significantly more distributed in the Middle Atlas and 123
the High Atlas (Cherkaoui & Medina, 1988; Cherkaoui & Asebriy, 2003; El Alami et al., 1992; 124
Sébrier et al., 2006). 125
In the majority of cases, historical descriptions of Moroccan earthquakes are not sufficiently 126
detailed to precisely evaluate both the epicentral areas and event intensities. El Mrabet (2005) 127
established a reference list of the main historical earthquakes, compiling and analyzing different 128
catalogues (Roux, 1934; Galbis Rodriguez, 1932, 1940; El Alami et al., 1998; Cherkaoui & 129
Asebriy, 2003). In close agreement with the distribution of the instrumental seismicity, these 130
historical events are mainly located in the Tell-Rif Alpine chain (Fig. 1). Along the southern border 131
of the Rif Mountains, the region of Meknès and Fès has experienced almost 10 earthquakes since 132
the eleventh century (Roux, 1934; El Mrabet, 2005; Paláez et al. 2007; Blanc, 2009; Mourabit et 133
al., 2014; Cherkaoui et al., 2017), with three moderate to large events with intensities ranging 134
between VII and VIII in 1045, 1624, and 1755 (Fig. 1). Overshadowed by the large Lisbon 135
Earthquake in the historical archives (e.g., Blanc, 2009), the precise date of the Fès-Meknès 136
Earthquake is unclear, with Spanish and Portuguese sources referring to a shock on November 18, 137
which could be interpreted as an aftershock of the Lisbon Earthquake (Pereira de Sousa, 1919; 138
Roux, 1934; Vogt, 1984), whereas Arab sources document it on November 27, with an epicentral 139
intensity of VIII that was restricted to the Saïss Region (Moratti et al., 2003; Poujol et al., 2017). 140
141
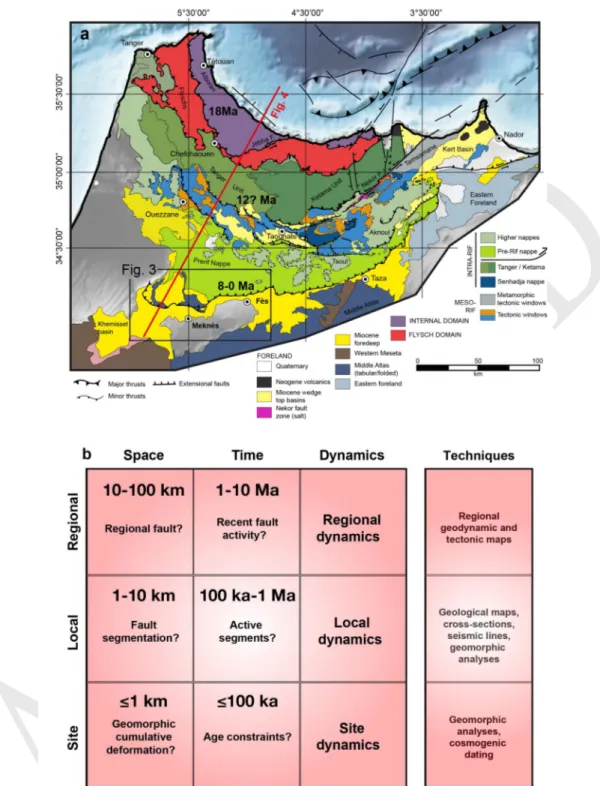
Figure 2. (a) Structural map of the main tectonic units composing the Rif Mountains in northern Morocco
142
(modified after Gimeno-Vives et al., 2020; Suter, 1980; Chalouan et al., 2008), and showing the period of 143
activity of the main boundary thrusts (after Abbassi et al., 2020). The open box and the red line locate the 144
map shown in Fig. 3a and the crustal-scale cross-section shown in Fig. 4a, respectively; (b) Principle of 145
matrix organization used to define a set of diagnostic criteria regarding fault activity in moderate domains 146
of tectonic deformation. The fourth column lists the different types of data that were used in this study to 147
cope with the different spatial and temporal scales (adapted from Siame & Sébrier, 2004). 148
3 Material and Methods 149
3.1 Diagnostic criteria to identify and characterize moderately active faults in Northern Morocco 150
The search for evidence of fault activity is a long investigation, based on active tectonics, 151
geomorphology, and earthquake geology. Aiming at defining the fault background, it should 152
include not only information on the fault itself but also about its relationships with the 153
seismological and structural environment. Particularly, the fault trace at the surface, as well as its 154
extent, geometry, segmentation, kinematics, and age of activity should be carefully examined 155
together with its relationship with historical and instrumental seismicity. 156
In this study, we rely on the strategy that was defined in the early 2000s by the international 157
consortium involved in the European Project “Slow Active Faults in Europe” (S.A.F.E.; EVG1-158
2000-22005), and which aimed at reducing the possible misinterpretations in identifying active 159
faults in the context of slowly deforming regions. The determination of such a set of diagnostic 160
criteria is based on a matrix-like, multi-criteria approach (Fig. 2b), which considers that it is key 161
to verify the consistency between the different spatial scales and time windows classically tackled 162
by active tectonic studies. In a simplified manner, the first column of the matrix is interested in the 163
fault existence itself, while the second one is rather focused on the evidence of fault activity at 164
various space scales. The third column deals primarily with the characterization of the fault activity 165
parameters. In a similar way, the first line deals with the regional background of the fault, while 166
the second line mainly concerns fault segmentation, and the third line is interested in more detailed 167
analyses at the site scale (e.g., detailed geomorphic, geophysical studies or paleoseismic trenches). 168
Logical algorithms were developed by the S.A.F.E. project consortium to address basic questions 169
aimed at a correct diagnosis of fault activity (Siame & Sébrier, 2004). The basic content of each 170
matrix box are documents (maps, tables, geological data…) that may be either available from the 171
literature or from new results obtained during the process. The detailed description of each matrix 172
cell box has been released in a deliverable of the S.A.F.E. project (Siame & Sébrier, 2004). 173
3.2 Geomorphic analyses across spatial scales 174
Once the existence of the tectonic features is established at a regional scale (Fig. 3 and Fig. 4), the 175
identification and mapping of fault segments generally rely on morphological and structural 176
analyses of satellite images, aerial photographs, digital terrain models, as well as field 177
observations. This makes it possible to map fault systems from a regional scale (≈100 km) to that 178
of the fault segment (≈10 km), and to locate sites deserving more detailed field investigations. In 179
this study, we focused on a morpho-chronological approach that requires the preservation of 180
tectonically offset landscape features and datable surfaces that can be used to constrain their age 181
(e.g., Ryerson et al., 2006). 182
To perform a regional survey of the fault system characterizing the front of the Pre-Rif system, a 183
topographical database was built using the Global Digital Surface Model ALOS World 3D 184
(ALOSW3D DSM), with a pixel resolution of 30 m (Takaku et al., 2014, 2018). Ruggedness and 185
topographic position are useful geomorphic tools classically used for landform classification (e.g., 186
Lindsay et al., 2015). To highlight structural and geomorphic features in the studied area (Fig. 3), 187
two grids were derived from the ALOSW3D DSM, emphasizing regional topographic gradients: 188
a map of the multiscale elevation residual index (MERI), and a map of the deviation from mean 189
elevation (DEV). These operations were performed using Whitebox Geospatial Analysis Tools 190
(3.4.0. Montreal version release in 2017; Lindsay, 2016). DEV is the difference between the 191
elevation of the spatial window centre and its mean elevation, normalized by its standard deviation 192
(Gallant & Wilson, 2000). It is a non-dimensional measure of topographic position scaled by the 193
local ruggedness, which is useful in applications where the landscapes of interest are 194
heterogeneious (De Reu et al., 2013). The MERI also characterizes the topographic position but 195
across a range of spatial scales. The algorithm calculates the difference from mean elevation in a 196
series of window sizes from 3×3 to a maximum window size that depends on the size of the DSM. 197
MERI quantifies the proportion of tested scales where the central grid cell has a higher value 198
compared to the mean elevation. Thus, MERI ranges between 0, indicating that a grid cell in a 199
DSM is lower than the mean elevation across the entire range of tested scales, and 1, indicating 200
that the location is consistently higher than the mean elevation (Lindsay, 2016). 201
To downscale the analysis of the fault morphology at the segment scale (≈10 km), we used data 202
from the Pléiades constellation, composed of two optical Earth-imaging satellites, which provide 203
very-high-resolution images with multi-stereoscopic potential along the same orbit due to their 204
rapid pointing agility (Bernard et al., 2012). In a sparse vegetation setting such as that of the 205
Meknès and Fès region, Pléiades images are a cost-effective alternative to airborne LiDAR to 206
produce high-resolution DSMs of large areas (e.g., Ansberque et al., 2016). 207
208
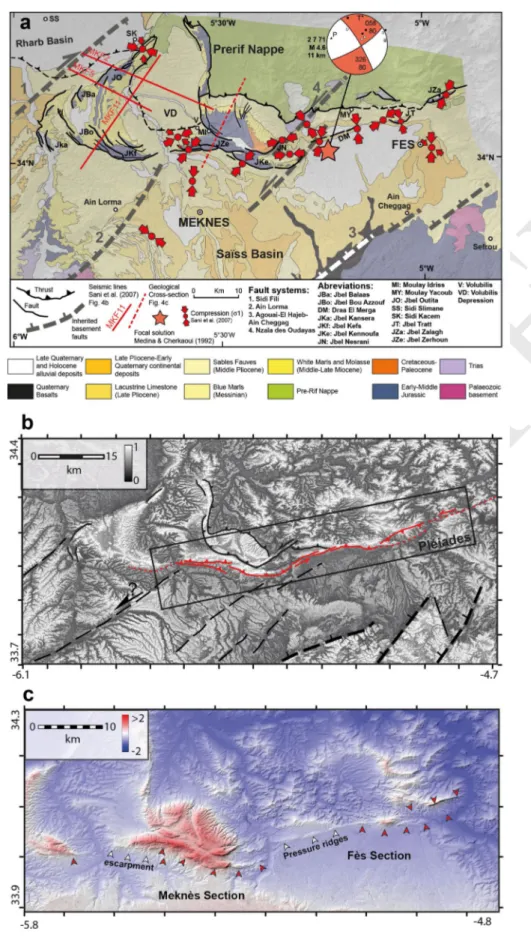
Figure 3. (a) Structural and
geological sketch map of the
Pre-Rif Ridge at the front of the Pre-Rif Nappe along the northern border of the Saïss Basin (modified after Sani et al., 2007). Red arrows show direction of shortening (after Sani et al., 2007). Solid and dotted red lines locate the seismic lines and geological cross-section depicted in Fig. 4b and Fig. 4c, respectively. Focal
mechanism is after Medina & Cherkaoui (1992); (b) Map of the multiscale elevation residual index (MERI) derived from ALOSW3D DSM. The prominent tectonic features running along the major relief change are depicted in red. Dashed, solid lines indicate possible surface effect of reactivated
basement normal faults. The black open rectangle shows the outlay of the Pleiades images used to survey the fault; (c) Map of the deviation from mean elevation (DEV) derived from ALOSW3D DSM. Red arrows indicate prominent geomorphic features running along the major relief change and possibly associated with recent, active tectonic deformation.
209
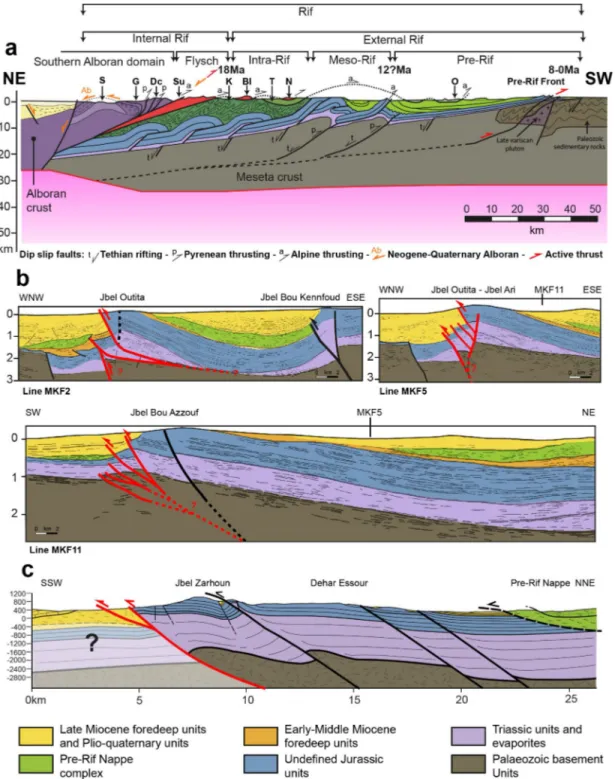
Figure 4. (a) Crustal-scale geological cross section extracted from TRANSMED-Transect I, depicting the main 210
structures and units between the Alboran Sea and the western Moroccan Meseta (modified after Frizon de
211
Lamotte et al., 2004). Keys: S, Sebtide; G, Ghomaride; Dc, Dorsale calcaire; Su, Suture of the Maghrebian
212
Tethys; K, Ketama Unit; T, Tanger Unit; BI/N, Beni Ider and Numidian nappes; O, Ouezzane Unit. Numbers
213
indicate age of thrusting; (b) Structural interpretation of seismic lines (modified after Sani et al., 2007) with
214
tentative re-interpretation showing active faults marked in red. Vertical scales in two-way time seconds; (c)
215
Schematic geological cross-section of Jbel Zerhoun after the 1/50000 geological maps of Sidi Kacem (Bendkik
216
et al., 2004) and Beni Ammar (Chenakeb et al., 2004), as well as the stratigraphic logs published in Sani et al.
217
(2007).
To encompass the fault system running along the southern front of the Pre-Rif Nappe, we 219
specifically acquired 5 Pléiades stereo-couples along a transect centering the fault zone and 220
covering a total area of 3142 km2, with a swath width of 20 km (Fig. 2). The dataset is composed 221
of Pléiades 1B and 1A panchromatic scenes with a resolution of 70 cm, but resampled at a ground 222
sampling distance of 50 cm. The stereoscopic images were then processed to produce a DSM using 223
MicMac photogrammetry open-source software from the French Institut Géographique National 224
(Rupnik et al., 2018), and the following workflow pipeline: (1) Satellite images being generated 225
from pushbroom sensors, the geometric model is delivered as Rational Polynomial Coefficients, 226
which is an approximation and needs to be refined; (2) Calculation of the key points on each image 227
with Sift algorithm on sub-sampled images at 5000 pixels width; (3) The refinement of the 228
orientation is performed with polynomial correction functions estimated from bundle block 229
adjustments of the tie points. Ground control points were not used at this step as none were 230
available, yielding an average residual of about 0.5 pixels (and leading to an elevation uncertainty 231
of about 2 m, e.g. Panagiotakis et al., 2018); (4) The 3D reconstruction was then done from semi-232
global multi-view stereo algorithm, pixel to pixel matching from cross-correlation with a moving 233
window of 5x5 pixels size. A threshold of 0.2 for minimum correlation was used to avoid low 234
signal/noise ratio. (5) Finally, the resulting Digital Elevation Model (DEM) was smoothed using a 235
Gaussian filter of 4x4 pixels size. The series of Pléiades images as well as the resulting DEM are 236
shown, together with the structural interpretation, in figure 5. 237
3.3 Placing time constraints using cosmogenic dating 238
In this study, in situ-produced 10Be, 26Al and 36Cl (e.g., Gosse & Philips, 2001; Dunai, 2010) were 239
used to set temporal constraints for the landscape evolution associated with the tectonic activity. 240
In morphochronology, these cosmogenic nuclides are now routinely used as chronometers to 241
extend the time window of fault slip rate estimates obtained by dating landscape features affected 242
by active tectonics. In dating alluvial landforms using cosmogenic nuclides, surface sampling 243
and/or depth profile approaches are two possible options that can be conducted separately or in 244
combination. However, to successfully date alluvial landforms with profiles, the samples must be 245
collected between the surface and a minimum depth of 5 m (e.g., Braucher et al., 2009; Siame et 246
al., 2012). Otherwise, the cosmogenic concentrations are likely to be dominated by the spallogenic 247
(neutrons) component, which is more sensitive to surface processes than the muonic component at 248
depth. In the studied region, Quaternary alluvial deposits are composed of carbonated clasts and 249
are typically less than 3 m-thick. In such conditions, surface sampling was required. In situ-250
produced 36Cl concentrations were measured in surface mudstone cobbles and carbonated 251
sandstone cobbles originating from the Jurassic calcareous formations cropping out in the Pre-Rif 252
Ridges and the Miocene Pre-Rif Nappe, respectively (Suter, 1980). In situ-produced 10Be and 26Al 253
concentrations were measured in the quartz isolated from carbonated sandstone cobbles. Prior to 254
chemical procedures, all the samples were crushed and sieved to fractions ranging from 250 and 255
1000 !m. 256
Preparation of in situ-produced 36Cl targets for Accelerator Mass Spectrometry (AMS) 257
measurements consists of two hours of water-leaching, followed by a 10%-dissolution using HNO3 258
(2 mol.l-1), and a total dissolution in HNO3 after addition of 2 mg of a 35Cl-enriched carrier 259
(35Cl/37Cl=918), allowing for simultaneous natural chlorine determination by isotope dilution 260
AMS. For the sandstone cobbles, quartz grains were then recovered from the solution for further 261
10Be and 26Al procedures. After taking an aliquot for Ca-determination by Inductively Coupled 262
Plasma-Optical Emission Spectrometry, 1 ml of an AgNO3 solution (10%) was added to the 263
dissolved sample to precipitate AgCl. To reduce isobaric interference by 36S during AMS 264
measurements, the AgCl precipitate was re-dissolved using diluted NH4OH, and sulphur was co-265
precipitated with BaCO3 to form BaSO4 by addition of an ammoniac saturated Ba(NO3)2 solution. 266
The solution was filtered (acrodisc 0.45 !m filter) and then AgCl was re-precipitated with diluted 267
HNO3, washed with water and then dried at 80°C. AMS measurements were performed at the 268
French AMS Facility, ASTER, located at CEREGE in Aix-en-Provence (Arnold et al., 2010). Both 269
the 36Cl/35Cl and the 35Cl/37Cl ratios were obtained by normalization to an in-house standard (SM-270
CL-12) with an assigned 36Cl/35Cl value of (1.428±0.021)x10-12 (Merchel et al., 2011; Braucher et 271
al., 2018), and a natural 35Cl/37Cl ratio of 3.217. 272
For in situ-produced 10Be and 26Al, preparation of targets for AMS measurements followed 273
chemical procedures adapted from Brown et al. (1991) and Merchel and Herpers (1999). 274
Decontamination from atmospheric 10Be of the quartz grains included in the carbonated sandstone 275
cobbles was achieved by a series of three successive leachings in concentrated HF; each leaching 276
removing 10% of the remaining sample mass. Cleaned quartz was then totally digested in 277
concentrated HF, after addition of 100 !g of an in-house carrier at (3.025±9)x10-3 g/g of 9Be, 278
originating from a deep-mined phenakite (Merchel et al., 2008). Hydrofluoric and perchloric 279
280
Figure 5. Map of fault
traces overlying (a) the mosaic of Pléiades panchromatic scenes specifically acquired in the Fès-Meknès region along the southern Rif deformation front, and (b) the digital surface model (DSM) with 1 m pixel resolution
derived from
stereoscopic pairs, and showing the main fault segments; (c) 3D bird views extracted from the Pléiades-derived DSM at three specific
sites : 1, the Zbidat segment; 2, the El Merga segment; and 3, the termination of the Fès segment, with the Jbel Zalagh pressure ridge. 1 and 2 also
locate the sites where
the cosmogenic
exposure technique has been applied at Zbidat and Ain El Hammam.
fuming was used to remove fluorides and both cation and anion exchange chromatography to 281
finally isolate Be and Al. Prior to 10Be and 26Al AMS measurements at ASTER, beryllium and 282
aluminium oxides were mixed to 325-mesh niobium and silver powders, respectively. The 10Be 283
measurements were calibrated against the in-house STD-11 standard 284
(10Be/9Be=(1.191±0.013)x10-11; Braucher, 2015). Isotopic 26Al/27Al ratios were measured against 285
the in-house standard SM-Al-11, the 26Al/27Al value of which (7.401±0.064)x10-12 has been cross-286
calibrated against primary standards from a round-robin exercice (Merchel & Bremser, 2004). 287
Reported analytical uncertainties (1") include uncertainties in AMS counting statistics, variation 288
of isotopic ratios of standards during the runs, and external AMS uncertainties (Arnold et al., 2010; 289
Braucher et al., 2018). The 36Cl exposure ages were calculated using the Excel® sheet provided 290
by Schimmelpfenning et al. (2009), and a 36Cl sea-level high latitude production rate of 291
42.2±2.0 atoms 36Cl (g-Ca)/yr (Braucher et al., 2011). Exposure ages from 10Be and 26Al 292
concentrations were calculated using a 10Be sea-level high latitude production rate of 4.01±0.33 293
atoms 10Be (g-SiO2)/yr (Borchers et al., 2016), and half-lives of (1.387±0.012)x106 years 294
(Korschinek et al., 2009; Chmeleff et al., 2009) and (0.705±0.024)x106 years (Nishiizumi et al., 295
2004, 2007), respectively. For all cosmogenic nuclides, exposure ages were calculated using the 296
time-independent scaling functions for high-energy neutrons of Stone (2000), with an attenuation 297
length of 160 g/cm2, and those of Braucher et al. (2011) for muons. A bulk rock density of 298
2.5 g/cm3 was assumed for all samples. With negligible topographic shielding, all minimum 299
exposure ages were calculated with the “zero erosion” assumption (e.g., Lal, 1991). 300
4 Appraisal of tectonic activity along the Pre-Rif Ridges 301
4.1 Regional characteristics of the Pre-Rif deformation front 302
The boundary between the Pre-Rif Ridges and the Saïss Basin has long been investigated through 303
geological (Choubert & Faure-Muret, 1962; Faugères, 1978; Morel 1988, 1989), structural 304
(Bargach et al., 2004; Frizon de Lamotte et al., 2004; Moratti et al., 2003; Sani et al., 2007), and 305
geodetic (Chalouan et al., 2014; Poujol et al., 2017) approaches. The Pre-Rif Ridges correspond 306
to elongated hills of Mesozoic sedimentary rocks that belong to the Meseta-Atlas cover of the 307
foreland involved in the Late Miocene to Middle Pliocene thrusting of the external Rif (Faugères, 308
1978; Zizi, 1996). 309
To the west of the Volubilis Depression (Fig. 3), the external Pre-Rif Ridges (Jbel Bou Draa, 310
Outita, Balaas, Kansera, Bou Azzouf, Kefs) form a westward convex, arched-like morphology 311
marking the limit with the Rharb Basin (Bargach et al., 2004), which is probably limited at depth 312
by the NE-striking Sidi Fili fault system (e.g., Sani et al., 2007). To the east of the Volubilis 313
Depression, the internal Pre-Rif Ridges (Jbel Tselfat, Bou Kannfoud, Zerhoun, Kennoufa, Nesrani) 314
form another though wider southward convex, arched-like morphology (Bargach et al., 2004). 315
Further east, along the Pre-Rif deformation front, two insulated ridges (Jbel Tratt and Zalagh) stand 316
on both sides of Fès City (Fig. 3). 317
The ridges are made of a sedimentary sequence that starts with Triassic evaporites and red clays 318
overlain by a relatively thick Jurassic series of dolomite and limestone, and locally by a marly 319
Cretaceous formation in the eastern ridges (Bargach et al., 2004). The Mesozoic cover is 320
unconformably overlain by Lower and Middle Miocene marls as well as Middle-Upper Miocene 321
sandstones (Fig. 3 & 4). From a structural point of view, these deposits generally correspond to 322
SW- and S-verging anticlines associated with the thrusting of the Pre-Rif Nappe, and deforming 323
the Rharb and Saïss Neogene basins, respectively (Fig. 3 & 4). 324
At a regional scale, the morphology associated with the Pre-Rif Ridges is particularly highlighted 325
by the MERI and DEV maps derived from the ALOSW3D digital surface model (Fig. 3). The 326
DEV map brings out the major geomorphic features associated with the activity of the faults (fault 327
traces, topographic escarpments, en-échellon pressure ridges…). The MERI map allows mapping 328
the fault geometry and broadly defining the segmentation of the Pre-Rif deformation front into two 329
Meknès and Fès sections. At a first order, this segmentation appears controlled by the interaction 330
between the Pre-Rif thrusts and the NE-striking basement faults below the Mesozoic cover 331
(Fig. 3). The Sidi Fili fault system delimits the Khemisset Basin to the northwest (Fig. 3 and 332
Fig. 4). The Ain Lorma fault system marks the southeastern shoulder of the Khemisset Basin, and 333
marks the limit between the external and internal Pre-Rif Ridges (e.g., Suter, 1980). According to 334
the seismic lines interpreted by Sani et al. (2007), the Ain Lorma fault system does not affects the 335
sedimentary deposits overlying the basal part of the Neogene sediment. Nevertheless, the NE-SW 336
linear pattern in the Saïss Basin morphology, evidenced by the MERI map, might well be an 337
evidence of some structural control within the most recent deposits (Fig. 3). The Nzala des 338
Oudayas fault system delimits the internal Pre-Rif Ridges to the east of Jbel Kennoufa and Jbel 339
This fault system is evidenced by an alignment of Triassic evaporites, and the curvature of the Pre-341
Rif Nappe front in this area (Fig. 3). It also corresponds to the direction of a series of en-échellon 342
pressure ridges, aligned along the Draa El Merga (e.g., Poujol et al., 2017), that are well identified 343
on the DEV map (Fig. 3). All these basement faults are clearly imaged on the seismic profiles 344
published by Sani et al. (2007), and characterized by both a sudden increase of the Mesozoic 345
sediment thickness and a basement involvement in the deformation (Fig. 4). 346
Although the Pre-Rif Ridges probably started to develop in the Early Miocene, the most active 347
phase of compression occurred during the Pliocene, with a direction of maximum compression 348
oriented roughly N-S to NE-SW (Fig. 3), and a reactivation of the earlier basement, normal faults 349
delimiting the Mesozoic grabens as strike-slip faults (Bargach et al., 2004; Sani et al., 2007). Using 350
GPS measurements and block models (Fadil et al., 2006; Vernant et al., 2010; Koulali et al., 2011), 351
Poujol et al. (2017) estimated that the Pre-Rif front should accommodate a shortening and a left-352
lateral motion at rates of about 4 and 2 mm/yr, respectively. Chalouan et al. (2014) also suggested 353
that this convergence should be accommodated by ENE-striking, northward-dipping reverse and 354
left-lateral faults, as well as south-verging folds. Along the Pre-Rif front, the only focal mechanism 355
solution available is that of a M 4.6 earthquake, which was recorded on July, 2nd 1971, close to 356
Moulay Yacob (Fig. 3). Felt with an intensity of V (MSK), the focal solution depicts left-lateral 357
and right-lateral displacements along N326- and N58-striking planes, respectively (Medina & 358
Cherkaoui, 1992). This is exactly the opposite of what would be expected given the geometry of 359
the faults, and the pattern of maximum compression (Fig. 3). This contradiction is probably due to 360
the lack of data in the south and west quadrants (Medina & Cherkaoui, 1992). Even if the focal 361
depth of 11 km-deep estimated for this seismic event may be somewhat erroroneous, it is worth 362
noting that it is compatible with a slip in the basement and not in the Mesozoic sedimentary cover. 363
4.2 Segmentation of the Pre-Rif deformation front 364
Geomorphic and structural analyses were carried out along the Pre-Rif Ridges within the region 365
of Meknès and Fès through a detailed mapping of geomorphic markers, using the DSM extracted 366
from the Pléiades stereoscopic scenes and field surveys. Mapping of the geomorphic indicators 367
enabled us to identify and connect several fault segments along the whole fault system, from the 368
westernmost tip of Jbel Zerhoun to Aïn Kansera Plateau to the east (Fig. 5). This analysis also 369
permitted us to locate two specific sites of detailed morphochronological investigations (see 4.3) 370
at the toe of Jbel Zerhoun, along the Meknès Section, and to the northeast of Fès City, in the 371
pressure-ridge of Jbel Zalagh (Fig. 5). 372
At the toe of Jbel Zerhoun and Jbel Kennoufa, the Pléiades-derived DSM confirms the clear trace 373
of the underlying thrust through the morphology, materialized by two ENE-striking segments of 374
17 and 18 km-long, respectively (Fig. 5). To the west of Jbel Zerhoun, the fault trace is not visible, 375
probably limited at depth by the Aïn Lorma basement fault system. To the east of Jbel Kennoufa, 376
the fault trace runs in the Plio-Quaternary sediments, and curves into a more NE-striking direction, 377
parallel to the structural direction of the Nzala des Oudayas basement fault system (Fig. 5). 378
Beside these two thrust segments, another geomorphic evidence of recent fault activity is a 379
topographic escarpment located to the south of Jbel Zerhoun and north of Rdoum River (Fig. 5). 380
In this area, the surface of the Holo-Pleistocene alluvial plain that skirts the toe of the ridge is 381
warped, and exhibits a cumulated topographic escarpment up to 38 m-high (Fig. 6). This 382
topographic feature is suggested in the morphology by a series of aligned, renewed gullies 383
generated by backward erosion, strongly suggesting a recent uplift activity (Fig. 6). This 14 km-384
long topographic escarpment can be morphologically traced from the eastern tip of Jbel Zerhoun, 385
although subdued features on the DSM may suggest that it continues up to the eastern tip of the 386
Jbel Kefs, which would extend its length to a maximum of 18 km (Fig. 5). Further east, the 387
topographic escarpment fades away, and the DSM does not exhibit clear features beside a few 388
linear traces, limited in length, and without direct connection to the Zbidat escarpment (Fig. 5). 389
Based on this morphotectonic analysis, the Pre-Rif front along the Meknès Section can thus be 390
divided into three main reverse segments: Zerhoun (17 km) and Kennoufa (18 km), running at the 391
toe of the carbonated relief, and Zbidat (14-18.5 km), which is marked by the prominent, 38 m-392
high topographic escarpment warping the more recent alluvial deposits (Fig. 5). 393
To the east of Jbel Kennoufa, the Fès Section is connected to the Meknès Section by the NE-SW 394
trending, ≈22 km-long, the El Merga strike-slip segment that parallels the trend of the Nzala des 395
Oudayas basement fault system and connects to a series of aligned, en échellon elongated hills 396
(Fig. 5). As already indicated by Poujol et al. (2017), this series of low hills are composed of Plio-397
Quaternary sediments and associated with laterally offset streams. To the east, this segment 398
connects to the front of the Pre-Rif Nappe, resulting in the maximum 24.4 km-long reverse Tratt 399
segment that runs along the piedmont of the main relief, north of Fès City, to the southern slopes 400
of the Jbel Zalagh. To the east, the subdued fault trace running through the southern hillslopes of 401
Jbel Zalagh does not seem to cross the Sebou River (Fig. 5). 402
Conversely, the northern slopes of the Jbel Zalagh are affected by a clearer, linear, left-lateral and 403
reverse fault trace (e.g., Poujol et al., 2017), suggesting that relief surrounding Jbel Zalagh might 404
well be interpreted as a restraining ridge between the Tratt segment and the continuation of the 405
Pre-Rif front further east (Fig. 5). Along the Fès section, the Pre-Rif front is thus mainly composed 406
of the left-lateral El Merga (22 km) and reverse Tratt (24 km) segments, making this portion of the 407
front a zone of relatively more localized deformation than the Meknès Section. 408
4.3 Temporal constraints on geomorphic evolution at the site scale 409
Along the Meknès and Fès sections (Fig. 5), two sites were selected to apply a 410
morphochronological approach using in situ-produced cosmogenic nuclides. In Zbidat, the target 411
morphology corresponds to a Quaternary alluvial surface sitting atop of the 38-m high escarpment 412
running at the toe of the Jbel Zerhoun (Fig. 6). Dating the abandonment period of this surface 413
contrains the incision rates of the intermittent rivers running across the escarpment, and thus gives 414
a proxy for the local uplift rate associated with the Zbidat segment. In Aïn Al Hamamat, the target 415
morphology corresponds to a series of stepped fluvial terraces that were abandoned by the Sebou 416
River during uplift in the area of the Jbel Zalagh pressure-ridge (Fig. 7). Dating the abandonment 417
periods of these fluvial terraces constrains incision rates for the Sebou River, where it crosses the 418
front of the Pre-Rif Nappe, and gives a proxy for the regional uplift rate associated with the 419
deformation front. 420
In both sites, the geomorphic surfaces are slightly affected by traditional non-mechanical 421
agriculture, with a maximum ploughing depth of 30 cm. They are also poor in large, stable surface 422
boulders that are less prone to post-depositional disturbances. Due to this lack of boulders, surface 423
sampling was thus limited to cobbles or large pebbles exceeding 10 cm in diameter. In Zbidat, the 424
surface sampling consisted of three calcareous cobbles and two small boulders that have been 425
chiseled in their topmost part. In Aïn Al Hamamat, the surface sampling consisted of 19 cobbles 426
and pebbles of carbonate or carbonated sandstone (Table 1). 427
428
Figure 6. (a) Extract of the Pléiades-derived DSM centered on the Meknès Section and showing the Zbidat 429
escarpment as well as the Zerhoun segment; (b) Localization of the surface samples for cosmic ray exposure
430
dating (Tables 2 & 3); (c) Field photographs of selected samples in their original positions; (d) Field photograph
431
looking eastwardly, showing the topographic escarpment at Zbidat; (e) Topographic cross-section (surface and
432
stream bed) across the escarpment up to the Zerhoun segment, extracted from the Pléiades-derived DSM. The
433
inset shows the upstream incision and escarpment height of 14±1 m and 38±1 m, respectively; (f) Cosmogenic
434
exposure dating (36Cl) shown as probability distribution curves and !2-test peak ages (Table 4); (g) Probability
435
distribution of abandonment age calculated using the MATLAB tool provided by D’Arcy et al. (2019) over a
436 437
438
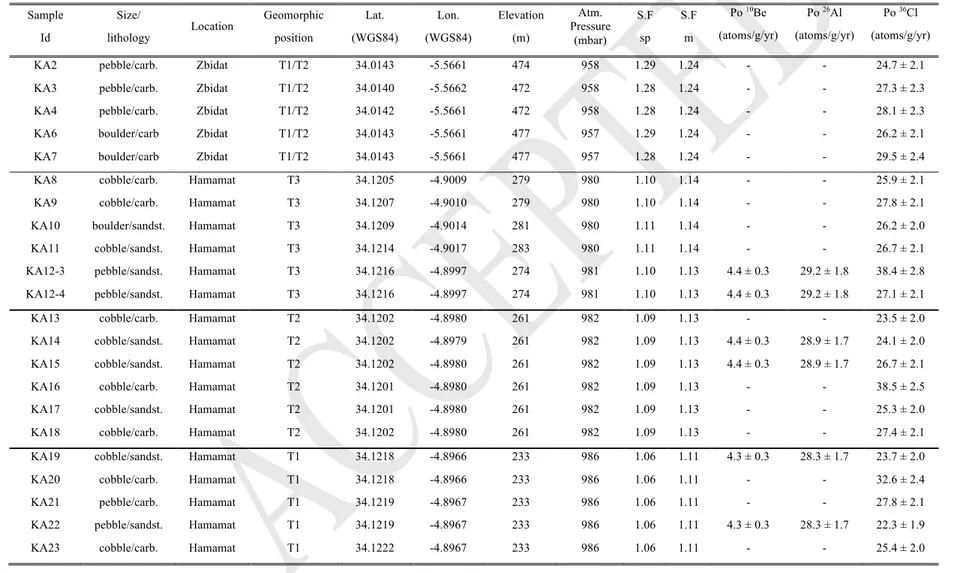
Table 1. List of carbonate (carb.) and stanstone (sandst.) surface samples for cosmic ray exposure dating. Scaling factors (S.F.) for 439
spallogenic (sp) and muonic (m) contributions are calculated after Stone (2000) and Braucher et al. (2011), respectively. 440 Sample Id Size/ lithology Location Geomorphic position Lat. (WGS84) Lon. (WGS84) Elevation (m) Atm. Pressure (mbar) S.F sp S.F m Po 10Be (atoms/g/yr) Po 26Al (atoms/g/yr) Po 36Cl (atoms/g/yr) KA2 pebble/carb. Zbidat T1/T2 34.0143 -5.5661 474 958 1.29 1.24 - - 24.7 ± 2.1 KA3 pebble/carb. Zbidat T1/T2 34.0140 -5.5662 472 958 1.28 1.24 - - 27.3 ± 2.3 KA4 pebble/carb. Zbidat T1/T2 34.0142 -5.5661 472 958 1.28 1.24 - - 28.1 ± 2.3 KA6 boulder/carb Zbidat T1/T2 34.0143 -5.5661 477 957 1.29 1.24 - - 26.2 ± 2.1 KA7 boulder/carb Zbidat T1/T2 34.0143 -5.5661 477 957 1.28 1.24 - - 29.5 ± 2.4
KA8 cobble/carb. Hamamat T3 34.1205 -4.9009 279 980 1.10 1.14 - - 25.9 ± 2.1
KA9 cobble/carb. Hamamat T3 34.1207 -4.9010 279 980 1.10 1.14 - - 27.8 ± 2.1
KA10 boulder/sandst. Hamamat T3 34.1209 -4.9014 281 980 1.11 1.14 - - 26.2 ± 2.0 KA11 cobble/sandst. Hamamat T3 34.1214 -4.9017 283 980 1.11 1.14 - - 26.7 ± 2.1 KA12-3 pebble/sandst. Hamamat T3 34.1216 -4.8997 274 981 1.10 1.13 4.4 ± 0.3 29.2 ± 1.8 38.4 ± 2.8 KA12-4 pebble/sandst. Hamamat T3 34.1216 -4.8997 274 981 1.10 1.13 4.4 ± 0.3 29.2 ± 1.8 27.1 ± 2.1 KA13 cobble/carb. Hamamat T2 34.1202 -4.8980 261 982 1.09 1.13 - - 23.5 ± 2.0 KA14 cobble/sandst. Hamamat T2 34.1202 -4.8979 261 982 1.09 1.13 4.4 ± 0.3 28.9 ± 1.7 24.1 ± 2.0 KA15 cobble/sandst. Hamamat T2 34.1202 -4.8980 261 982 1.09 1.13 4.4 ± 0.3 28.9 ± 1.7 26.7 ± 2.1 KA16 cobble/carb. Hamamat T2 34.1201 -4.8980 261 982 1.09 1.13 - - 38.5 ± 2.5 KA17 cobble/sandst. Hamamat T2 34.1201 -4.8980 261 982 1.09 1.13 - - 25.3 ± 2.0 KA18 cobble/carb. Hamamat T2 34.1202 -4.8980 261 982 1.09 1.13 - - 27.4 ± 2.1 KA19 cobble/sandst. Hamamat T1 34.1218 -4.8966 233 986 1.06 1.11 4.3 ± 0.3 28.3 ± 1.7 23.7 ± 2.0 KA20 cobble/carb. Hamamat T1 34.1218 -4.8966 233 986 1.06 1.11 - - 32.6 ± 2.4 KA21 pebble/carb. Hamamat T1 34.1219 -4.8967 233 986 1.06 1.11 - - 27.8 ± 2.1 KA22 pebble/sandst. Hamamat T1 34.1219 -4.8967 233 986 1.06 1.11 4.3 ± 0.3 28.3 ± 1.7 22.3 ± 1.9 KA23 cobble/carb. Hamamat T1 34.1222 -4.8967 233 986 1.06 1.11 - - 25.4 ± 2.0 441
Table 2. In situ-produced 36Cl concentrations and associated minimum cosmic ray exposure ages at Zbidat and Aïn El Hamamat. 442
443
Note: Samples KA2 to KA7 were processed together with a blank sample yielding a 36Cl/35Cl ratio of (3.63 ± 0.94)x10-15.
444
The others were processed with another blank sample yielding a 36Cl/35Cl ratio of (2.65 ± 0.89)x10-15.
445 Sample Id Location Geomorphic position Mass of dissolved rock (g) Cl (ppm) Ca (wt%) Mg (wt%) 36Cl/35Cl (x10-13) [36Cl] (x106 atoms/g) Min. 36Cl age (yr) Max. 36Cl denudation rate (m/Myr) KA2 Zbidat T1/T2 65.97 68.7 34.0 0.6 9.10 ± 0.39 1.292 ± 0.067 55 615±5 796 - KA3 Zbidat T1/T2 78.76 9.4 54.4 0.0 13.36 ± 0.59 0.759 ± 0.034 28 801 ± 2 843 - KA4 Zbidat T1/T2 70.77 21.9 54.1 0.0 5.93 ± 0.26 0.461 ± 0.021 16 758 ± 1 605 - KA6 Zbidat T1/T2 72.30 76.1 36.4 0.5 7.02 ± 0.31 1.027 ± 0.058 41 036 ± 4 232 - KA7 Zbidat T1/T2 69.73 35.1 55.3 0.0 6.26 ± 0.27 0.597 ± 0.028 20 732 ± 1 978 - KA8 Hamamat T3 59.85 55.4 51.7 0.0 3.93 ± 0.18 0.511 ± 0.032 20 236 ± 2 117 77.2 ± 6.7 KA9 Hamamat T3 58.60 176.4 29.4 0.6 1.72 ± 0.11 0.493 0.058 18 089 ± 2 608 86.6 ± 11.5 KA10 Hamamat T3 70.41 128.2 35.3 0.5 0.54 ± 0.07 0.114 ± 0.021 4 375 ± 892 363.8 ± 71.6 KA11 Hamamat T3 72.48 131.4 36.3 0.4 1.02 ± 0.08 0.221 ± 0.029 8 328 ± 1 294 190.3 ± 27.8 KA12-3 Hamamat T3 27.62 334.3 28.8 0.3 2.75 ± 0.16 1.530 ± 0.177 41 743 ± 6 029 36.5 ± 4.8 KA12-4 Hamamat T3 41.18 73.8 51.9 0.0 6.01 ± 0.31 1.083 ± 0.066 42 005 ± 4 392 36.3 ± 3.1 KA13 Hamamat T2 77.06 24.4 51.5 0.0 14.57 ± 0.69 1.125 ± 0.063 50 695 ± 5 458 - KA14 Hamamat T2 38.46 33.4 51.3 0.0 9.27 ± 0.40 1.243 ± 0.059 54 892 ± 5 612 - KA15 Hamamat T2 27.33 78.4 50.6 0.0 4.81 ± 0.25 1.101 ± 0.062 43 653 ± 4 399 - KA16 Hamamat T2 61.03 345.7 28.6 0.6 3.19 ± 0.18 1.603 ± 0.361 43653 ± 10 877 - KA17 Hamamat T2 56.98 53.8 51.3 0.0 5.54 ± 0.26 0.724 ± 0.042 29 583 ± 3 056 - KA18 Hamamat T2 62.98 181.7 28.6 0.6 3.82 ± 0.20 1.105 ± 0.150 42 175 ± 6 911 - KA19 Hamamat T1 18.04 39.4 50.2 0.0 3.70 ± 0.19 0.908 ± 0.048 40 154 ± 4 155 - KA20 Hamamat T1 62.03 268.5 28.3 0.6 2.60 ± 0.15 1.042 ± 0.206 33 205 ± 7 306 - KA21 Hamamat T1 64.19 197.1 28.4 0.6 1.91 ± 0.12 0.586 ± 0.101 21 559 ± 4 180 - KA22 Hamamat T1 34.15 33.3 46.9 0.1 9.56 ± 0.42 1.392 ± 0.065 67 329 ± 7 100 - KA23 Hamamat T1 62.98 158.9 28.8 0.6 3.59 ± 0.19 0.933 ± 0.111 38 316 ± 5 725 -
446 447 448
Table 3. In situ-produced 10Be and 26Al concentrations and associated minimum cosmic ray exposure ages at Aïn El Hamamat. 449
Exposure ages are calculated neglecting muonic contribution at the surface as it accounts for less than 3% of the total production. 450 Sample Id Mass of quartz (g) Mass of spike 9Be (g)* 26Al/27Al
(x10-13) [26Al] (x106 atoms/g) Min. 26Al age (yr) 10Be/9Be (x10-13) [
10Be] (x106
atoms/g) Min. 10Be age (yr) 26Al/10Be KA12-3 /T3 27.19 0.1511 15.05 ± 0.5 4.098 ± 0.144 150 732 ± 10 483 6.24 ± 0.25 0.698 ± 0.029 164 407 ± 11 950 5.9 ± 0.3 KA12-4 / T3 20.07 0.1523 2.05 ± 0.15 1.488 ± 0.111 52 183 ± 4 987 2.61 ± 0.11 0.396 ± 0.017 91 574 ± 6 725 3.8 ± 0.3 KA14 / T2 13.34 0.1519 8.53 ± 0.47 1.872 ± 0.100 66 829 ± 5 358 1.60 ± 0.08 0.362 ± 0.018 84 473 ± 6 604 5.2 ± 0.4 KA15 / T2 26.55 0.1539 3.75 ± 0.22 1.080 ± 0.063 38 012 ± 3 189 1.63 ± 0.07 0.188 ± 0.008 43 481 ± 3 200 5.7 ± 0.4 KA19 / T1 26.12 0.1525 3.25 ± 0.22 0.982 ± 0.066 35 337 ± 3 178 1.43 ± 0.07 0.166 ± 0.009 39 186 ± 3 111 5.9 ± 0.5 KA22 / T1 7.22 0.1530 5.92 ± 0.30 4.333 ± 0.224 166 103 ± 13 146 2.29 ± 0.11 0.964 ± 0.046 239 061 ± 18 300 4.5 ± 0.3 Blank - 0.1530 <2.76x10⁻¹⁵ - - (2.37 ± 0.32)x10-15 - - -
Note: 10Be and 26Al were performed at ASTER AMS facility (Aix-en-Provence, France). BeO machine blank 10Be/9Be ratio is 3.55 x10⁻¹⁶. Al 2O3
451
machine blank 26Al/27Al ratio is 2.95x10⁻¹⁵. * in-house carrier at (3.025±9)x10-3 g/g of 9Be; No 27Al spike was added.
452 453 454
For the two sampled sites, the measured in situ-produced cosmogenic 36Cl concentrations yield a 455
rather well-distributed dataset of minimum exposure ages (Table 2 & 3). In addition, some samples 456
are characterized by a high content in 35Cl (above 100 ppm), which could represent a significant 457
source of uncertainty because of the poorly constrained fluxes of thermal and epithermal neutrons 458
that produce 36Cl through neutron capture (Schimmelpfenning et al., 2009; Delunel et al., 2014). 459
The exposure ages determined for these high 35Cl samples might be overestimated and should be 460
regarded with caution (e.g., Moulin et al., 2016; Rizza et al., 2019). To help improve the 461
interpretation, probability density plots were derived using DensityPlotter, a java application 462
originally designed to interpret populations of single grains from fission track or luminescence 463
dating (Vermeesch, 2012). For each group of cosmogenic exposure ages, a !2-test was employed 464
to determine whether their distribution is statistically homogeneous (Table 4). This procedure also 465
determines if the age populations contain more than one mode, yielding in this case mixture age 466
models accounting for both analytical and statistical dispersion (Galbraith & Green, 1990). 467
For the samples collected on the alluvial surface hanging above the Zbidat escarpment, 36Cl 468
concentrations are ranging from (0.46±0.02)x106 to (1.29±0.07)x106 atoms.g-1, with relatively low 469
natural chlorine concentrations (Table 2). These 36Cl concentrations yield minimum exposure ages 470
comprised between 16.8±1.6 and 55.6±5.8 ka (Table 2). For these age population, the probability 471
distribution curve is positively-skewed toward older exposure ages (Fig. 6), with two principal 472
peaks centred at 21.4±1.2 and 47.7±3.5 ka, and a central value at 29.6±5.8 ka with 43% of 473
dispersion (Table 4). 474
In Aïn Al Hamamat, measured 36Cl concentrations range from (0.11±0.02)x106 to (1.39 475
±0.07)x106 atoms.g-1, yielding minimum cosmogenic exposure ages comprised between 4.4±0.9 476
and 67.3±7.1 ka (Table 2). For each alluvial surface, a couple of carbonated sandstones also 477
enabled measurements of in situ-produced cosmogenic 10Be and 26Al concentrations (Table 3). In 478
these peculiar samples, 10Be and 26Al concentrations ranged from (0.17±0.01)x106 to 479
(0.96±0.05)x106 atoms.g-1, respectively (Table 3). These 10Be and 26Al concentrations yield 480
minimum exposure ages comprised between 35.3±3.2 and 239.1±18.3 ka (Table 3). For the three 481
alluvial surfaces, the age distribution patterns indicate that minimum exposure ages derived from 482
10Be and 26Al concentrations are generally older than those derived from 36Cl concentrations 483
(Tables 2 and 3). 484
485 486 487
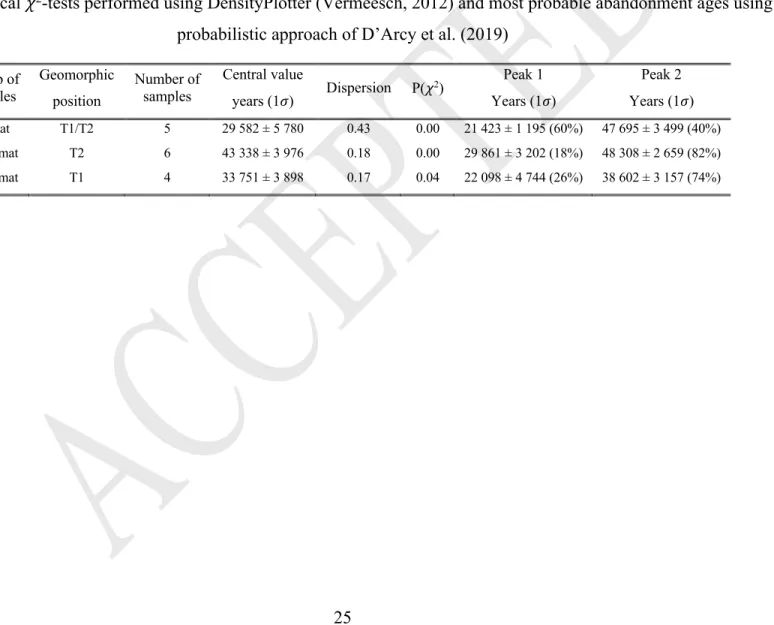
Table 4. Statistical !2-tests performed using DensityPlotter (Vermeesch, 2012) and most probable abandonment ages using the 488
probabilistic approach of D’Arcy et al. (2019) 489 Group of samples Geomorphic position Number of samples Central value years (1!) Dispersion P(" 2) Peak 1 Years (1!) Peak 2 Years (1!) Zbidat T1/T2 5 29 582 ± 5 780 0.43 0.00 21 423 ± 1 195 (60%) 47 695 ± 3 499 (40%) Hamamat T2 6 43 338 ± 3 976 0.18 0.00 29 861 ± 3 202 (18%) 48 308 ± 2 659 (82%) Hamamat T1 4 33 751 ± 3 898 0.17 0.04 22 098 ± 4 744 (26%) 38 602 ± 3 157 (74%) 490 491 492
493 494
495 496
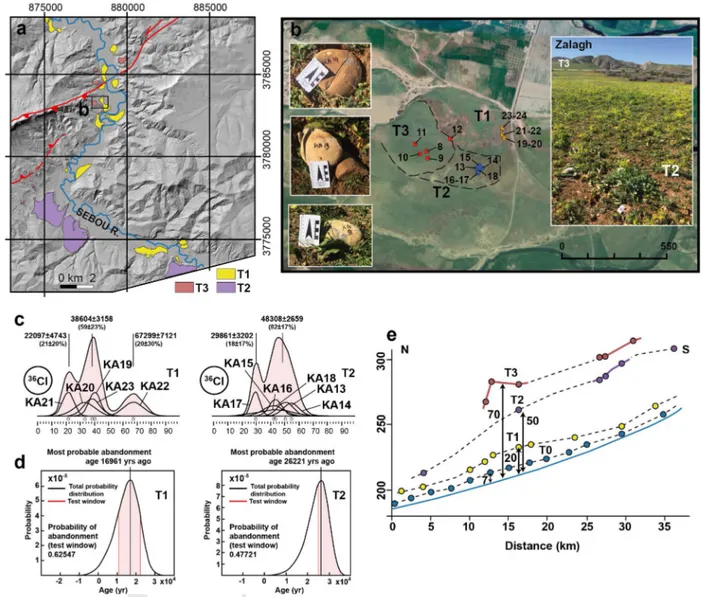
Figure 7. (a) Extract of the Pléiades-derived DSM centered on the Sebou River, east of Fès City, and
497
showing the distribution of the alluvial terraces along the river; (b) Google Earth image extract of Aïn Al 498
Hamamat area showing the position of the samples from the three alluvial surfaces (Tables 1, 2, and 3). 499
Field photographs show the general morphology of terrace T2 (with T3 in the background) as well as some 500
of the samples in their original position; (c) Cosmogenic exposure dating (36Cl) for T
1 and T2 shown as
501
probability distribution curves and !2-test peak ages (Table 4); (d) Probability distributions of abandonment
502
ages for T1 and T2, calculated using the MATLAB tool provided by D’Arcy et al. (2019) over a time window
503
of 11-22 kyr and 25-35 ka, respectively; (e) Vertical distribution of the alluvial terraces along the Sebou 504
River and estimation of the vertical incision at Aïn Al Hamamat. Elevation points were sampled on the 505
Pléiades-derived DSM. 506
507 508
For the lowest terrace (T1), the probability distribution of minimum exposure ages derived from 510
36Cl concentrations is mono-modal (Fig. 7), with a central value of 36.7±2.0 ka, which is consistent 511
with the minimum exposure ages derived for one carbonated sandstone (KA19) using 10Be and 512
26Al concentrations (Tables 2 & 3). 513
For the middle terrace (T2), measured 36Cl concentrations yield a majority of the samples agreeing 514
with a minimum exposure age of 48.3±2.7 ka (Fig. 7), which is also in relative good agreement 515
with the minimum exposure ages derived for one carbonated sandstone (KA15) using 10Be and 516
26Al concentrations (Tables 2 & 3). For this population of samples, the !2-test also accepts a 517
younger peak at 29.9±3.2 ka, which however relies on only one sample (KA17). Among the 518
samples collected on the middle terrace, two are characterized by high 35Cl contents (KA16 and 519
KA18), and should thus be interpreted with caution. 520
For the upper terrace (T3), the measured 36Cl concentrations yield minimum exposure ages that are 521
younger than those obtained for the two other alluvial surfaces (Table 3). This is counter-intuitive 522
since the highest terrace is expected to be the oldest. An alternative interpretation is to consider 523
that this higher alluvial surface has already achieved the cosmogenic steady-sate for spallation 524
production pathway (e.g., Lal, 1991). The measured 36Cl concentrations may thus reflect the local 525
denudation rate acting on such alluvial material (Table 2). Besides two samples that are 526
characterized by significantly lower 36Cl concentrations (KA10 and KA11), the others agree on 527
surface lowering rates ranging from 36±3 to 87±12 m/Ma (Table 2). However, most of them are 528
also characterized by high 35Cl contents, and these estimates should thus be considered with 529
caution. 530
5 Discussion 531
5.1 Significance of the cosmogenic exposure ages 532
Conversely to the sandstone coming from the Miocene Pre-Rif Nappe, the carbonate cobbles are 533
derived from more local Jurassic formations that crop out in the Pre-Rif Ridges (Suter, 1980). 534
Indeed, the Sebou watershed is roughly 6500 km2 in area upstream of Aïn Al Hamamat, with large 535
fluvial terraces along the river bed (Fig. 7). This situation left many opportunities for the sandstone 536
cobbles to experience complex exposure scenarios with alternating burial/exposure episodes 537
during transport. The pair of in situ-produced 10Be and 26Al has long been proposed for studying 538
non-steady eroding horizon (Lal, 1991). For the six carbonated sandstones, the measured 26Al/10Be 539
ratios range from 3.8±0.3 to 5.9±0.5, i.e., close to or lower than the theoretical surface steady-state 540
value of 6.1±0.5 (Stone, 2000). The low 26Al/10Be ratios can be interpreted as reflecting temporary 541
burial of the material (Granger & Muzikar, 2001) or regolith mixing in a slowly eroding landscape 542
(Makhubela et al., 2019). 543
For the carbonate samples, the dispersion of minimum 36Cl exposure suggests that (1) the older 544
samples might also carry cosmogenic content inherited from pre-exposure in the upstream areas, 545
and (2) natural post-abandonment processes (i.e., water runnof, surface deflation) might have, 546
combined with human activities, resulted in upward displacement of cobbles that were initially 547
buried within the first half-metre of alluvial material. This later case could explain the younger 548
ages in the distributions. An alternative interpretation is to consider that the age dispersion is 549
actually representative of the time span of surface activity before abandonment and consequent to 550
an incision of the drainage network. (e.g., Owen et al., 2011). In this scenario, the average value 551
of the age population would fall during the true time span of surface deposition, with the maximum 552
and the minimum ages approximating the beginning of surface activity and the timing of surface 553
abandonment, respectively (D’Arcy et al., 2019). 554
In Zbidat, the central value of 29.6±5.8 ka is only a rough estimate of the abandonment period of 555
the surface. Assuming that the surface abandonment coincided with an abrupt landscape uplift due 556
to the fault activity, the probabilistic approach developed by D’Arcy et al. (2019) considers that 557
this event should be recorded by the age of the youngest sample, depending on the overall period 558
of surface activity. Assuming that the older carbonate cobble is an outlier carrying cosmogenic 559
inheritance, the dispersion of the remaining minimum exposure ages can thus be interpreted as the 560
result of a 41 kyr time-span of surface activity, with a 50% chance of an abandonment time falling 561
between 11 and 22 ka (Fig. 6). In this scenario, the period of surface activity can thus be bracketed 562
between the older peak at 47.7±3.5 ka and the younger peak at 21.4±2.0 ka (Table 4). At Aïn Al 563
Hamamat, considering the older age as an outlier due to cosmogenic inheritance, the lower surface 564
(T1) may have experienced a 31 kyr time-span of surface activity, with a 63% chance of an 565
abandonment time falling between 11 and 22 kyr (Fig. 7). In this scenario, the lower terrace at Aïn 566
Al Hamamat can be regarded as contemporaneous with the alluvial surface that skirts the piemont 567
of Jbel Zerhoun along the Meknès Section. As for the middle surface (T2), it may have experienced 568
a 35 kyr time-span of surface activity, with a 48% chance of an abandonment time falling between 569
25 and 35 kyr (Fig. 7). 570
571
572 573
Figure 8. (a) Structural framework showing the relationship between inherited basement normal faults
574
(after the Carte Néotectonique du Maroc, 1994) and surface expression of active faults along the front of 575
the Pre-Rif Nappe; (b) Sketch of the main frontal thrust, showing the two rooting possibilities at deph: (1) 576
a thin-skinned option where the reverse fault sole at about 3-5 km-depth in the Trias, dipping at 30°; (2) a 577
thick-skinned option where the reverse fault connects to inherited basement faults, dipping at 60°. Arrows 578
indicate uplift rate (U, 0.6-2.0 mm/yr), estimated from measured incision values and cosmogenic surface 579
dating, fault slip rate (F, 0.7-4.0 mm/yr) and shortening rate (S, 0.4-3.5 mm/yr), estimated using a fault dip 580
ranging from 30 to 60°. 581
582
5.2 Estimation of Pleistocene rates of displacement 583
At Zbidat, the 38 m-high topographic escarpment represents the vertical cumulative displacement 584
generated by a 18 km-long reverse fault segment (Fig. 5). Along the trace of this segment, 585
temporary streams have cut through the topography, creating 14 m-deep upstream incisions 586
(Fig. 6). Since there is no temporal constraint on the age of the surface laying at the toe of the 587
escarpment, the height of the escarpment should be regarded as a minimum value for the vertical 588
displacement. Assuming that uplift started as early as the onset of surface activity (i.e., 589
47.7±3.5 ka), a minimum vertical rate of 0.8±0.1 mm/yr can be estimated. This assumption is 590
consistent with that of considering an abandonment of the alluvial surface (i.e., 21.4±2.0 ka), 591
which coincides with the onset of the stream incision and yields an incision rate of 0.7±0.1 mm/yr. 592
However, given the uncertainties associated with the dating of the surface abandonment, a wider 593
bracketing of the incision rate between 0.6 and 2.0 mm/yr cannot be ruled out. 594
At Aïn Al Hamamat, the profiles of the stepped terraces exhibit a convincing warping where the 595
Sebou River crosses the front of the Pre-Rif Nappe (Fig. 7). At the latitude of the Jbel Zalagh 596
pressure ridge, the lower, middle and higher terraces lie at elevations of 20±2, 50±2 and 70±2 m-597
high above the present-day river bed (Fig. 7). In the same area, the Sebou River is also more 598
entrenched into its major flood plain, with an incision of about 7±2 m (Fig. 7). ). On the one hand, 599
based on the abandonment of the lower and middle terraces at 22.1±4.7 and 29.9±3.2 ka, the 600
topographic positions of these two features above the present-day river bed imply vertical incision 601
rates of the Sebou River of the order of 1.0±0.3 and 1.7±0.2 mm/yr. On the other hand, accounting 602
for the entire periods of surface activity, estimated by the central values of 38.6±3.1 ka (T1) and 603
48.3±2.7 ka (T2), yields lower vertical rates of 0.5±0.1 and 1.0±0.1 mm/yr, respectively. Standing 604
at about 7±2 m above the Sebou River, the major flood plain (T0) is not dated but it is certainly 605
younger than the lower terrace. Assuming a Holocene (11±1 ka) onset for this late river incision 606
yields a rate of about 0.7±0.3 mm/yr, which is consistent with previous lower bound estimates. 607
Since the Sebou River is a major regional drainage system, and without trying to account for 608
transient changes in the watershed during the uplift, one can thus consider that a mean incision 609
rate of 0.9±0.2 mm/yr is a reasonable proxy for the last 50 ka. This value is comparable to the 610
lower bound estimated at Zbidat along the Meknès Section (0.7±0.1 mm/yr). However, if one 611
agrees that tectonic uplift is fully responsible for the stepped geometry of the alluvial terraces along 612
the Sebou River, the roughly 30 m-elevation difference between T1 and T2 should have occured 613
after the onset of activity of T2 (48.3±2.7 ka) and before that of T1 (38.6±3.1 ka), implying a 614
vertical uplift rate higher than 2 mm/yr over a short time span. Finally, due to the relatively large 615
uncertainties associated with individual samples and the resulting distributed age populations, it is 616
rather speculative to go further on this. In the following, we will thus consider that a value 617
comprised between 0.6 and 2 mm/yr is a conservative proxy for uplift rates associated with the 618
tectonic activity of the faults running along the Pre-Rif Ridges. 619
620 621 622 623 624
Table 5. Seismic hazard parameters form empirical earthquake scaling laws from Thingbaijam et al. (2017) and Hanks and Kanamori 625
(1979). Return times are estimated using a fault slip rate ranging from 0.7 and 4.0 mm/yr. 626
Segment
name Label of Fig. 5 Sens of motion
Length (km) Rupture area (km2) 30° or 60° Mw displacement Average (m) Return time (yr) Zbidat L1 Reverse 18 254 6.5 ± 0.1 0.6 150-850 Zerhoun L2 Reverse 17 240 6.4 ± 0.1 0.5 140-790 Kennoufa L3 Reverse 19 268 6.5 ± 0.1 0.6 160-920 El Merga L4 Left-lateral 22 311-339 6.3 ± 0.1 0.3 90-500 Tratt L5 Reverse 24 339 6.6 ± 0.1 0.9 220-1290 Meknès L2+L3 Reverse 35 - 6.7 ± 0.1 - - Fès L4+L5 Reverse/LL 46 - 7.8 ± 0.2 - - All Reverse 82 - 7.1 ± 0.1 - - 627 628