Mesoscale modeling of combined aerosol and photo-oxidant processes in the eastern Mediterranean
61
0
0
Texte intégral
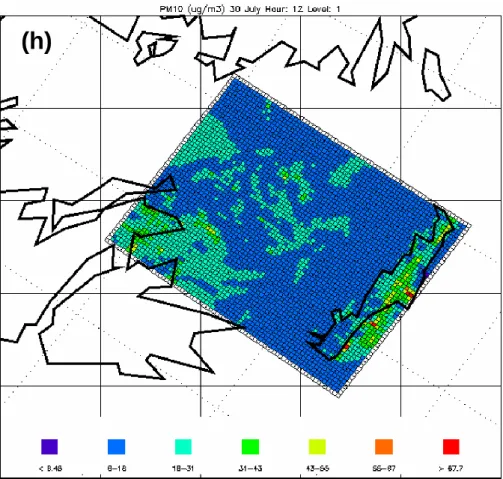
Figure
+7

Documents relatifs
