HAL Id: hal-02065865
https://hal.archives-ouvertes.fr/hal-02065865
Submitted on 21 Aug 2020
HAL is a multi-disciplinary open access
archive for the deposit and dissemination of
sci-entific research documents, whether they are
pub-lished or not. The documents may come from
teaching and research institutions in France or
abroad, or from public or private research centers.
L’archive ouverte pluridisciplinaire HAL, est
destinée au dépôt et à la diffusion de documents
scientifiques de niveau recherche, publiés ou non,
émanant des établissements d’enseignement et de
recherche français ou étrangers, des laboratoires
publics ou privés.
The ALMA-PILS survey: First detection of nitrous acid
(HONO) in the interstellar medium
Audrey Coutens, N. F. W. Ligterink, J.-C. Loison, Valentine Wakelam, H.
Calcutt, M. N. Drozdovskaya, J. K. Jørgensen, H. S. P. Müller, E. F. van
Dishoeck, S. F. Wampfler
To cite this version:
Audrey Coutens, N. F. W. Ligterink, J.-C. Loison, Valentine Wakelam, H. Calcutt, et al.. The
ALMA-PILS survey: First detection of nitrous acid (HONO) in the interstellar medium. Astronomy
and Astrophysics - A&A, EDP Sciences, 2019, 623, pp.L13. �10.1051/0004-6361/201935040�.
�hal-02065865�
https://doi.org/10.1051/0004-6361/201935040 c A. Coutens et al. 2019
Astronomy
&
Astrophysics
L
ETTER TO THEE
DITORThe ALMA-PILS survey: First detection of nitrous acid (HONO)
in the interstellar medium
A. Coutens
1, N. F. W. Ligterink
2, J.-C. Loison
3, V. Wakelam
1, H. Calcutt
4, M. N. Drozdovskaya
2, J. K. Jørgensen
5,
H. S. P. Müller
6, E. F. van Dishoeck
7,8, and S. F. Wampfler
21 Laboratoire d’astrophysique de Bordeaux, Univ. Bordeaux, CNRS, B18N, allée Geoffroy Saint-Hilaire, 33615 Pessac, France e-mail: [email protected]
2 Center for Space and Habitability (CSH), University of Bern, Sidlerstrasse 5, 3012 Bern, Switzerland
3 Institut des Sciences Moléculaires (ISM), CNRS, Université Bordeaux, 351 cours de la Libération, 33400 Talence, France 4 Department of Space, Earth and Environment, Chalmers University of Technology, 41296 Gothenburg, Sweden
5 Centre for Star and Planet Formation, Niels Bohr Institute and Natural History Museum of Denmark, University of Copenhagen, Øster Voldgade 5-7, 1350 Copenhagen K, Denmark
6 I. Physikalisches Institut, Universität zu Köln, Zülpicher Str. 77, 50937 Köln, Germany 7 Leiden Observatory, Leiden University, PO Box 9513, 2300 RA Leiden, The Netherlands
8 Max-Planck Institut für Extraterrestrische Physik (MPE), Giessenbachstr. 1, 85748 Garching, Germany
Received 10 January 2019/ Accepted 7 March 2019
ABSTRACT
Nitrogen oxides are thought to play a significant role as a nitrogen reservoir and to potentially participate in the formation of more complex species. Until now, only NO, N2O, and HNO have been detected in the interstellar medium. We report the first interstellar de-tection of nitrous acid (HONO). Twelve lines were identified towards component B of the low-mass protostellar binary IRAS 16293– 2422 with the Atacama Large Millimeter/submillimeter Array, at the position where NO and N2O have previously been seen. A local thermodynamic equilibrium model was used to derive the column density (∼9 × 1014cm−2in a 0.00
5 beam) and excitation temperature (∼100 K) of this molecule. HNO, NO2, NO+, and HNO3were also searched for in the data, but not detected. We simulated the HONO formation using an updated version of the chemical code Nautilus and compared the results with the observations. The chemical model is able to reproduce satisfactorily the HONO, N2O, and NO2abundances, but not the NO, HNO, and NH2OH abundances. This could be due to some thermal desorption mechanisms being destructive and therefore limiting the amount of HNO and NH2OH present in the gas phase. Other options are UV photodestruction of these species in ices or missing reactions potentially relevant at protostellar temperatures.
Key words. astrochemistry – stars: formation – stars: protostars – ISM: molecules – ISM: individual objects: IRAS 16293–2422
1. Introduction
The interstellar medium (ISM) is characterised by a rich and var-ied chemistry with closely connected groups of species found to be prominent in regions with differing physics. An example is the group of nitrogen oxides, i.e. molecules containing nitrogen-oxygen-hydrogen bonds. Secure interstellar detections have been made for three molecules: nitric oxide (NO; e.g.Liszt & Turner 1978; McGonagle et al. 1990; Ziurys et al. 1991; Caux et al. 2011;Codella et al. 2018;Ligterink et al. 2018), nitrosyl hydride (HNO;Snyder et al. 1993) and nitrous oxide (N2O;Ziurys et al.
1994;Ligterink et al. 2018). These species, in particular NO, are thought to be critical for the overall nitrogen chemistry of the ISM as they may lock up significant amounts of atomic nitrogen, and are often only second in abundance to molecular nitrogen (e.g.
Herbst & Leung 1986;Nejad et al. 1990;Pineau des Forêts et al. 1990; Visser et al. 2011). Nitrogen oxides can be at the basis of greater chemical complexity, as demonstrated, for example, with the solid-state hydrogenation of NO into hydroxylamine (NH2OH;Congiu et al. 2012;Fedoseev et al. 2012,2016) or
ener-getic processing of N2O ice (de Barros et al. 2017).
Despite the relevance of nitrogen oxides as a nitrogen reser-voir and as precursors of complex molecules, a number of important members of this group have not yet been detected in the ISM. Examples are nitrogen dioxide (NO2), nitrous acid
(HONO), and nitric acid (HNO3), which on Earth play a role in
atmospheric pollution (e.g.Possanzini et al. 1988). In particular, the photodissociation of HONO results in abundant formation of OH radicals, which in turn engage in various oxidation reactions and the formation of ground-level ozone (O3;Ren et al. 2003;
Lee et al. 2013;Gligorovski 2016;Zhang et al. 2016). Because of its relevance in atmospheric chemistry, the formation, destruc-tion, and characteristics of HONO have been well studied (e.g.
Cox & Derwent 1976;Jenkin et al. 1988;Joshi et al. 2012). In this work, HONO and other nitrogen oxides were searched for towards the low-mass protostar IRAS 16293–2422 (here-after IRAS 16293), located at a distance of ∼140 pc in the ρ Ophiuchus cloud complex (Dzib et al. 2018). This Class 0 object is known for its chemical complexity and is consid-ered an astrochemical reference among solar-type protostars (e.g. van Dishoeck et al. 1995; Cazaux et al. 2003; Caux et al. 2011; Jørgensen et al. 2016). A large number of species have
Open Access article,published by EDP Sciences, under the terms of the Creative Commons Attribution License (http://creativecommons.org/licenses/by/4.0),
A&A 623, L13 (2019)
first been detected towards a low-mass source in this object. These detections include the small species NO and N2O
(Caux et al. 2011; Ligterink et al. 2018), the simplest “sugar” glycolaldehyde (HOCH2CHO;Jørgensen et al. 2012,2016), the
peptide-like molecules formamide (NH2CHO) and methyl
iso-cyanate (CH3NCO; Kahane et al. 2013; Coutens et al. 2016;
Ligterink et al. 2017;Martín-Doménech et al. 2017), cyanamide (NH2CN; Coutens et al. 2018), methyl isocyanide (CH3NC;
Calcutt et al. 2018), ethylene oxide (c-C2H4O, Lykke et al.
2017), and the isomers of acetone (CH3COCH3) and propanal
(C2H5CHO, Lykke et al. 2017). Recently, the first interstellar
detection of the organohalogen CH3Cl was also reported towards
this source (Fayolle et al. 2017).
In this Letter, we present the first interstellar detection of HONO. Further constraints on the nitrogen oxide chemistry towards IRAS 16293 are given, and a first attempt is made at modelling the HONO formation network.
2. Observations and analysis
Data from the Protostellar Interferometric Line Survey (PILS) of the low-mass protobinary IRAS 16293 were used to search for nitrogen oxides. This survey, taken with the Atacama Large Millimeter/submillimeter Array (ALMA), is fully described in Jørgensen et al. (2016). A short overview is given in this section. The survey covers part of Band 7 in the spectral range 329.147–362.896 GHz, at a spectral resolution of 0.2 km s−1,
and with a sensitivity of 6–10 mJy beam−1 channel−1 (i.e. 4–5 mJy beam−1km s−1). A circular restoring beam of 0.005 was
used to produce the final dataset. IRAS 16293 is a binary. HONO is identified towards source B, but not towards source A. Source B is analysed at a position offset by one beam with respect to the continuum peak position in the south-west direction (αJ2000 = 16h32m22.s58, δJ2000 = −24◦28032.800). The
very narrow line widths (1 km s−1) at this position limit line blending and facilitate easier identification of molecules (e.g.
Lykke et al. 2017).
To analyse the spectra and identify the HONO lines, the CASSIS line analysis software1, as well as the Jet Propulsion Laboratory (JPL2) spectroscopic database (Pickett et al. 1998)
and the Cologne Database for Molecular Spectroscopy (CDMS3;
Müller et al. 2001,2005) were used. The spectroscopy of HONO available in the JPL database was studied by Guilmot et al.
(1993a,b) andDehayem-Kamadjeu et al.(2005). HONO has two different conformers, trans and cis. The JPL entry assumes that the isomers are in thermal equilibrium. The trans/cis energy difference (130.2 cm−1) is from Varma & Curl (1976). Since
the spectra of IRAS 16293 are very line-rich, a careful check was performed to exclude blended or partially blended lines. To achieve this, we compared all lines tentatively identified as HONO with a template containing the lines of the molecules previously detected in this source (see AppendixA). Similar to previous PILS studies (e.g.Ligterink et al. 2018), the observed spectra were fitted with a synthetic spectrum, assuming local thermodynamic equilibrium (LTE) conditions, using a source size of 0.005 and a V
LSRvelocity of 2.5 km s−1. As the line
emis-sion is coupled with dust emisemis-sion in IRAS 16293, a correc-tion to the background temperature (TBG = 21 K) was applied
1 CASSIS has been developed by IRAP-UPS/CNRS (http://
cassis.irap.omp.eu/) 2 http://spec.jpl.nasa.gov
3 https://cdms.astro.uni-koeln.de/
(see alsoCalcutt et al. 2018;Ligterink et al. 2018). A χ2 min-imisation routine was employed to find the best-fit model to the observed data and derive the column density (N) and excitation temperature (Tex; see alsoLykke et al. 2017;Calcutt et al. 2018;
Ligterink et al. 2018). The grid covers excitation temperatures between 50 and 300 K with steps of 25 K. After a first estimate of the column density, the grid was refined between 5 × 10¹⁴
and 3 × 1015cm−2 with a step of 1 × 1014cm−2. To avoid any bias in the determination of the best-fit model with the χ2
cal-culation, we included some undetected transitions (333925.02, 348264.91, and 358979.13 MHz) that are predicted to be above the noise limit for certain models in the grid.
3. Observational results
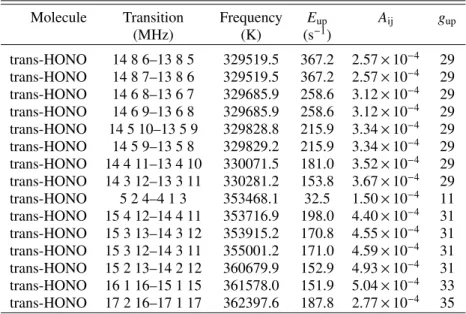
In total, we found 12 lines that could be identified as (trans-) HONO, which are not blended with any known species (see Fig. 1 and Table A.1). The intensities of nine out of these lines are higher or equal to 5σ. Two lines are 3 or 4σ detec-tions and one is a marginal (2σ) detection. The best-fit model is obtained for an excitation temperature of 100 K and a col-umn density of 9 × 1014cm−2. The column density is not very sensitive to the excitation temperature. For a fixed excitation temperature of 300 K, which is derived for several complex organic molecules (see Jørgensen et al. 2018), the best-fit col-umn density is 1.4 × 1015cm−2, i.e. only 50% larger. Nev-ertheless, the model at 300 K overproduces some undetected lines at 333925.02, 348264.91, and 358979.13 MHz (TableA.2) and does not properly reproduce the line at 353468.14 MHz. The model at 300 K however better reproduces the line at 329519.48 MHz than the model at 100 K (see Fig.1). The best-fit excitation temperature of 100 K is consistent with the excitation temperature obtained for the other nitrogen oxides, especially NO (Ligterink et al. 2018). Three lines (329519.48, 329685.92, and 355001.15 GHz) have their fluxes underproduced by the best-fit model and could be blended with unknown species, although the first line is only detected at 3σ. Alternatively, it could be that for molecules with low-frequency vibrational modes such as HONO, the excitation does not need to be in LTE, but there could be infrared pumping for selected lines.
Lines of HONO were also searched towards other high sensitivity ALMA observations of the low-mass protostar IRAS 16293. One line is present at 93008.6 MHz in the lower spatial resolution data of the ALMA-PILS observations carried out in band 3 (Jørgensen et al. 2016, see Fig. 1). None are present in the band 6 data. According to our calculations, one HONO transition at 236131.076 MHz should also be observed in the ALMA data presented inTaquet et al.(2018) with an intensity of 7 mJy for a similar spatial resolution of 0.005. An unidentified line is present at the same frequency, but its intensity is a factor 3 higher, which could mean that the observed line is blended with another species (see Fig.1).
Maps of HONO (see Fig. 2) show that the emission is very compact around IRAS 16293 B, similar to the majority of the molecules detected in this source, especially the com-plex organic molecules (see e.g. Coutens et al. 2016, 2018;
Lykke et al. 2017) and NO (Ligterink et al. 2018).
Four other nitrogen-oxides, nitrosyl hydride (HNO), nitrosyl cation (NO+), nitrogen dioxide (NO2), and nitric acid (HNO3)
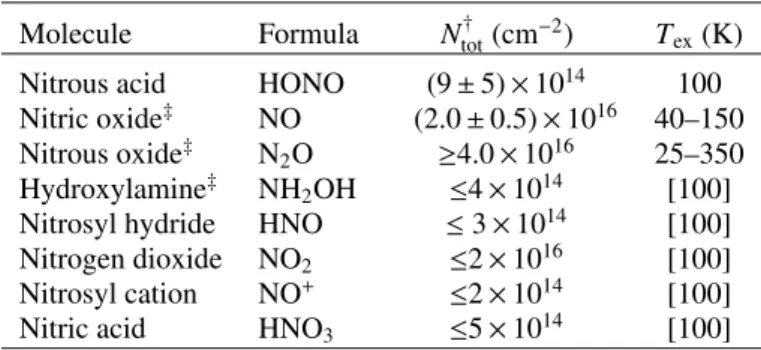
were searched for, but not identified (see Appendix B for details). Table1 gives an overview of the derived column den-sities of the detected and unidentified species (upper limits) towards IRAS 16293 B and includes results on NO, N2O, and
NH2OH fromLigterink et al.(2018).
329.515 329.520 -0.02 0.00 0.02 0.04 0.06 (Jy/beam) 367 K 329.685 329.690 259 K 329.825 329.830 216 K 330.070 330.075 181 K 330.280 330.285 154 K 353.465 353.470 33 K 353.715 353.720 -0.02 0.00 0.02 0.04 0.06 (Jy/beam) 198 K 353.910 353.915 353.920 171 K 355.000 355.005 171 K 360.675 360.680 360.685 153 K 361.575 361.580 152 K 362.395 362.400 188 K 333.920 333.925 Frequency (GHz) -0.02 0.00 0.02 0.04 0.06 (Jy/beam) 270 K 348.260 348.265 Frequency (GHz) 443 K 358.975 358.980 358.985 Frequency (GHz) 295 K 93.008 93.010 Frequency (GHz) x 2 21 K 236.128 236.132 Frequency (GHz) x 2 27 K
Fig. 1.Lines of HONO observed towards the protostar IRAS 16293 B (in black). The first 12 lines are the identified lines of HONO in the ALMA-PILS band 7 survey. On the last row, the first 3 lines correspond to the undetected transitions that are used to constrain the best-fit model and the last two lines are those identified in other ALMA data (see Sect.3for more details). The 3σ limit is indicated by a dotted line. The best-fit model with Tex = 100 K is shown in blue, while the model in red corresponds to a higher Texof 300 K. The spectrum at 93 GHz is extracted at the continuum peak position, given the lower spatial resolution of the data. The column density was multiplied by a factor 2 to take this difference into account (Jørgensen et al. 2016). The upper energy level is indicated in green in the bottom left corner of each panel.
329.829 GHz Eup = 216 K
353.468 GHz Eup = 33 K
Fig. 2.Integrated intensity maps of two transitions of HONO towards IRAS 16293 B. The position of the continuum peak is indicated with a red triangle, while the position analysed for IRAS 16293 B (full-beam offset) is indicated with a red circle. The beam size is indicated in grey in the bottom right corner. Left panel: contours are 5, 10, 15, and 20σ. Right panel: contour levels are 3, 6, and 9σ.
4. Chemical modelling of HONO
To describe HONO and other NxOyHz species, we updated the
gas and grain chemical network used inLoison et al.(2019, and references therein) introducing various species such as HONO, s-HONO, s-HNO2, s-NH2O, s-HNOH, NH2OH, s-NH2OH,
s-NO3, s-HNO3, and s-H3NO2 (s- indicates species on grains).
The reactions involving HONO are summarised in TableC.1(we do not present the full network in this Letter). The chemistry of HONO is well described for Earth atmosphere chemistry where it is produced through the barrierless three body OH+ NO + M reaction (Forster et al. 1995; Atkinson et al. 2004). However, this reaction is inefficient at the low densities of interstellar clouds and the radiative rate constant is negligible because of the small size of the system. All other known gas-phase
reac-Table 1. Column densities at the one beam offset position of IRAS 16293 B from the ALMA-PILS data.
Molecule Formula Ntot† (cm−2) T ex(K)
Nitrous acid HONO (9 ± 5) × 1014 100 Nitric oxide‡ NO (2.0 ± 0.5) × 1016 40–150
Nitrous oxide‡ N2O ≥4.0 × 10¹⁶ 25–350
Hydroxylamine‡ NH
2OH ≤4 × 10¹⁴ [100]
Nitrosyl hydride HNO ≤ 3 × 10¹⁴ [100] Nitrogen dioxide NO2 ≤2 × 10¹⁶ [100]
Nitrosyl cation NO+ ≤2 × 10¹⁴ [100]
Nitric acid HNO3 ≤5 × 10¹⁴ [100]
Notes. All models assume LTE, FWHM of 1 km s−1, peak velocity V peak of 2.5 ± 0.2 km s−1, and source size of 0.00
5.(†)The uncertainties are 3σ. Upper limits are also 3σ and determined for an assumed Tex = 100 K, indicated with brackets in the table. (‡)Results from Ligterink et al. (2018).
tions producing HONO have negligible rates in the ISM. In our model, HONO is therefore produced on grains through s-O+ s-HNO, s-H+ s-NO2, and s-OH+ s-NO surface reactions, all of
which are barrierless in the gas phase (Inomata & Washida 1999;
Du et al. 2004;Michael et al. 1979;Nguyen et al. 1998;Su et al. 2002;Forster et al. 1995;Atkinson et al. 2004).
This network was then used with the Nautilus gas-grain model (Ruaud et al. 2016), which computes the gas and grain chemistry. The chemical modelling was carried out in two steps as in similar previous studies of IRAS 16293 (see for instanceAndron et al. 2018): a cold core phase (a gas and dust temperature of 10 K, atomic H density of 104cm−3, visual
A&A 623, L13 (2019) Table 2. Abundances of HONO derived in IRAS 16293 B and with the chemical model.
[HONO]/[NO] [HONO]/[N2O] [HONO]/[HNO] [HONO]/[NO2] [HONO]/[NH2OH] [HONO]/[CH3OH]
IRAS 16293 B 4.5 × 10⁻² ≤2.3 × 10⁻²,† ≥3 ≥4.5 × 10⁻² ≥2.3 9 × 10⁻⁵
Chemical model 71 2 × 10⁻² 1 × 10⁻² 533 1.7 × 10⁻³ 1.9 × 10⁻⁴
Notes.(†)Upper limit due to a lower limit on N
2O.
extinction (AV) of 15, and cosmic-ray ionisation rate of 1.3 ×
10−17s−1) during 106yr followed by a collapse phase. For the
collapse, we used the physical structure derived from a 1D radia-tive hydrodynamical model (seeAikawa et al. 2008) for parcels of material collapsing towards the central star. For these simu-lations, we used these parcels arriving at 62.4 au at the end of the simulations (see Fig. 5 ofAikawa et al. 2008). The resulting abundance ratios at this radius at the end of the simulation are presented in Table2.
In our model, HONO is essentially formed during the cold core phase. The final HONO/CH3OH ratio predicted by the
model is close to the observed value within a factor of 2. The model ratios HONO/N2O and HONO/NO2are also in agreement
with the observed upper and lower limits, respectively. How-ever, our model produces too little NO and too much HNO at high temperatures in the gas phase, resulting in a HONO/NO ratio much larger and a HONO/HNO ratio much smaller than the respective observed values. In our model, most of the NO reacts on grains with other radicals such as s-NH, when the temperature increases and NO becomes mobile. An explanation for the large NO/HNO ratio observed in IRAS 16923 B could be that ther-mal desorption of s-HNO mainly results in its destruction to NO, owing to the weak H-NO bond of HNO (2.02 eV;Dixon 1996), as the formation of s-HNO is very likely due to the absence of a barrier for the s-H+ s-NO reaction (Tsang & Herron 1991;
Nguyen et al. 2004; Washida et al. 1978;Glarborg et al. 1998). It should be noted that our model, as well as other published models, overproduce the abundance of NH2OH, which has so far
not been detected in the ISM (Pulliam et al. 2012;McGuire et al. 2015;Ligterink et al. 2018). It has been suggested that NH2OH
cannot desorb without destruction by Jonusas & Krim (2016), although this is in contradiction with the laboratory experiments of Congiu et al. (2012). Despite their differences, both experi-mental studies used very similar Temperature Programmed Des-orption (TPD) set-ups and new experiments are therefore clearly needed to address these discrepancies. Other processes such as UV photodestruction of these species in ices could also explain the discrepancy between the model and observations (Fedoseev et al. 2016). In addition, the chemical network on grains and in the gas phase may not be fully relevant at proto-stellar temperatures. Some reactions with barriers, absent from the current network, may be significant.
5. Conclusions
We report the first detection of HONO in the ISM. This molecule, which is known to play a major role in the atmosphere of our planet, was found with ALMA towards the well-studied solar-type protostar IRAS 16293 B. This discovery complements the recent detection of N2O in the same source (Ligterink et al.
2018) and expands our knowledge of the chemical network of nitrogen oxides. Our updated model allows the abundances of HONO, N2O, and NO2to be reproduced satisfactorily, but not
those of NO, HNO, and NH2OH. One reason could be that HNO
and NH2OH are destroyed upon thermal desorption, an
occur-rence which deserves to be experimentally studied in detail. Other explanations could be that they are destroyed by UV photons in ices or that some grain surface or gas-phase reac-tions, potentially relevant at protostellar temperatures, are miss-ing from the network.
Acknowledgements. This paper makes use of the ALMA data ADS/JAO. ALMA#2013.1.00278.S. ALMA is a partnership of ESO (representing its member states), NSF (USA) and NINS (Japan), together with NRC (Canada) and NSC and ASIAA (Taiwan), in cooperation with the Republic of Chile. The Joint ALMA Observatory is operated by ESO, AUI/NRAO, and NAOJ. A.C. postdoctoral grant is funded by the ERC Starting Grant 3DICE (grant agree-ment 336474). V.W. and J.-C.L. acknowledge the CNRS programme Physique et Chimie du Milieu Interstellaire (PCMI) co-funded by the Centre National d’Etudes Spatiales (CNES). M.N.D. acknowledges the financial support of the SNSF Ambizione grant 180079, the Center for Space and Habitability (CSH) Fellowship and the IAU Gruber Foundation Fellowship. J.K.J. acknowl-edges support from ERC Consolidator Grant “S4F” (grant agreement 646908). Research at the Centre for Star and Planet Formation is funded by the Danish National Research Foundation.
References
Aikawa, Y., Wakelam, V., Garrod, R. T., & Herbst, E. 2008,ApJ, 674, 984 Andron, I., Gratier, P., Majumdar, L., et al. 2018,MNRAS, 481, 5651 Atkinson, R., Baulch, D. L., Cox, R. A., et al. 2004,Atmos. Chem. Phys., 4,
1461
Burkholder, J. B., Mellouki, A., Talukdar, R., & Ravishankara, A. 1992,Int. J. Chem. Kinet., 24, 711
Calcutt, H., Fiechter, M. R., Willis, E. R., et al. 2018,A&A, 617, A95 Caux, E., Kahane, C., Castets, A., et al. 2011,A&A, 532, A23
Cazaux, S., Tielens, A. G. G. M., Ceccarelli, C., et al. 2003,ApJ, 593, L51 Codella, C., Viti, S., Lefloch, B., et al. 2018,MNRAS, 474, 5694 Congiu, E., Fedoseev, G., Ioppolo, S., et al. 2012,ApJ, 750, L12
Coutens, A., Jørgensen, J. K., van der Wiel, M. H. D., et al. 2016,A&A, 590, L6 Coutens, A., Willis, E. R., Garrod, R. T., et al. 2018,A&A, 612, A107 Cox, R., & Derwent, R. 1976,J. Photochem., 6, 23
de Barros, A. L. F., da Silveira, E. F., Fulvio, D., Boduch, P., & Rothard, H. 2017, MNRAS, 465, 3281
Dehayem-Kamadjeu, A., Pirali, O., Orphal, J., Kleiner, I., & Flaud, P.-M. 2005, J. Mol. Spectr., 234, 182
Dixon, R. N. 1996,J. Chem. Phys., 104, 6905
Du, B., Zhang, W., Feng, C., & Zhou, Z. 2004,J. Mol. Struct. THEOCHEM, 712, 101
Dzib, S. A., Ortiz-León, G. N., Hernández-Gómez, A., et al. 2018,A&A, 614, A20
Fayolle, E. C., Öberg, K. I., Jørgensen, J. K., et al. 2017,Nat. Astron., 1, 703 Fedoseev, G., Ioppolo, S., Lamberts, T., et al. 2012,J. Chem. Phys., 137, 054714 Fedoseev, G., Chuang, K.-J., van Dishoeck, E. F., Ioppolo, S., & Linnartz, H.
2016,MNRAS, 460, 4297
Florescu-Mitchell, A., & Mitchell, J. 2006,Phys. Rep., 430, 277 Forster, R., Frost, M., Fulle, D., et al. 1995,J. Chem. Phys., 103, 2949 Fournier, J. A., Shuman, N. S., Melko, J. J., Ard, S. G., & Viggiano, A. A. 2013,
J. Chem. Phys., 138, 154201
Geppert, W. D., Ehlerding, A., Hellberg, F., et al. 2004,ApJ, 613, 1302 Glarborg, P., Østberg, M., Alzueta, M. U., Dam-Johansen, K., & Miller, J. A.
1998,Symp. (Int.) Combust., 27, 219
Gligorovski, S. 2016,J. Photochem. Photobiol. A Chem., 314, 1
Guilmot, J. M., Godefroid, M., & Herman, M. 1993a,J. Mol. Spectr., 160, 387 Guilmot, J. M., Melen, F., & Herman, M. 1993b,J. Mol. Spectr., 160, 401 Herbst, E., & Leung, C. M. 1986,ApJ, 310, 378
Hsu, C.-C., Lin, M., Mebel, A., & Melius, C. 1997,J. Chem. Phys. A, 101, 60 Inomata, S., & Washida, N. 1999,J. Phys. Chem. A, 103, 5023
Jenkin, M., & Cox, R. 1987,Chem. Phys. Lett., 137, 548
Jenkin, M., Cox, R., & Williams, D. 1988,Atmos. Environ., 22, 487 Jonusas, M., & Krim, L. 2016,MNRAS, 459, 1977
Jørgensen, J. K., Favre, C., Bisschop, S. E., et al. 2012,ApJ, 757, L4
Jørgensen, J. K., van der Wiel, M. H. D., Coutens, A., et al. 2016,A&A, 595, A117
Jørgensen, J. K., Müller, H. S. P., Calcutt, H., et al. 2018,A&A, 620, A170 Joshi, P. R., Zins, E.-L., & Krim, L. 2012,MNRAS, 419, 1713
Kahane, C., Ceccarelli, C., Faure, A., & Caux, E. 2013,ApJ, 763, L38 Lee, B. H., Wood, E. C., Herndon, S. C., et al. 2013,J. Geophys. Res. (Atmos.),
118, 12
Ligterink, N. F. W., Coutens, A., Kofman, V., et al. 2017,MNRAS, 469, 2219 Ligterink, N. F. W., Calcutt, H., Coutens, A., et al. 2018,A&A, 619, A28 Liszt, H. S., & Turner, B. E. 1978,ApJ, 224, L73
Loison, J.-C., Wakelam, V., Gratier, P., et al. 2019, MNRAS, in press [arXiv:1902.08840]
Lykke, J. M., Coutens, A., Jørgensen, J. K., et al. 2017,A&A, 597, A53 Martín-Doménech, R., Rivilla, V. M., Jiménez-Serra, I., et al. 2017,MNRAS,
469, 2230
McGonagle, D., Ziurys, L. M., Irvine, W. M., & Minh, Y. C. 1990,ApJ, 359, 121 McGuire, B. A., Carroll, P. B., Dollhopf, N. M., et al. 2015,ApJ, 812, 76 Michael, J. V., Nava, D. F., Payne, W. A., Lee, J. H., & Stief, L. J. 1979,J. Phys.
Chem., 83, 2818
Müller, H. S. P., Thorwirth, S., Roth, D. A., & Winnewisser, G. 2001,A&A, 370, L49
Müller, H. S. P., Schlöder, F., Stutzki, J., & Winnewisser, G. 2005,J. Mol. Struct., 742, 215
Nejad, L. A. M., Williams, D. A., & Charnley, S. B. 1990,MNRAS, 246, 183
Nguyen, M. T., Sumathi, R., Sengupta, D., & Peeters, J. 1998,Chem. Phys., 230, 1
Nguyen, H., Zhang, S., Peeters, J., Truong, T., & Nguyen, M. 2004,Chem. Phys. Lett., 388, 94
Pickett, H. M., Poynter, R. L., Cohen, E. A., et al. 1998,J. Quant. Spectr. Rad. Transf., 60, 883
Pineau des Forêts, G., Roueff, E., & Flower, D. R. 1990,MNRAS, 244, 668 Plessis, S., Carrasco, N., Dobrijevic, M., & Pernot, P. 2012,Icarus, 219, 254 Possanzini, M., Buttini, P., & Di Palo, V. 1988,Sci. Total Environ., 74, 111 Pulliam, R. L., McGuire, B. A., & Remijan, A. J. 2012,ApJ, 751, 1 Ren, X., Harder, H., Martinez, M., et al. 2003,Atoms. Environ., 37, 3639 Ruaud, M., Wakelam, V., & Hersant, F. 2016,MNRAS, 459, 3756
Snyder, L. E., Kuan, Y.-J., Ziurys, L. M., & Hollis, J. M. 1993,ApJ, 403, L17 Su, M. C., Kumaran, S. S., Lim, K. P., et al. 2002,J. Phys. Chem. A, 106, 8261 Taquet, V., van Dishoeck, E. F., Swayne, M., et al. 2018,A&A, 618, A11 Tsang, W., & Herron, J. 1991,J. Phys. Chem. Ref. Data, 20, 609
van Dishoeck, E. F., Blake, G. A., Jansen, D. J., & Groesbeck, T. D. 1995,ApJ, 447, 760
Varma, R., & Curl, R. F. 1976,J. Phys. Chem., 80, 402
Visser, R., Doty, S. D., & van Dishoeck, E. F. 2011,A&A, 534, A132 Wakelam, V., Smith, I., Herbst, E., et al. 2010,Space Sci. Rev., 156, 13 Wakelam, V., Herbst, E., Loison, J.-C., et al. 2012,ApJS, 199, 21 Washida, N., Akimoto, H., & Okuda, M. 1978,J. Phys. Chem., 82, 2293 Zhang, L., Wang, T., Zhang, Q., et al. 2016,J. Geophys. Res. (Atmos.), 121,
3645
Ziurys, L. M., McGonagle, D., Minh, Y., & Irvine, W. M. 1991,ApJ, 373, 535 Ziurys, L. M., Apponi, A. J., Hollis, J. M., & Snyder, L. E. 1994,ApJ, 436, L181
A&A 623, L13 (2019)
Appendix A: Lines of HONO
The detected HONO transitions that are not found to be blended with known species are listed in Table A.1. To check the potential blending of the HONO lines with other species, we defined a template based on the molecules previously identified in the ALMA-PILS survey. This template includes the following species (ranked by mass): CCH, HCN, HNC, H13CN, HC15N, DNC, CO, 13CO, C17O, H13C15N, CH
2NH,
NO, C18O, DCO+, H2CO, HDCO, H132 CO, H2C17O, D2CO,
H2C18O, CH3OH, CH2DOH, CH3OD, 13CH3OH, D132 CO,
H2S, CH183 OH, HDS, HD34S, c-C3H2, CH3CCH, CH3CN,
CH3NC, NH2CN, H2CCO, 13CH3CN, CH133 CN, CH3C15N,
CH2DCN, H2C13CO, H132 CCO, HDCCO, HNCO, CHD2CN,
NH13
2 CN, NHDCN, CH3CHO, N2O, DNCO, HN 13CO,
CS, c-C2H4O, SiO, CH3CDO, 13CH3CHO, CH133 CHO,
C33S, NH2CHO, C34S, t-HCOOH, H2CS, NH132 CHO,
cis-NHDCHO, trans-cis-NHDCHO, NH2CDO, CH3OCH3, C2H5OH,
DCOOH, HCOOD, t-H13COOH, HDCS, a-CH133 CH2OH,
a-13CH3CH2OH, a-CH3CH2OD, a-CH3CHDOH,
a-a-CH2DCH2OH, a-s-CH2DCH2OH,13CH3OCH3, a-CH2DOCH3,
sym-CH2DOCH3, SO, C36S, CH3SH, CH353 Cl, HC3N, CH373 Cl,
C2H3CN, C2H5CN, CH3NCO, CH3COCH3, C2H5CHO,
CH3OCHO, CH2(OH)CHO, OCS, CH3COOH, O13CS,
OC33S, CH
2(OH)13CHO, 13CH2(OH)CHO, CH3O13CHO,
CH2(OD)CHO, CHD(OH)CHO, CH2(OH)CDO, CH3OCDO,
CH2DOCHO, CHD2OCHO, aGg’-(CH2OH)2, gGg’-(CH2OH)2,
OC34S, 18OCS, CHD
2OCHO, SO2, and 34SO2. Figure A.1
presents the HONO lines over a larger spectral range with the overlaid template model in green and the HONO model in red.
Table A.1. List of the detected and unblended HONO transitions.
Molecule Transition Frequency Eup Aij gup
(MHz) (K) (s−1) trans-HONO 14 8 6–13 8 5 329519.5 367.2 2.57 × 10⁻⁴ 29 trans-HONO 14 8 7–13 8 6 329519.5 367.2 2.57 × 10⁻⁴ 29 trans-HONO 14 6 8–13 6 7 329685.9 258.6 3.12 × 10⁻⁴ 29 trans-HONO 14 6 9–13 6 8 329685.9 258.6 3.12 × 10⁻⁴ 29 trans-HONO 14 5 10–13 5 9 329828.8 215.9 3.34 × 10⁻⁴ 29 trans-HONO 14 5 9–13 5 8 329829.2 215.9 3.34 × 10⁻⁴ 29 trans-HONO 14 4 11–13 4 10 330071.5 181.0 3.52 × 10⁻⁴ 29 trans-HONO 14 3 12–13 3 11 330281.2 153.8 3.67 × 10⁻⁴ 29 trans-HONO 5 2 4–4 1 3 353468.1 32.5 1.50 × 10⁻⁴ 11 trans-HONO 15 4 12–14 4 11 353716.9 198.0 4.40 × 10⁻⁴ 31 trans-HONO 15 3 13–14 3 12 353915.2 170.8 4.55 × 10⁻⁴ 31 trans-HONO 15 3 12–14 3 11 355001.2 171.0 4.59 × 10⁻⁴ 31 trans-HONO 15 2 13–14 2 12 360679.9 152.9 4.93 × 10⁻⁴ 31 trans-HONO 16 1 16–15 1 15 361578.0 151.9 5.04 × 10⁻⁴ 33 trans-HONO 17 2 16–17 1 17 362397.6 187.8 2.77 × 10⁻⁴ 35
Notes. Quantum numbers are given as J0 K0 aK 0 c– J 00 K00 a K 00 c.
Table A.2. List of the undetected HONO transitions used in the χ2calculation.
Species Transition Frequency Eup Aij gup
(MHz) (K) (s−1)
trans-HONO 21 1 20–21 0 21 333925.0 270.3 5.42 × 10⁻⁴ 43
cis-HONO 20 1 19–20 0 20 348264.9 443.2 7.87 × 10⁻⁴ 41 trans-HONO 22 1 21–22 0 22 358979.1 295.3 6.82 × 10⁻⁴ 45
Notes. Quantum numbers are given as J0 K0 aK 0 c– J 00 K00 a K 00 c. L13, page 6 of9
329.5 329.6 329.7 329.8 -0.02 0.00 0.02 0.04 0.06 0.08 0.10 (Jy/beam) 329.9 330.0 330.1 330.2 -0.02 0.00 0.02 0.04 0.06 0.08 0.10 (Jy/beam) 353.2 353.3 353.4 353.5 -0.02 0.00 0.02 0.04 0.06 0.08 0.10 (Jy/beam) 353.6 353.7 353.8 353.9 -0.02 0.00 0.02 0.04 0.06 0.08 0.10 (Jy/beam) 354.8 354.9 355.0 355.1 -0.02 0.00 0.02 0.04 0.06 0.08 0.10 (Jy/beam) 360.5 360.6 360.7 360.8 -0.02 0.00 0.02 0.04 0.06 0.08 0.10 (Jy/beam) 361.4 361.5 361.6 361.7 -0.02 0.00 0.02 0.04 0.06 0.08 0.10 (Jy/beam) 362.2 362.3 362.4 362.5 Frequency (GHz) -0.02 0.00 0.02 0.04 0.06 0.08 0.10 (Jy/beam)
Fig. A.1.Lines of HONO observed towards the protostar IRAS 16293 B over a larger spectral range. The HONO best-fit model is shown in red, while the template model used to check the potential blending of the lines is overlaid in green.
A&A 623, L13 (2019)
Appendix B: Upper limit determination of HNO, NO+, NO2, and HNO3
The molecules HNO, NO+, NO2, and HNO3were searched for
in the PILS data without success. Upper limit column densities of 3σ were determined for Tex = 100 K. When possible,
line-free regions of the observed data, where transitions are expected, were used. For HNO, the 41,3–31,2transition at 332106.6 MHz,
which is close to the transition of an unidentified species, was used. For NO+, only the 3–2 transition at 357.564 GHz is cov-ered in the PILS range. It is found to be blended with a line of ethylene glycol. We determined a conservative upper limit based
on the total flux of this line. For NO2, the undetected transitions
at 348062.5 and 348820.7 MHz were used. For HNO3, many
undetected lines are covered in the spectral range of the PILS survey. The upper limit was derived based on the brightest lines predicted in line-free regions. At Tex = 100 K, this yields 3σ
upper limit column densities of 3 × 10¹⁴, 2 × 10¹⁴, 2 × 10¹⁶, and 5 × 1014cm−2for HNO, NO+, NO
2, and HNO3, respectively.
Appendix C: Chemical reactions for HONO
The reactions involving HONO are listed in TableC.1.
T able C.1. Summary of the reactions in v olving HONO Reaction ∆ E kJ mol − 1 α β γ F0 g Reference 1. H ++ HONO -→ HONO ++ H → H2 O + NO + − 235 − 693 0 1.0 2.0 × 10 − 9 5.27 3 0 Ionpol1, capture rate theory . W e av oid introducing HONO +. 2. He ++ HONO → HONO ++ He → HO + NO ++ He 0 1.0 1.0 × 10 − 9 5.27 3 0 Ionpol1, capture rate theory . W e av oid introducing HONO +. 3. C + HONO → CO + NO + H − 459 3.0 × 10 − 10 0 0 2 0 Capture rate theory , approximate branching ratio. 4. C ++ HONO → CO + NO ++ H → HCO ++ NO − 635 − 817 2.0 × 10 − 9 0 − 0.4 − 0.4 0 0 3 3 0 0 Capture rate theory , approximate branching ratio. (HCO ++ NO is lik ely a non-ne gligible exit channel). 5. OH + HONO → NO 2 + H2 O − 21 7.0 × 10 − 12 − 0.6 0 1.6 10 This reaction has been studied between 278 and 373K. The results from Jenkin & Cox ( 1987 ) sho w lar ge uncertainty due to complicated secondary reactions. The results from Burkholder et al. ( 1992 ) sho w no barrier and a ne g-ati v e temperature dependenc y. W e use an expression compatible with experi-mental data and leading to reasonable rate constant at 10K. 6. HONO + H + 3 → H2 ONO ++ H2 → HONOH ++ H2 → HONHO ++ H2 − 358 − 232 − 196 1.0 0 0 2.38 × 10 − 9 5.27 2 0 Ionpol1. The others isomers are also lik ely to be produced b ut we av oid intro-ducing too man y species without a notably di ff erent chemical beha viour . 7. HONO + HCO + → H2 ONO ++ CO − 210 1.0 9.45 × 10 − 10 5.27 2 0 Ionpol1. 8. H2 ONO ++ e − → HONO + H → H2 O + NO → H + OH + NO → H2 O + N + O − 524 − 825 − 339 − 207 2.0 × 10 − 7 1.0 × 10 − 7 2.0 × 10 − 7 1.0 × 10 − 7 − 0.5 − 0.5 − 0.5 − 0.5 0 0 0 0 3 3 3 3 0 0 0 0 Rate by comparison with similar DR ( F ournier et al. 2013 ; Florescu-Mitchell & Mitchell 2006 ; Geppert et al. 2004 ) and branching ratios deduced roughly from similar reactions using Plessis et al. ( 2012 ). The important fact is that HONO is lik ely a non-ne gligible product. 9. s-H + s-NO 2 → s-HONO → HNO 2 → s-NO + s-OH − 317 − 281 − 132 0.7 0.3 0 0 0 Radical-radical reaction, well kno wn in g as phase ( Michael et al. 1979 ; Nguyen et al. 1998 ; Su et al. 2002 ). Both approach to w ards N and O atoms are attracti v e. 10. s-H + s-HONO → s-H 2 NO 2 → s-H 2 + s-NO 2 → s-NO + s-H 2 O → s-HON + s-OH − 163 − 109 − 301 + 164 1 0 0 0 2600 W e use the theoretical w ork from Hsu et al. ( 1997 ). H2 NO 2 = (HN(O)OH). Some NO + H2 O are lik ely to be produced b ut this exit channel in v olv es a transition state close to the H + HONO entrance le v el. 11. s-H + s-H 2 NO 2 → s-H 3 NO 2 → s-HON + s-H 2 O → s-HNO + s-H 2 O − 302 − 159 − 327 1 0 0 0 M06-2X /A VTZ calculations (this w ork). H3 NO 2 = HO-NH-OH. Some HNO may be produced. 12. s-OH + s-NO → s-HONO − 185 1 0 The OH + NO reaction is a radical-radical barrierless reaction ( F orster et al. 1995 ). Notes. Exothermicities of the reactions (∆ E in kJ /mol) are calculated at M06-2X /A VTZ le v el using Gaussian 2009 softw are. Definitions of α , β, γ, F0 , g, Ionpol1 and Ionpol2 can been found in W ak elam et al. ( 2010 , 2012 ): k = α × (T /300) β× exp(-γ/ T) cm 3molecule − 1s − 1, T range is 10-300K except in some cases (noted). Ionpol1: k = αβ (0.62 + 0.4767 γ (300 /T) 0 .5) cm 3molecule − 1s − 1, Ionpol2: k = αβ (1 + 0.0967 γ (300 /T) 0 .5+ (γ 2/10.526) (300 /T)) cm 3molecule − 1s − 1, F0 = exp( ∆ k/ k0 ) (≈ 1+ (∆ k/ k0 ) and F(T) = F0 exp(g |1 /T -1 /T0 |).