HAL Id: hal-01890882
https://hal.archives-ouvertes.fr/hal-01890882
Submitted on 5 Aug 2020HAL is a multi-disciplinary open access archive for the deposit and dissemination of sci-entific research documents, whether they are pub-lished or not. The documents may come from teaching and research institutions in France or abroad, or from public or private research centers.
L’archive ouverte pluridisciplinaire HAL, est destinée au dépôt et à la diffusion de documents scientifiques de niveau recherche, publiés ou non, émanant des établissements d’enseignement et de recherche français ou étrangers, des laboratoires publics ou privés.
Direct measurement of the vertical component of the
electric field from EAS
Richard Dallier, H. Carduner, Didier Charrier, L. Denis, A. Escudie, D.
García-Fernàndez, A. Lecacheux, L. Martin, B. Revenu
To cite this version:
Richard Dallier, H. Carduner, Didier Charrier, L. Denis, A. Escudie, et al.. Direct measurement of the vertical component of the electric field from EAS. 35th International Cosmic Ray Conference, Jul 2017, Busan, South Korea. pp.417, �10.22323/1.301.0417�. �hal-01890882�
PoS(ICRC2017)417
the electric field from EAS
R. Dallier∗1,3, H. Carduner1, D. Charrier1,3, L. Denis3, A. Escudie1, D. García-Fernàndez1, A. Lecacheux2, L. Martin1,3, B. Revenu1,3
1SUBATECH, Institut Mines-Telecom Atlantique - CNRS - Université de Nantes, Nantes, France
2CNRS/Observatoire de Paris, Meudon, France
3Station de radioastronomie de Nançay, CNRS/Observatoire de Paris - PSL - Université
d’Orléans/OSUC, Nançay, France
E-mail:richard.dallier@subatech.in2p3.fr
A three-fold antenna system has been installed nearby the center of the CODALEMA particle detector. Its goal is to measure the complete electric field produced by air showers, i.e. along the 3 polarizations East-West (EW), North-South (NS) and vertical. Indeed on all currently op-erating radio detection arrays, only the horizontal NS and EW polarizations or their projections are measured. This allows the vertical electric field component to be reconstructed, provided that the far-field assumption is valid, but though strong hints based on the theories of air shower radio emission tend to validate this hypothesis, it has never been verified experimentally. We present the 3D antenna and its acquisition system, and the first results obtained.
35th International Cosmic Ray Conference 10-20 July, 2017
Bexco, Busan, Korea
PoS(ICRC2017)417
Direct measurement of the vertical component of the electric field from EAS R. Dallier
1. Objectives
Since the renewal of the radio detection method for the observation of high energy cosmic ray extensive air showers (EAS) at the beginning of the 21st century, several experiments (well reviewed in [1] for example) have been set up throughout the world, and their results are widely exposed in this conference. Among them, one of the most ancient still in activity is CODALEMA, hosted by the Nançay Radio Observatory in France and described notably in [2]. Up to now, every currently operating experiment (for instance, AERA [3], LOFAR [4] or Tunka-Rex [5], and includ-ing CODALEMA) measures the electric field with antennas havinclud-ing two horizontal polarizations, along the East-West (EW) and North-South (NS) directions. The signal from each polarization is recorded as a voltage by an ADC, and knowing the complete acquisition chain characteristics (antenna transfert function, cable attenuation, amplifier gains, filter responses...), the electric field components can be derived through an unfolding procedure [6]. If most of the items composing the latter are only frequency dependent, the antenna transfert function also depends on the arrival direction of the signal and on the antenna environment, and is generally derived from simulations. To infer this antenna response, the “far field assumption” is made in the simulation codes, assum-ing that the signal received by the antenna has no longitudinal component along the shower axis, therefore the total electric field including the vertical, third component, can be reconstructed from the other two. Though current experimental results compared to EAS electric field simulations are very convincing (main component should be the transverse current due to the separation of charges in the geomagnetic field) and enhance the robustness of the radio detection method (see for exam-ple [7]), this far-field assumption has never been verified experimentally. It is worth noticing that, in the results of every EAS electric field simulation codes, based on the calculation of the contri-bution of each individual shower particle along its path to the global electric field, the longitudinal component is present, though most of the time negligible. By confirming or rejecting the far field hypothesis, measuring the complete electric field could help reaching a better accuracy, notably on the conversion of the electric field value to an energy. It could also help recovering the arrival direction of the signal with a single three-fold antenna, provided that accurate determination of the 3 polarization components is made. Several attempts have been made to measure the vertical polarization of the electric field, for example on LOPES in 2011 [8] and AERA in 2014 (internal communication). However, none has given convincing results, partly due to the mechanical diffi-culty to use as efficient antennas as in the horizontal plane. Hence, a revision of the concept of the three-dimensional measurement of the electric field should be done and is engaged in the EXTASIS project hosted by the CODALEMA experiment. The main goal of EXTASIS is to measure the low frequency (≤ 10 MHz) contribution of EAS and possibly detect the so called “Sudden Death” con-tribution, the expected radiation electric field created by the particles that are coherently stopped upon arrival to the ground [9]. Regarding the large wavelengths associated to low frequencies with respect to the distances involved in an antenna array, it is also of primary importance to properly define and calculate the near field contribution of the electric field at all frequencies, as it is done in [10]. In that respect, EXTASIS aims at giving the most global and precise view on the prop-erties of EAS electric field from 1 to 200 MHz and, associated to CODALEMA, at defining the experimental limits of the radio detection method.
PoS(ICRC2017)417
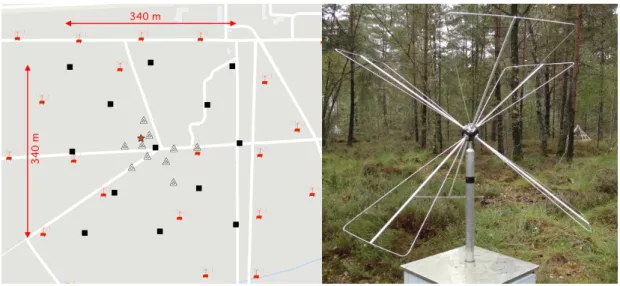
2. Experimental setup and data setThe CODALEMA/EXTASIS experiment is described in [2]. It is composed of 5 arrays of detectors, among them 3 are of main interest for the work described in this paper: the particle detector array, the array of 57 standalone radio detectors and the cabled “compact array” in the middle of the particle detector (Fig.1, left).
Figure 1: Left: zoom on the map of CODALEMA (North on top). Red symbols: some of the 57 CO-DALEMA autonomous radio detection stations; black squares: 13 scintillators; white triangles: 10 antennas
of the compact array; orange star: “tripole” antenna. See [2] for more explanations. Right: the tripole
antenna. Each Butterfly antenna is rotated twice to form a direct trihedron inclined by 45◦.
Recently, a three-fold antenna system has been installed nearby the center of the particle de-tector. It is called “Tripole” antenna. In previously cited attempts to detect the vertical electric field, the antenna was either made of 3 simple dipoles (Lopes3D) or of Butterfly, double plane-polarization antennas to which a single monopolar antenna was added (AERA). In all cases, none of these vertical antennas had good enough performances and sensitivity. We chose to reconsider the problem and to use 3 regular Butterfly antennas equipped with the LONAMOS LNA, which have shown, notably on CODALEMA and AERA, their very good performances [6,7]. The main difficulty lies in the mechanical holding of such a triple antenna system along the defined polariza-tion axes. Therefore a special holding system has been developed, on which two rotapolariza-tions of 45◦ and 54.75◦are applied around the X (EW) and Y (NS) axes respectively (Fig.1, right). Triggered by the particle detector, the 3 signals are recorded and dated at a nanosecond accuracy, with the same type of electronics as for the scintillators (2.56 µs record length, 1 GS/s, 12 bits ADC). This ensures that the Tripole antenna signals, if any, are strongly correlated to particle EAS, though some accidental detection are possible, but extremely rare in the considered time window.
The operation mode of the standalone antenna (SA) and surface detector (scintillators, SD) arrays are described in [7] and [2], while the one of the compact array (CA) is more detailed in [11] (note that the “LWA” CA antennas described herein, though different in shape from the SA “Butterfly” ones, are equipped with the same LONAMOS Low-Noise Amplifier (LNA) described
PoS(ICRC2017)417
Direct measurement of the vertical component of the electric field from EAS R. Dallier
in [12] and have the same detection performances). We will focus on these 3 subsystems to build the data set for the analysis of the Tripole antenna data. The latter are obtained on each SD trigger, which are dated for further comparison with the SA events. The CA is also externally triggered by the SD, and its signals are recorded on a longer time base (6.4 µs at 400 MS/s) with the same type of ADC as for the other instruments. For the SA data analysis purposes of [7], we have selected a small subset of 64 events self-triggered by the SA with a minimal multiplicity of 4 and a maximal multiplicity of 48 (number of SA fired), and within ±5 µs from a SD trigger. These events are spread over the whole array, thus it is not expected that they all present a CA counterpart: indeed, among them, only 34 exhibit a clear signal in the ten antennas of the CA in at least one polarization, and finally 24 of these events with also a clear signal in at least two Tripole antenna polarizations are selected as our data set. The Tripole being located very close to the CA (surrounded by 4 of its antennas, see Fig.1), these 24 events will be compared to the ones of the CA in order to derive some properties of the recorded signals.
3. Compact Array antenna signal unfolding
As mentioned before, it is possible to recover the vertical component of the electric field vector knowing its X and Y components, and assuming a far field propagation and the knowledge of the antenna gain pattern. Based on NEC-2 simulations of the LWA antenna including its environment, a vector equivalent length (VEL) matrix was calculated in the frequency domain for each direction of an incoming electric field ~Eθ ,φ in a hemisphere with a resolution angle of 1
◦and a [10-199] MHz frequency range. This VEL, noted ~L(θ , φ ), is defined as the ratio of a vector induced voltage over a 50 Ω LNA terminal load and the vector value of the incoming electric field defined in a spherical coordinate system (Eq.3.1) for a given θ and φ direction. The LWA antenna is centered on the Z-axis of a cartesian coordinate system. One dipole is aligned on the X -axis (EW) and the other on the Y -axis (NS). The following spherical coordinate system convention is adopted: θ is the zenith angle, counted from the Z-axis, and ϕ is the azimuth angle, counted anticlockwise from the X -axis. The VEL fully characterizes the active antenna since it depends both on the antenna radiator directional pattern and on the LNA transfer function. It is worth noting that two VEL matrix are performed for any crossed-polarization antenna, one for the dipole along the X -axis ~LX(θ , φ ) and the other for the Y -axis ~LY(θ , φ ). With assumed far field propagation conditions, the
radial component of the incoming electric field ~Eris null and ~Eθ ,φ is written:
~E(θ,φ) = Eθ(θ , φ )~eθ+ Eφ(θ , φ )~eφ (3.1)
The VEL of the X -axis antenna is written for the same spherical coordinate system as: ~LX
(θ , φ ) = LXθ(θ , φ )~eθ+ L X
φ(θ , φ )~eφ (3.2)
The voltage UXinduced on the terminal load of the LNA connected to the X -axis antenna is the scalar product of ~E(θ , φ ) by ~LX(θ , φ ). With LXθ, LXφ the VEL matrix data for X -axis, UX(θ , φ ) can be calculated (Eq.3.3) for any electric field in all directions for both frequency and time domain:
UX(θ , φ ) = ~E(θ , φ )~LX(θ , φ ) = Eθ(θ , φ )L X θ(θ , φ ) + Eφ(θ , φ )L X φ(θ , φ ) (3.3) 4
PoS(ICRC2017)417
Eq.3.2and Eq.3.3are the same for the Y -axis antenna replacing X by Y . In practice, the signalare recorded in both EW and NS polarizations in volts as a function of time. Applying the unfolding algorithm to these time series under the far-field hypothesis gives the Eθ and Eφ components of the total field ~Ein V.m−1, with Erfixed at 0. The cartesian components of the electric field along EW, NS and vertical axis (X , Y and Z) are simply obtained with
EX EY EZ =
sin θ cos φ cos θ cos φ − sin φ sin θ sin φ cos θ sin φ cos φ
cos θ − sin θ 0 Er Eθ Eφ (3.4)
where θ and φ are the zenith and azimut angles of the shower axis respectively.
4. Recovering Tripole antenna polarizations
The Tripole antenna dipoles are not oriented directly in the (X , Y , Z) directions, but experi-enced 2 rotations around X and Y axis. For sake of simplicity, we have chosen to align one of the dipoles along the EW direction, though not in the horizontal plane (see Fig.1). The two other dipoles are thus oriented in NW-SE and NE-SW directions, and if we apply the inverse of the ro-tation matrix made of the combination of the three roro-tations of angles (45◦, 54.75◦and 0◦) to this Tripole base (EW, NW-SE, NE-SW), we recover the Tripole signal in the (X , Y , Z) = (EW, NS, Vertical) base. This would be a satisfactory first step of an unfolding procedure if the three dipole antenna patterns were the same (provided that, as it is indeed the case, the LNA, cables, filters and ADC have also the same response for each dipole acquisition chain). Currently there are no NEC-2 simulations of the Tripole antenna, thus no possibility to recover the VEL of each dipole. As a first estimate, we will consider the following:
• same acquisition chain for each dipole of the Tripole, from the LNA down to the ADC;
• at low frequencies in the frequency range considered (i.e ≤ 80 MHz), the gain patterns of the dipoles are the same and slowly depend on the frequency and on the arrival direction of the shower. This is a reasonable hypothesis, based on previous simulations of Butterfly antennas, considering the small size of the antennas versus wavelength (short dipole hypothesis);
• above ' 100 MHz, important side lobes appear in the gain pattern, which becomes highly frequency and direction dependent: the sensitivity to (θ , φ ) is strong and the 3 dipoles can not be considered as equivalent anymore;
• the simple basis transformation from (EW, NW-SE, NE-SW) to (EW, NS, Vertical) should thus be considered as valid in the low frequency regime, allowing reasonable comparison of the polarization patterns between the Tripole voltages and the recovered electric field components by the CA antennas on the same events.
PoS(ICRC2017)417
Direct measurement of the vertical component of the electric field from EAS R. Dallier
5. Results and comparison 5.1 Example of Tripole event
An example of event recorded by the Tripole antenna is shown on Fig.2. Here, the raw signals have been transformed in the (EW, NS, Vertical) base and later on filtered within the [24-82] MHz frequency window.
Figure 2: A Tripole event in the (EW, NS, Vertical) polarizations, filtered in [24-82] MHz. The signal is clearly visible on the three polarizations.
On Fig. 3, top, the polarization pattern for this event is presented for the three polarization combinations, together with the prediction in the case of a pure geomagnetic event (where charge excess contribution is expected to be null). Regarding the arrival direction of the event (θ ' 49◦, φ ' 120◦ counted counterclockwise from East) and the geomagnetic vector angle direction in Nançay (θB = 27.1◦, φB ' 270◦ (South)), such an event is not expected to exhibit a significant charge excess contribution and its polarization should follow the geomagnetic prediction, which seems indeed to be the case. On Fig.3, bottom, the polarization pattern for the closest Compact Array antenna is traced for the same event, after applying the unfolding procedure. Both patterns are very similar for this example, which would support the far field hypothesis. It is worth noting that all the Compact Array antennas exhibit the same pattern for this event, as expected due to the small extent of the array and the event arrival direction.
5.2 Polarization pattern over the whole data set
The same study has been led over the whole data set of 24 events, from which 2 outliers were removed. As a summary, the average polarization angles of the ten antennas of the CA are plotted versus the ones of the Tripole for the NS/EW direction, and compared to the predicted geomagnetic angle for both instruments in the 3 directions (NS/EW, Vertical/NS and EW/Vertical). For this set of events, the arrival directions are spread over all the azimuts and zenith angles, without any cut
PoS(ICRC2017)417
Figure 3: Top: the polarization pattern obtained for the Tripole event of Fig.2. In orange, the polarization
ellipses in the three directions. The black line indicates the geomagnetic prediction orientation for the event arrival direction, under the far-field emission hypothesis (~E = ~v ×~B). Bottom: in blue, the polarization pattern for the closest Compact Array antenna, once unfolded in the same frequency band ([24-82] MHz)). The black lines are the same as above, orange line stands for the polarization direction of the tripole.
Figure 4: Left: the NS/EW polarization angles for the 22 event data set: average of the CA antennas angles vs the Tripole angle. The vertical error bars are the standard deviation of the angles over the 10 CA antennas. The black dots stand for the geomagnetic prediction. Right: Comparison to the predicted geomagnetic polarisation angles in the 3 directions for the 22 event data set. Top: Tripole vs prediction,
PoS(ICRC2017)417
Direct measurement of the vertical component of the electric field from EAS R. Dallier
thus no estimate of the possible charge excess contribution. At first glance, if one considers the NS/EW polarization only, a clear correlation is found between both instruments and also with the prediction (Fig.4). The correlation is less clear - but still here - for the EW/Vertical polarization angles, even if an instrumental inversion when connecting the LNA of one of the Tripole dipoles leads to opposite trends. This is not essential, because the expected linear trend is still visible. However, it disappears almost completely for both instruments (CA and Tripole) when considering the Vertical/NS polarization, which should by construction be close to the θB component of the magnetic field vector (i.e ' 27◦in Nançay). This unexpected result supports further investigations with a larger data set, cuts on the event arrival direction and different filtering bandwidth in order to verify the frequency dependence of the Tripole gain pattern.
6. Conclusion and outlook
A three-fold polarization antenna has been installed in the middle of the particle detector of the CODALEMA experiment, and is surrounded by a small extent array of well known, externally triggered antennas. At the current stage of development, this so-called Tripole antenna already gives convincing results, being able to detect the EAS radio signal components in a complete, three axis orthogonal base. However, more investigations are required, notably on the Tripole antenna simulations, in order to properly unfold the voltage signals into electric field components. A larger study over thousands of events is in preparation, aiming at disentangling the various EAS electric field contributions and finally conclude about the validity - or not - of the widely used far field hypothesis in radio detection of cosmic ray air shower events.
We thank the Région Pays de la Loire for its financial support to the Astroparticle Group of Subatech and in particular for its contribution to the EXTASIS experiment.
References
[1] F. G. Schröder. Progress in Particle and Nuclear Physics 93 (2017) 1-68.
[2] R. Dallier et al., proceedings of 34thICRC, The Hague, The Netherlands(2015) and proceedings of
7thARENA, Groningen, The Netherlands(2016); B. Revenu et al., these proceedings (2017).
[3] The Pierre Auger Collaboration, Phys. Rev. D 93 (2016) 122005.
[4] P. Schellart et al. (LOFAR Collaboration), A&A 560 A98 (2013) [arXiv:1311.1399]. [5] W. D. Apel et al., Phys. Lett. B 763 (2016) 179.
[6] The Pierre Auger Collaboration, JINST 7, P10011 (2012). [7] L. Martin et al., these proceedings (2017).
[8] D. Huber et al., Lopes collaboration, in proceedings of 32ndICRC, Beijing, China(2015).
[9] A. Escudie et al., these proceedings (2017).
[10] D. García-Fernàndez et al., these proceedings (2017). [11] A. Lecacheux et al., these proceedings (2017).
[12] D. Charrier, 6thARENA, Annapolis, USA(2014), https://hal.archives-ouvertes.fr/hal-01114546.
![Figure 2: A Tripole event in the (EW, NS, Vertical) polarizations, filtered in [24-82] MHz](https://thumb-eu.123doks.com/thumbv2/123doknet/14755730.582402/7.892.256.641.291.618/figure-tripole-event-ew-vertical-polarizations-filtered-mhz.webp)

