Ellen Dunning Brown
B.A., Princeton University (1979)
SUBMITTED IN PARTIAL FULFILLMENT OF REQUIREMENTS FOR THE DEGREE OF
DOCTOR OF PHILOSOPHY
THE
at the
MASSACHUSETTS INSTITUTE OF TECHNOLOGY and the
WOODS HOLE OCEANOGRAPHIC INSTITUTION August, 1984
c Ellen D. Brown 1984
The author hereby grants to M.I.T. and W.H.O.I. permission to reproduce and to distribute copies of this thesis document either in whole or in part.
Signature of Author
Department of Earth, Atmospheric, and Planetary Sciences, Massachusetts Institute of Technology and the Joint Program
in Oceanography, Massachusetts Institute of Technology/Woods Hole Oceanographic Institution. Auoust. 1984.
Certified by
Thesis Supervisor. Accepted by
Chairman, Joint Committee for Physical Oceanography,
Massachusetts Institute of Technology/Woods Hole Oceanographic Institution.
IT
S
WNES
EDDY FORCING OF THE MEAN CIRCULATION IN THE WESTERN NORTH ATLANTIC
by Ellen D. Brown
Submitted to the Joint Committee for Physical Oceanography, Massachusetts Institute of Technology and
Woods Hole Oceanographic Institution, in August, 1984, in Partial Fulfillment of the Requirements
for the Degree of Doctor of Philosophy
ABSTRACT
This thesis addresses several aspects of the problem of determining the effect of the low-frequency eddy variability on the mean circulation of the Western North Atlantic. A framework for this study is first established by scale analysis of the eddy and mean terms in the mean momentum, vorticity, and heat balances in three regions of the Western North Atlantic -- the northern recirculation, the southern recirculation, and the mid-ocean. The data from the last decade of field experiments suggest somewhat different conclusions from the earlier analysis of Harrison (1980). In the momentum balance we
con-firm that the eddy terms are negligible compared to the lowest order mean geo-strophic balance. The eddy term may be an 0(1) term in the vorticity balance only in the northern recirculation region where the mean flow is anisotropic.
In the mean heat balance, if the mean temperature advection is scaled using the thermal wind relation, then the eddy heat flux is negligible in the mid-ocean, but it may be important in the recirculation areas. For all the balances the eddy terms are comparable to or an order of magnitude larger than the mean
advective terms. We conclude from the scale analysis that the eddy field is most likely to be important in the Gulf Stream recirculation region.
These balances are subsequently examined in more detail using data from the Local Dynamics Experiment (LDE). Several inconsistencies are first shown in McWilliams' (1983) model for the mean dynamical balances in the LDE. The sampling uncertainties do not allow us to draw conclusions about the long-term dynamical balances. However, it is shown that if we assume that the linear vorticity balance holds between the surface and the thermocline for a finite record, then the vertical velocity induced by the eddy heat flux divergence is non-zero.
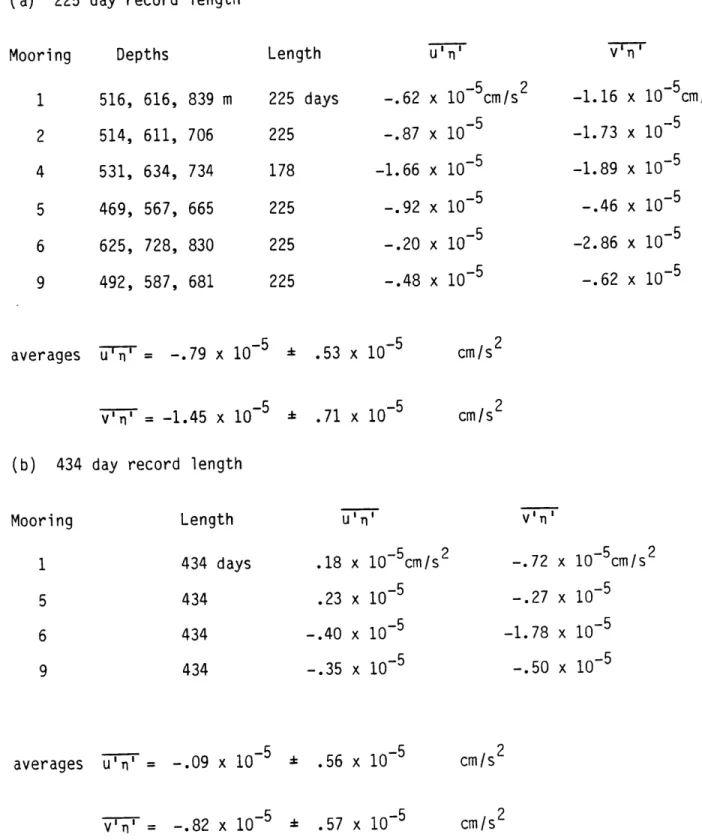
The local effect of the mesoscale eddy field on the mean potential vor-ticity distribution of the Gulf Stream recirculation region is determined from the quasigeostrophic eddy potential vorticity flux. This flux is calculated by finite difference of current and temperature time series from the Local Dynamics Experiment. This long-term array of moorings is the only experiment-al data from which the complete eddy flux can be cexperiment-alculated. The totexperiment-al eddy flux is dominated by the term due to the time variation in the thickness of isopycnal layers. This thickness flux is an order of magnitude larger than the relative vorticity flux. The total flux is statistically significant and directed 2170T to the southwest with a magnitude of 1.57 x 10⁻⁵ cm/s2
The direction of the eddy flux with respect to the mean large scale potential vorticity gradient from hydrographic data indicates that eddies in
this region tend to reduce the mean potential vorticity gradient. The results are qualitatively consistent with numerical model results and with other data from the Gulf Stream recirculation region. We find that the strength of the eddy transfer in the enstrophy cascade is comparable to the source terms in the mean enstrophy balance. The Austauch coefficient for potential vorticity mixing is estimated to be 0(107cm2/sec). An order of magnitude estimate of the enstrophy dissipation due only to the internal wave field shows that other processes must be important in enstrophy dissipation.
The measured eddy potential vorticity fluxes are compared to the linear stability model of Gill, Green, and Simmons (1974). An earlier study (Hogg, 1984) has shown agreement between the empirical orthogonal modes of the data and the predicted wavenumbers, growth rates, and phase speeds of the most un-stable waves. However, we show substantial disagreement in a comparison of the higher moments -- the eddy heat and potential vorticity fluxes. Because the critical layer of the model is located near the surface, the model pre-dicts that most of the eddy potential vorticity and eddy heat flux should occur within about 300 meters of the surface. The data show much greater deep eddy heat flux than predicted by the model. It is suggested that the unstable modes in the ocean have a longer vertical scale because of the reduction in the buoyancy frequency near the surface.
The evidence for in situ instability is also examined in the decay region of the Gulf Stream from an array of current and temperature recorders. Although there is vertical phase propagation in the empirical orthogonal modes for some of the variables at some of the moorings, there is not much evidence for a strong ongoing process of wave generation.
Thesis Supervisor: W. Brechner Owens, Associate Scientist Department of Physical Oceanography Woods Hole Oceanographic Institution
Table of Contents Page No. Abstract CHAPTER 1. CHAPTER 2. Introduction
Scale Analysis Revisited: The eddy contribution to the mean dynamical balances ...
I. Introduction II. The a) b) c) III. The a) b) c) IV. The a) b) c)
Mean Momentum Balance . Mid-Ocean ... Array II ... LDE ...
Mean Vorticity Balance . Mid-Ocean ... Array II ... LDE ... Mean Heat Mid-Ocean Array II LDE Balance ...
V. Summary and Conclusions .... Appendix A
Table A.1: Table A.2:
CHAPTER 3.
Near field statistics from POLYMODE Array II, LDE, and GSE ... Mid-ocean statistics from POLYMODE Array I and III Clusters A and B Eddy Potential Vorticity Fluxes in the
Gulf Stream Recirculation Region ... I. Introduction
II. Methodology: the eddy potential vorticity flux .... III. Data and measurements ... IV. The measured eddy potential vorticity flux ... V. Discussion ...
CHAPTER 4.
CHAPTER 5.
CHAPTER 6.
The Mean Dynamical Balances Local Dynamics Experiment
in the ... I. Introduction ... II. An alternate model ... III. Data and statistical uncertainties IV. A direct comparison with the
kinematic boundary condition ... V. The mean dynamical balances from
the thermocline to the surface ... VI. Discussion ...
A Stability Model Comparison of the Observed Eddy Potential Vorticity Flux ... I. Introduction
II. Hypothesis
III. The GGS (1974)/Hogg (1984) instability IV. The model potential vorticity flux ... V. The normalized eddy heat flux ... VI. Discussion The V Eddy I. II. III. IV. V.
ertical Structure of the Mes
Field in the Gulf Stream Ext Introduction
Hypothesis Methodology
Data Description ... Data Analysis
a) Velocity veering modes
.oeooo. ooooooo oeooeoo model eemmmee mmeeeem memeeem .. . .0 .. . .0 oscal e ension ... ... ... ...
Independent velocity and temperature modes ... Cross-spectral velocity and temperature modes..
101 105 113 113 115 116 119 121 124 134 134 135 138 140 143 144 148 150
VI. Discussion Appendix B Concluding Remarks ...
References ...
Acknowledgements ...
Temperature corrections for the GSE data.
.... . ... . ... ... . . 151 164 171 175 182
CHAPTER 1
INTRODUCTION
Much of the oceanographic research during the last decade has been di-rected towards understanding the importance of the mesoscale eddy field in the time-mean circulation. The term mesoscale eddy is defined here as the low-frequency variability at periods longer than one day. Even with more than a decade of field experiments, there has been little direct evidence that eddies contribute to the mean dynamical balances. Most of the data analyses have ex-amined only the wave kinematics and energetics. The eddy statistics have been calculated from time series of current and temperature from moored arrays in the western North Atlantic deployed as part of the POLYMODE program. Analyses of data from these experiments (MODE, 1978; Schmitz, 1976, 1978; Dickson, 1983; Fu et al., 1982) have established only the general distribution of eddy energy and space-time scales. These studies show that the eddy energy level increases westward along 280N from the center of the North Atlantic basin towards the Gulf Stream where it is comparable to the mean energy near the western boundary current. However, despite the intensity of the eddy field, the role of eddies in the dynamics of the mean circulation still has not been determined. In order to study this problem, it is necessary to first examine the magnitude of the eddy fluxes in the mean heat, vorticity, and momentum balances.
Several studies have suggested that the eddy momentum flux or Reynolds stress divergence may contribute to the mean momentum balance in certain
convergence of momentum fluxes induced by topographic Rossby waves along the continental rise at 700W could cause mean flow accelerations of 1 cm/sec over 10 days. Webster's (1965) analysis of the offshore flux of downstream eddy momentum in the surface Gulf Stream indicates a transfer of eddy to mean kin-etic energy sufficient to double the mean kinkin-etic energy in 21 days. Measure-ments (Schmitz, 1981) from the POLYMODE Array II moorings along 550W show that the sign of u'v' changes from positive to negative as the Gulf Stream axis is crossed from the south. This meridional distribution of momentum fluxes would tend to accelerate the eastward Gulf Stream and might account for the observed downstream increase in transport. The observations are also consistent with the distribution of Reynolds stresses in numerical model experiments of the wind-driven circulation (Schmitz and Holland, 1982).
Although these types of comparisons based on Reynolds stress distribu-tions suggest mean flow acceleration by the eddies, the net effect of the mo-mentum flux distribution remains ambiguous because the fluxes can also produce
an ageostrophic flow. This ambiguity can be most easily seen by examining the momentum equation for a zonally-averaged mean flow (denoted by an overbar). To zeroth order in a Rossby number expansion the mean flow is geostrophically balanced. The eddy Reynolds stress term u'v' enters the first order momentum
balance:
au o- au'v'
o fv =
at ay
where the subscripts denote the order in Rossby number expansion. Comparisons have been made between this balance and the locally zonal Gulf Stream along 550W as measured in POLYMODE Array II although the analogy is not exact
because the observational data are time-averaged instead of zonally-averaged. From the Array II data a typical value for the Reynolds stress at 600 m depth is u'v' ~ 20 cm2/s2 and the eddy statistics vary over a length scale of about 300 km. A balance between the eddy divergence term and the mean flow acceler-ation would then imply a 21 cm/sec increase in the mean flow over a period of one year. This would have a substantial effect on the mean zonal transport. However, the eddy term could equally be balanced by a northward ageostrophic flow of only v1 = .01 cm/sec, a value which is below the significance level of present measurements. Although the vertically-integrated ageostrophic north-ward velocity must vanish over the basin, it is not possible to determine the effect of Reynolds stresses on the momentum balance from point measurements. Therefore, arguments about the effect of eddy Reynolds stresses on the Gulf Stream flow in this region remain speculative.
Budget analyses of mean and eddy kinetic and potential energy do not suffer from the type of ambiguity inherent in the momentum balance. Bryden
(1982) calculated the balances from the current meter mooring array in the Local Dynamics Experiment located in the Gulf Stream recirculation region. For a 225 day period during the experiment he found a loss of eddy kinetic energy through an up-gradient flux of eddy momentum and a conversion of
avail-able potential energy to eddy potential energy by an eddy heat flux directed down the mean temperature gradient. The results are consistent with the pro-duction of eddy energy by baroclinic instability in the mean flow, although
the combined energy conversion is not significantly different from zero. Moreover, these conversions do not indicate local energy exchange between the mean and eddy fields because they are not balanced by production of mean
be deduced from this type of analysis because the pressure-work terms cannot be estimated and because the eddy and mean energy conversions do not necessar-ily balance for open ocean regions within the model basin.
Because of the scarcity of observational data, ocean modelers have ad-dressed the "eddy problem" by calculating mean and eddy balances from numeric-al eddy-resolving genernumeric-al circulation models. Eddy activity in these models has been evaluated using energy budgets (Robinson et al., 1977; Holland and Lin, 1975; Holland, 1978; Harrison and Robinson, 1978) computed as area-integrals over the model basins. Because the model flows are inhomogeneous, it is necessary to compute the energy budgets in subregions of the model bal-ances, in order to identify regions where eddies may be transferring energy to the mean flow. Harrison and Robinson (1978) have shown that the conversions between the eddy and mean energy are meaningful only if the regions are chosen so that there is no divergence of eddy energy flux across the open boundaries. The eddy production of mean kinetic energy balances the conversion of mean kinetic to eddy kinetic energy only for regions where the flow satisfies this condition. Moreover, although the model results are useful for guiding the interpretation of ocean data, the direct application of these model studies is not clear given the dependence of the results on the specific model assump-tions (Harrison, 1979).
More recent numerical studies (Holland and Rhines, 1980; Harrison and Holland, 1981) have concentrated on the dynamical role of eddies in the mean vorticity budgets. These models emphasize the importance of the eddy poten-tial vorticity flux. The mesoscale eddies contribute to the mean vorticity balance through the potential vorticity flux - a combination of lateral momentum transfer and vertical pressure drag. According to the theory of
eddy-driven mean flows (Rhines and Holland, 1979), the direction of the eddy potential vorticity flux relative to the mean potential vorticity gradient
indicates regions of growing or decaying eddy enstrophy. Holland and Rhines (1980) demonstrate this in their analysis of potential vorticity balances in a two-layer quasigeostrophic eddy resolving general circulation model. The
model calculation shows that eddies gain energy by baroclinic instability from the mean flow in the Gulf Stream recirculation region of the upper layer. This conversion is characterized by a down-gradient flux of eddy potential vorticity. Because the model has no built-in stress between the fluid layers, the deep circulation is forced by the divergence of the eddy flux in the upper
layer.
Experience with numerical model flows has shown that one must be cau-tious in interpreting point measurements of eddy fluxes. In Harrison and
Holland's (1981) model, the magnitude of point estimates changed by as much as 100 percent when the averaging time was doubled from five to ten years. The
spatial variation of the fluxes in the model of Holland and Rhines (1980) ranged from scales of 0(100 km) for the relative vorticity flux to 0(1000 km) for the thickness flux. Modelers have concluded from numerical experiments
that these fluxes are statistically reliable only if they are area-integrated. At present, very little is known about the variation of these vorticity fluxes
in the ocean. The only published observation (Harrison, 1980) is that the second order velocity statistics in POLYMODE Array II vary on spatial scales of 0(100 km). Thus, part of the motivation for this analysis is to assess the reliability of eddy potential vorticity flux measurements in the ocean.
The first chapter of this thesis is a scale analysis of the mean and eddy terms in the time-mean momentum, vorticity, and heat balances in three
regions of the North Atlantic. A previous scale analysis (Harrison, 1980) of the mean dynamical balances indicated that the eddy term might be important only in the mean heat balance of the mid-ocean. Chapter 2 of this thesis is a detailed reexamination of this scale analysis using the more extensive data set available from the last ten years of POLYMODE experiments. We show that the eddy term may be lowest order in the vorticity balance of the northern recirculation region, where the mean flow has a short cross-stream length scale and large zonal speed. In the mean heat balance the eddy term is not important in the mid-ocean, but it may be a dominant term in the Gulf Stream recirculation region where the eddy heat fluxes are significant.
Chapter 3 of this thesis is a calculation of the eddy potential vortic-ity flux in the Gulf Steam recirculation region. As discussed above, recent theoretical models of the general ocean circulation have emphasized the effect of the eddy potential vorticity flux on the time-averaged vorticity field. Oceanic measurements of the eddy potential vorticity flux require long time series from an array of instruments which spatially resolves the mesoscale eddy field. The only data satisfying these requirements were recorded during the Local Dynamics Experiment in the Gulf Stream recirculation region. This region has been identified as a likely site for the generation of mesoscale waves through baroclinic instability of the mean flow. These measurements are used to estimate the flux of eddy potential vorticity and the conversion to eddy enstrophy from the large-scale vorticity field. The results are shown to be consistent with theoretical predictions of the potential vorticity flux due to unstable baroclinic waves.
The mean dynamical balances in the Local Dynamics Experiment are reexam-ined in Chapter 4. In particular, we show that a previous model (McWilliams,
1983) for the vertically-integrated mean vorticity balance is not consistent with the vertical velocity predicted by the mean heat equation. Our analysis suggests that although the eddy term does not seem important in the vorticity balance of the LDE, it may have an effect on the mean heat balance. While the sampling requirements prevent us from drawing conclusions about the long-term mean dynamical balances, the finite records are used to test the consistency of a linear mean vorticity balance.
The fifth chapter compares the predictions of a numerical stability model with the observed eddy potential vorticity and heat fluxes in the Array
II region. A remarkable agreement has been shown previously by Hogg (1984) between the wavelengths, phase speeds, and growth rates predicted by a linear stability model of Gill, Green, and Simmons (1974) and the empirical orthog-onal modes from the Array II data. However, the model predicts that the
largest phase change and heat flux in the growing modes should occur at depths shallower than the instruments. We show that the surface intensification of the higher moments from the model is not supported by the observations. Since the vertical scale of the modes is proportional to the buoyancy frequency, the discrepancy may be due to the reduction in stratification near the surface.
Finally in Chapter 6 we discuss the vertical structure of the mesoscale eddy field in the Gulf Stream Extension Region located near 40°N, 450W, down-stream of the maximum velocities in the down-stream. The empirical modes are computed in frequency bands from the velocity and temperature cross-spectral matrix. Although there is upward phase propagation in some of the variables at a few of the moorings, there is not much evidence for strong in situ wave generation.
The eddy-mean flow problem is the uniting theme of the chapters of this thesis. The problem is examined from the standpoint of the mean dynamical balances and from the potential vorticity flux and its importance in stability theory. Over the last decade it has become clear that the meager observation-al base is insufficient to clearly establish direct eddy forcing of the mean circulation. Although the present observational data are nowhere sufficient to solve the "eddy problem", the topics addressed in this thesis imply that eddies do have a significant effect on the time-mean flow in the Gulf Stream recirculation region.
CHAPTER 2
SCALE ANALYSIS REVISITED:
THE EDDY TERMS IN THE MEAN DYNAMICAL BALANCES
2.1. INTRODUCTION
A primary objective of research on oceanic eddies is to assess their effects on the mean dynamical balances. Since the data base is inadequate to fully answer this question, scale analysis has been used to estimate the rela-tive importance of the eddy terms. Harrison (1980) examined the magnitude of the eddy terms in the quasigeostrophic mean momentum, vorticity, and heat bal-ances using scale estimates from the MODE and POLYMODE I and II mooring array data sets. Two flow regimes were considered -- a near field of the Gulf Stream between 35°N and 38°N along 55°W a few hundred kilometers south of the stream axis and a mid-ocean region along 2S°N to the east of 700W. He con-cluded from these data that the eddy terms are at least an order of magnitude smaller than the mean contributions to the momentum and vorticity balances in both regions. In the mean heat balance the eddy heat flux divergence was found to be a dominant term only in the mid-ocean. Although there were large uncertainties in the scale estimates, this initial study concluded that the eddy terms are not important in the mean dynamical balances in most regions of the ocean.
Much additional data have been collected from the North Atlantic during the last five years since the experiments used in Harrison's analysis. There-fore, it seems timely to review the scale estimates after a full decade of field research. Because of instrumentation difficulties there still has not
been an array of moorings deployed in the most intense part of the Gulf Stream. Therefore, this analysis is again limited to the near field and mid-ocean
regions. However, the new data suggest that the three mean dynamical balances -- momentum, vorticity, and heat -- should be evaluated in three distinct oceanic flow regimes. This chapter examines the magnitude of the eddy terms in each of these balances for each of these regions.
The majority of the instrument arrays have returned data from the larg-est geographical flow regime, the gyre interior. Data arrays from this region include MODE, POLYMODE I, and the southernmost mooring (07) from POLYMODE II which were examined by Harrison (1980). Since that time, the geographic vari-ation in the mid-ocean mean and eddy energy has been further explored in the POLYMODE Array III Clusters A and B deployed eastward along 28°N from the site of Array I (Figure 2.1). These clusters were located on the flanks of the Mid-Atlantic Ridge at 280N, 480W (Cluster A) and 270N, 41°W (Cluster B) from May 1977 to May 1978 with an additional 16 months from the site moorings. All of these data suggest that throughout the mid-ocean the eddy and mean energy are comparable. The mean flow has a broad length scale which is also compar-able to the scale of variation of the eddy statistics.
A second distinct flow regime has been identified in data from POLYMODE Array II along 55°W between 35°N and 380N. The mean position of the Gulf Stream at this longitude is approximately 200 km from the northernmost mooring with instruments at thermocline depth. Two characteristics of the mean flow
in this region may have important consequences for the mean dynamical balances. First, the Array II measurements and the float data from this Gulf Stream re-circulation region show an anisotropic mean flow with bands of intense zonal flow in reversing directions. It has been suggested (Schmitz, 1976) that
eddies drive the westward recirculating flow in this region south of the Gulf Stream. Therefore, for the scale analysis it is necessary to include the
an-isotropy of the mean flow in order to obtain correct estimates for each dynam-ical balance. The second important characteristic of this region is the pres-ence of baroclinic instability of the mean flow (Hogg, 1984). The eddy heat fluxes generated by the instability process could have an important effect on the mean heat balance. In quasigeostrophic numerical models (Harrison, 1980) the vertical velocity in the recirculation region is driven by the divergence of the eddy heat fluxes. Although the scale analysis cannot prove that either of these processes occurs, it is useful to check their plausibility.
The third region identified in this chapter as a distinct mean flow regime contains the POLYMODE Local Dynamics Experiment (LDE) (310N, 69.50W). Like Array II the LDE was deployed in the Gulf Stream recirculation region,
but some characteristics of the mean flow are significantly different. The eddy heat fluxes are comparable to those observed in Array II, but the mean
flows are more nearly isotropic and less intense. The eddy field is also less energetic by almost a factor of 3. When compared to the Array II data, one would be inclined to categorize the LDE as part of the mid-ocean regime.
How-ever, the LDE is also distinctly different from the MODE region located only 300 km to the southwest (280N, 700W). The eddy field in the LDE is a factor of 3 more energetic than that in the MODE data. This is true for the LDE record averages as well as for the period excluding the intense baroclinic jets (Owens et al., 1982). In addition, the heat fluxes in the LDE are sig-nificantly non-zero, unlike those in the mid-ocean. Because the LDE data dif-fers from both the Array II and mid-ocean observations, it is identified as a third distinct flow regime.
The other data set, the Gulf Stream Extension (GSE), discussed later in this thesis (Chapter 6) was centered at (400N, 450W), downstream of the maxi-mum Gulf Stream surface velocities. The GSE measurements show some similari-ties to the PMII data. For example, the eddy kinetic energy and its spatial decay are comparable in both regions. The eddy heat fluxes in the GSE are also comparable but with large statistical uncertainties. However, the GSE region differs from the Array II region because the mean flow is not well determined. It is unclear from the available surface drifter and satellite data whether the Gulf Stream at this location is a broad system of branching currents or an unstable jet which meanders around the Grand Banks. Although the GSE array does not resolve the mean flow in this region, it provides scale information about the eddy field. Thus, the data from the GSE will be used only to compare the magnitude of the eddy contribution in the balances.
Additional data from surface drifters (Richardson, 1983) and SOFAR floats (Owens, 1984) provide a check on several of the scale parameters from the current meter array data. The float data give better areal coverage than the point measurements, although the spatial averaging necessary to achieve statistical reliability limits their use in this study. Since the float data are averaged into bins over several degrees of latitude and longitude to reduce the statistical uncertainty, they do not resolve length scales smaller than a few hundred kilometers. However, the float data still provide a useful check on the scales for the velocities and for the variation in eddy kinetic energy.
This chapter reassesses the scale estimates of the mean dynamical bal-ances in light of these new data sets. Since the purpose of this analysis is to evaluate the in situ effect of the eddy field, only scale estimates from
the thermocline and shallower depths will be discussed. The moorings in Cluster A were instrumented with current meters only at 200 and 1500 m depth, while the other data summarized here are from 500 to 600 m depths. We caution that topography can have a large effect on both the mean and eddy fields. In Clusters III A and B, for example, there is a striking decrease in deep eddy kinetic energy over rough topography. Therefore, the conclusions of this
chapter pertain only to thermocline flow fields where the eddy kinetic energy is maximum in depth and where processes like baroclinic instability will have the largest signature.
The following three sections of this chapter contain the scale analysis for the mean momentum, vorticity, and heat balances. For each balance the
three regions are discussed in separate sections. For each region the dynam-ical balance is first scaled, then the regional data is examined to chose the proper scale parameters, and finally the balance is evaluated.
2.11. THE MEAN MOMENTUM BALANCE (A) The Mid-Ocean
In order to facilitate comparison with Harrison's (1980) estimates, the same notation will be used here for scaling the momentum and vorticity bal-ances. The scale parameters for each term in the mean momentum equation for the mid-ocean are shown in the first column of Table 2.1(a). The momentum scaling requires two velocity parameters -- the scale uo for the eddy field
and Uo for the mean flow. The eddy velocity scale will be estimated from the rms eddy kinetic energy assuming that the correlation coefficient between the eddy velocity components is 0(1). Appendix A, Tables A.1 and A.2 show that in Array I and Cluster III B u 2 > v'2 while in Cluster III A v'2 ,2
most of these cases, the difference in energy is less than a factor of two, so the difference in rms zonal and meridional velocity scales is even smaller. Thus we use the rms average eddy kinetic energy (u ) to scale the eddy velocity. The ratio of eddy to mean terms (Table 2.1(b), column 1) shows that the important velocity scales are the ratio Uo/Uo and the value of u .
In addition to the velocity scales, two length scales are necessary: the horizontal scale (L) for the mean flow and the scale of variation (Z) for the quadratic eddy velocity statistics. In general, X will differ from the scale of individual eddies and from the mean length scale. The ratios in Table 2.1(b), column 1 depend on the ratios of length scales (L/Z ) and on the
value of the scale of variation .
The mid-ocean velocity and length scales from POLYMODE Array III Clust-ers A and B (Appendix A) do not differ much from the earlier data at thermo-cline depths. From the earlier measurements Harrison (1980) chose to evaluate the ratios of eddy to mean terms with the ratio u /Uo = 0(10) and the value
u0 = 1-7 cm/sec. The more recent measurements from PM III show eddy and mean velocity scales in the thermocline that are comparable to the Array I and MODE values. Fu et al. (1982) report that the eddy kinetic energy at 500 m de-creases eastward along 280 N from 40 cm2/sec2 at MODE Center (68°W) to
9 cm2/sec2 at POLYMODE Array I (55°W). The eddy kinetic energy then increases again to 36 cm2/sec2 at 41°W in Cluster B. Thus we have chosen a typical value of 30 cm2/sec2 for the eddy kinetic energy u2 in the mid-ocean as listed in Table 2.2, column 1. Harrison reported mean speeds of typically 1 cm/sec from the gyre interior between 70°W and 40°W along 280N. The mean velocity from the PM III arrays is also about 1 cm/sec, although individual
record means may be up to a factor of seven larger. The length scale of vari-ation of the mean fields in the gyre interior is about L = 1000 km. In Figure 2.2 the eddy kinetic energy has been plotted along 280N from MODE Center, MODE East, PMI, and PMIII A and B. This figure shows that the eddy kinetic energy also varies over a broad spatial scale. Thus, as shown in Table 2.2, column 1, both the mean and the eddy length scales are taken to be L = = 1000 km in the mid-ocean.
The evaluated ratios of eddy to mean terms in the mid-ocean mean momen-tum balance are given in Table 2.3, column 1. For this balance our conclu-sions are basically the same as in Harrison (1980). The eddy term is an order of magnitude larger than the mean advective term. However, since the ratio of the eddy term to the Coriolis term is only .004, the eddy term has negligible effect on the mean geostrophic balance. Although the horizontal pressure gra-dient cannot be directly estimated, we assume that it balances the Coriolis term because the other terms in the momentum balance are much smaller.
2.11. (B) POLYMODE Array II
The scaling for the zonal and meridional mean momentum balances in the Array II region are tabulated in the second column of Table 2.1(a). Since the mean flow in the Array II region is anisotropic, it is necessary to identify both a zonal (Lx) and a meridional (L y) length scale in addition to different scales for the zonal Uo and meridional Vo velocity components. The
observa-tional data do not suggest anisotropic scaling for the eddy field. Appendix A shows that in Array II u'2 is greater than v'2 by less than a factor of two, so the eddy velocity component scales are comparable. In the second column of Table 2.1(b) the relative importance of the eddy term depends on the
ratios of scales u /Uo, Uo/Vo, LxI/ , and L y/ for an anisotropic flow instead of u /U and L/ for an isotropic flow. Since these sets of ratios can be significantly different, the importance of the eddy term may be under-estimated in the Array II region by scale estimates for an isotropic flow. Moreover, the errors are compounded in evaluating the ratios in Table 2.1(b).
To evaluate the ratios in Table 2.1(b), column 2 we require observation-al estimates for the anisotropic velocity and length scobservation-ales of the mean flow
along 55°W. Figure 6 from Owens (1984) shows the record average of the three settings of current meters at 600 and 1500 m depth (Schmitz, 1980). A typical half width for the peak amplitude of the mean zonal flow is ~ 100 km.
Richardson (1984) has presented a comprehensive intercomparison of the zonal velocity field from the Array II data with several years of float data from this region. The float data were treated like Eulerian measurements and averaged into bins over one degree of latitude and 10 degrees of longitude. The average direction of the surface floats is 93°T, so the surface flow along 55°W is directed nearly to the east. Although the measurements were made at different time periods, the subsurface float measurements like the current meter data show a narrow zonal jet flanked by two countercurrents. Thus the float data give independent confirmation that the zonal Array II data is rep-resentative of the long-term mean flow in this region. From the current meter measurements the scale parameters are chosen to be L = 100 km and U = 5 9 cm/sec.
If the flow across 55°W is purely zonal, then the advective terms in the mean balances are zero. A recent analysis (Richardson, 1983) of surface
drifter data clearly shows that in the near field of the Gulf Stream the mean meridional speeds are an order of magnitude smaller than the zonal speeds.
However, we do not assume that the flow is strictly zonal because the current meter data show a typical mean meridional speed of Vo = 2 cm/sec. The
down-stream length scale (Lx) is estimated to be at least 500 km from the mean
velocity vectors from surface drifters plotted in Richardson (1983), Figure 8. The eddy scales in the ratios in Table 2.1(b) are the eddy kinetic energy u2 and its length scale of variation. Appendix A shows that for the Array II data from the thermocline the eddy kinetic energy for the composite record is
2 2 2
uo = 200 cm /sec as listed in Table 2.2. The estimates of the near field length scale (Q') for the variation in eddy velocity statistics suggest a value of 300 km in both the meridional and zonal directions. The meridional variation is shown in Figure 8 from Owens (1984) of eddy kinetic energy from SOFAR float data plotted along 550W together with the current meter data from Array II. The half-width for the peak amplitude is X = 300 km at both
thermocline and deeper depths. Data analyzed from surface drifters along 65°W (Richardson, 1983) also suggest a 300 km e-folding scale for eddy kinetic energy.
The zonal variation in eddy kinetic energy can be estimated from the GSE mooring array data. Figure 2.2 shows the thermocline eddy kinetic energy from
the GSE array plotted as a function of longitude and the Array II data plotted as a function of latitude. The horizontal scale is a mercator projection so that the two axes have the same scale in kilometers. Although the eddy kinet-ic energy variation in the GSE array might be related to the local topography, the zonal length scale is comparable to the meridional scale. Since the moor-ings in the GSE array were not located at the same latitude, there is some spread among the points. However, it is clear that the zonal GSE data curve has the same slope and amplitude as the meridional 55°W data. Thus, the recent
data from regions close to the Gulf Stream support Harrison's choice of
X
= 300 km for the scale of variation in quadratic eddy statistics.With the substitution of these observed scales in the ratios of Table 2.1(b), column 2, we obtain the values in Table 2.3, column 2. Each of the ratios of eddy to mean terms in the mean momentum balance is at least an order of magnitude larger than Harrison's (1980) estimates shown in Table 2.3,
column 3. The eddy term is comparable to or larger than the mean advection term. However, the eddy term in the Array II momentum balance signifies only a 4 percent deviation from the mean geostrophic zonal balance. Thus, the eddy term is probably not important in the lowest order momentum balance for the Array II region.
2.11. (C) LOCAL DYNAMICS ARRAY
The scaling of the mean momentum balance in the LDE region is problemat-ic because the array does not resolve the mean length scales. Since there is no evidence for choosing anisotropic scales and since the observed zonal and meridional mean speeds are comparable, the LDE balances (Table 2.1(a,b),
col-umn 1) are scaled like those for the mid-ocean. The mean and eddy variation length scales must be inferred from other observations. McWilliams' (1983) 200 km mean length scale based on schematic flow diagrams will be used in this analysis. We estimate the spatial scales of variation in the eddy kinetic energy to be about 300 km because the LDE eddy field is a factor of three more energetic than that observed during the MODE experiment 300 km to the south-east (280N, 69.60W). The mean speeds at 600 m depth are 2 cm/sec for both the zonal and meridional components and the eddy kinetic energy is approximately
80 cm2/sec2. From these observations we scale the LDE balance using L = 2 2 as shown in column 4 200 km,0X = 300 km, U = 2 cm/sec, and u = 80 cm /sec as shown in column 4 of Table 3.
The eddy field in the LDE region is less energetic than that in Array II but more energetic than in the mid-ocean. In Figure 2.2 the LDE eddy kinetic energy is plotted at 700W. Although the LDE data is from nearly the same lat-itude (300N) as the mid-ocean data (28°N), it is significantly more energetic. In this sense, the LDE represents a transition between the more energetic recirculation region measured in Array II and the less energetic mid-ocean region. However, even though the LDE region is less energetic than the Array II region, the choice u0/U0 = 0(1) would still underestimate the eddy effect by nearly a factor of five. The assumption that eddy and mean energies are comparable near the Gulf Stream was based in part on data from ship drift mea-surements like Wyrtki et al. (1976). A more recent analysis of data from sur-face drifting buoys (Richardson, 1983) demonstrates that the spatial averaging of these measurements over scales comparable to the eddy length scale causes an underestimate in near field eddy kinetic energy. The order of magnitude value u /Uo = 0(1) now appears to be based on an underestimate of the eddy energy.
The ratios of eddy to mean terms in the momentum balance from the LDE data (Table 2.3, column 4) give the same results found for Array II. The eddy term may be an order of magnitude larger than mean advection, but the dominant mean balance remains geostrophic.
2.111. THE MEAN VORTICITY BALANCE (A) The Mid-Ocean
The scaling for the mean vorticity balance (Table 2.4(a,b)) differs from the momentum balance only by a length scale. Direct estimates of the mean terms in this balance can be made only for the planetary and mean advec-tion terms which depend on horizontal velocity and length scales. It is not possible to estimate the vortex stretching term fwz because the vertical
velocity cannot be measured for low-frequency motion. Thus, this analysis must concentrate on comparison of the eddy terms with Bv and u • VC.
Nonethe-less, some conclusions are still possible about the dominant balance of terms even without direct scale estimates of the magnitude of vortex stretching.
Harrison (1980) scaled the vertical velocity from the continuity equa-tion but allowed the flow to be horizontally non-divergent to order y by writing w = yU H/L . The value of y was inferred from the lowest order vorticity balance by scale analysis. In both the near field of the Gulf Stream and the mid-ocean regions it was found that the linear, geostrophic vorticity balance dominated:
az
Traditional arguments about the size of the mean vertical velocity imply that the vortex stretching will have the same scale as the planetary advection or
as the mean advection of vorticity. Whether these two mean terms are also the same magnitude depends only on the length and velocity parameters of the mean flow. For a mean velocity field that is horizontally non-divergent to within
order Rossby number (R ) the vertical velocity scales as: RU H
- oo
where R U o/f L and H is the mean depth scale. The stretching term
will then scale like the mean advection of vorticity. In the interior ocean, however, the mean advection of vorticity is small compared to planetary advec-tion. A lowest order linear vorticity balance between vortex stretching and planetary advection would require that the vertical velocity be scaled like:
SHU
_ 0
Wge f0
This scaling implies that the ratio of wge to wro is equal to the ratio of planetary to mean advection BL2/Uo . In the mid-ocean where the mean
flow is weak and broad the vertical velocity may be several orders of magni-tude larger than the Rossby number.
The consistency of these scale arguments must be verified if there is an induced vertical velocity due to flow across topographic contours. Wunsch (1984) and Bryden (1980) have suggested that these contributions can invali-date the vertically integrated Sverdrup balance between the northward plane-tary advection and the wind stress curl. Furthermore, the magnitude of the vortex stretching term must also be consistent with the vertical velocity in the mean heat balance. The magnitude of the vertical velocity implied by the lowest order vorticity and heat balances and from topographic forcing will be compared in section V.
The ratios of eddy to mean terms in the mean vorticity balance for the mid-ocean are given in the first column of Table 2.5. In the vorticity
bal-ance like in the momentum balbal-ance, the eddy term is an order of magnitude larg-er than the mean advection tlarg-erm. Howevlarg-er, planetary advection is the dominant term and it must be balanced by vortex stretching if there is to be a lowest
order balance. From these estimates we conclude like Harrison (1980) that in the mid-ocean the eddy term probably does not upset the linear vorticity
balance.
2.111. (B) POLYMODE Array II
The scaling for the vorticity balance in the Array II region is given in the second column of Table 2.4(a,b). The vortex stretching term can be scaled by assuming a balance with planetary advection (BVo). Alternatively, if the vertical velocity is scaled by the Rossby number, then there are two different Rossby numbers:
U V
R 0 and R 0
ox f L oy and Roy - f Lox
for the zonal and meridional balances. For the observational scales in Array II (Table 2.2, column 2) Rox = .01 and Roy = .001 are assumed to be suffici-ently small parameters for the quasigeostrophic approximation to remain valid.
With these Rossby numbers the vertical velocity scaling is given by
U
UH VoH
w max R , R
ro ox Lx oy L
The stretching term would then be the same order as the mean advection of rel-ative vorticity. Thus for the anisotropic case as well as the isotropic case, the vortex stretching term could be the same order as the planetary or mean advection terms.
Our scale estimates for the vorticity balance in Array II are evaluated in Table 2.5, column 2 and compared to Harrison's (1980) results in column 3. We find that the eddy term is in each comparison an order of magnitude larger
than estimated by Harrison. All three terms - the eddy relative vorticity flux divergence, the planetary vorticity, and the mean advection of relative vorticity -- could be important in the lowest order vorticity balance. The eddy term is comparable to mean advection of vorticity and it is 60 percent of planetary advection. Verification of the magnitude of this term, however, must await direct measurements of the eddy relative vorticity flux and its
spatial variation. Since these estimates are only based on scale analysis, it is possible that the divergence terms have been overestimated. However, these data suggest that both the eddy term and the mean advection terms are signifi-cant in the mean vorticity balance in the Array II region.
2.111. (C) LOCAL DYNAMICS ARRAY
The scaling for the vorticity balance in the LDE (Table 2.4(a), column 1) is identical to that for the mid-ocean and the scale parameters have al-ready been discussed for the momentum balance. From the LDE data we can cal-culate the eddy relative vorticity flux (Chapter 3) and the associated error directly so that there is more confidence in this scale estimate. The eddy term scale estimate based on the eddy kinetic energy u = 80 cm /sec2 and the
0
length scale
/
= 300 km agrees with the measured eddy relative vorticity flux 0(10-6 cm/sec2). The divergence should be smaller by a factor of 1/. The last column of Table 2.5 shows the evaluated ratios of the eddy to mean terms for the LDE data. The eddy term is less important compared to av in the LDE than in Array II because of the lower eddy kinetic energy. However, in the LDE, since U /BL2 is small, the eddy term is an order of magnitude larger than the mean advection of vorticity. The scale analysis suggests that theIn these regions the eddy term is not important because the mean flow is iso-tropic and both the mean and eddy fields are less energetic than in Array II.
2.IV. THE MEAN HEAT BALANCE
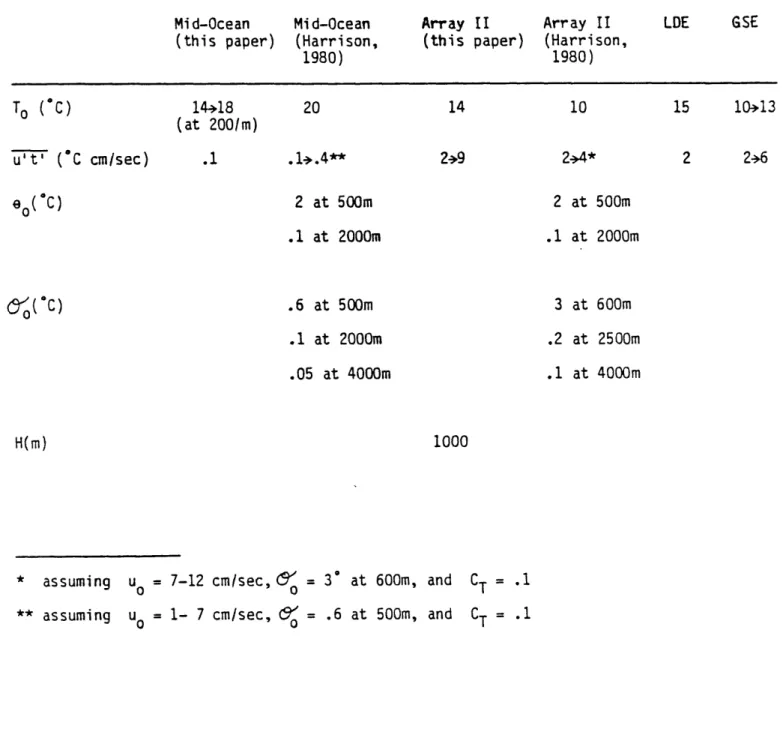
The terms in the heat balance are particularly difficult to evaluate because of the uncertainty in the observational data. Harrison (1980) scaled the equations directly by estimating the horizontal (e ) and vertical (T o) mean temperature variations. The eddy heat flux was scaled with the eddy
velocity (u ), the horizontal eddy temperature variation (so), and the corre-lation coefficient (CT) between the two variables. With this type of scaling shown in the third column of Table 2.6, the ratios of eddy to mean terms depend on the ratios of u /Uo, L/X , 61/e, and &o/T . Although this type of scaling emphasizes the relative order of magnitudes of the eddy and mean variables, it tends to obscure the uncertainties in the ratios.
The horizontal temperature scales e and Co in the mean horizontal
0 0
temperature advection and eddy heat flux divergence are very difficult to estimate from experimental data. For this reason, there are several differ-ences in our scale analysis of the mean heat balance. First, in section 2.11
it was shown that the mean momentum balance is geostrophic to within 4 percent in both the near field and mid-ocean. If the mean flow is both geostrophic and hydrostatic, then the mean horizontal temperature advection term can be re-written using the thermal wind relation and evaluated from the mean
veloc-ity scale U which is more easily evaluated than the horizontal mean tempera-ture variation eo. Second, the eddy heat flux divergence term will be scaled
with the observed heat fluxes and the length scale of variation of eddy statis-tics introduced in section 2.11. Although the length scale XZ pertains to the
variation in eddy kinetic energy, the observational data do not indicate that the eddy heat fluxes vary over a significantly different scale. The third difference between this analysis and the previous one is in the scaling of the vertical temperature advection. The discussion of the vortex stretching term in the vorticity equation showed that the vertical velocity can be scaled as-suming either a field which is of order Rossby number (wro) or in geostrophic balance (w ge). These alternatives for w are listed in Table 2.6. Whether either of these is the proper scaling will be determined by requiring that there be a lowest order balance in the mean heat equation.
2.IV. (A) The Mid-Ocean
With these chosen scale parameters the terms in the mean heat balance for the mid-ocean are tabulated as in the first column of Table 2.6. Mean
2
horizontal temperature advection depends on the mean kinetic energy U , the mean vertical scale H, and the constants fo, g, and a. The constant a is the parameter relating temperature and density fluctuations according to:
p = (I + -p ds -aT
aT as d)T -T
The variation of density with temperature for typical oceanic salinities is of order 10-4gm/(cm3.C) as shown in Appendix A, Table V of Neumann and Pierson
(1966). The variation due to salinity is an order of magnitude smaller. Thus, it will be assumed that a = 1 x 10⁻⁴gm/(cm3C) for all the balances evaluated herein.
Scaling the mean vertical temperature advection term involves a choice since w again is not known. If there is a linear vorticity balance, then vertical temperature advection is of order UoBT /fo where To is the
amplitude of mean vertical temperature variations. Rossby number scaling for vertical velocity gives a vertical advection differing in magnitude from the previous scaling by the factor U 0/L2. It will be necessary to compare the
magnitudes of the vortex stretching term in the vorticity balance and the ver-tical temperature advection in the heat balance in order to check the consis-tency of the vertical velocity estimates.
The observed values of the mean vertical temperature amplitude To and
the eddy heat flux u't' at mid-thermocline depths in the mid-ocean are given in Table 2.7, column 1. In the Clusters A and B and Array I mooring data only one of the correlation coefficients between a velocity component and tempera-ture is statistically significant at the 90 percent level. A typical value for the eddy heat flux in the mid-ocean (Appendix A) is .10C cm/sec, although the range of values is as much as two orders of magnitude larger in one nine month record (Array I, mooring 549). The mean temperature is varies from 140C to a maximum of 18C at 200 m depth in Cluster A (280N, 480W). To evaluate the mean heat balance in mid-ocean we use the scale parameters v't' =
.1°C cm/sec and T0 = 14+18°C.
The magnitude of the terms in the mean heat equation evaluated with these scales are given in the first column of Table 2.8. The terms have not been evaluated as ratios of eddy to mean terms because of the possible uncer-tainties. For the mid-ocean, the values in the first column suggest that the eddy term is negligible compared to the lowest order balance between mean hor-izontal and vertical temperature advection. This type of balance was used by Bryden (1980) to calculate the vertical velocity from the mean horizontal ad-vection using the thermal wind relation. In the mid-ocean the eddy heat flux
correlation coefficients are small so the eddy term does not contribute to the lowest order balance.
These results differ from those of Harrison (1980) who found the eddy term to be comparable to both mean horizontal and vertical temperature
advec-tion in the mid-ocean. Those scale estimates from the POLYMODE Array I data (Spencer et al., 1979) are listed in Table 2.7, column 2. The reason for our different conclusions is not immediately apparent. Both the eddy heat flux divergence (.1 .4 x 10-8 C sec-1) and the mean horizontal temperature advec-tion (2 x 10-80C sec- 1 ) from the values in column 2 are comparable to our
estimates. However, Harrison's (1980) result is based on the ratio of the eddy term to the mean horizontal advection or in terms of his scaling:
uo L
c ( -)( - )
This ratio was found to be equal to 1 using cT = .1, Uo/Uo = 0(10), L/X =
0(1), and ()/e = 0(1). The values in Table 2.7, column 2 show that these ratios are both smaller (u /U = 1 > 7 and (60/e = .3 at 500 m) so that the ratio of the eddy term to the mean horizontal temperature advection should be
.03 - .21 instead of order 1. Thus, the difference in our conclusions seems related to the compounded errors in overestimating these ratios.
2.IV. (B) POLYMODE Array II
The scaling of the mean heat balance for Array II (Table 2.6, column 2) incorporates the anisotropy of the mean scales in the mean horizontal and ver-tical temperature advection. The parameters for evaluating these estimates
but so are the associated errors. Only the two moorings closest to the Gulf Stream axis measured significant correlation coefficients for the eddy heat fluxes. Typical values for the heat flux (v't' = 2 > 9 °C cm/sec) and its divergence are comparable to those in Harrison's (1980) analysis.
From these estimates we conclude that all three terms -- the mean hori-zontal and vertical advection of temperature and the eddy heat flux divergence -- may be of the same order in the mean heat balance (Table 2.8, column 2) for Array II. This conclusion differs from Harrison (1980) who found that in the Array II region the eddy heat flux divergence was an order of magnitude less than the mean horizontal temperature advection. Harrison evaluated these ratios using the values listed in Table 2.7, column 4 from Fuglister's (1960)
atlas and Tarbell et al. (1978). We estimate from scaling by the thermal wind relation that the mean horizontal temperature advection is of order
10-7 C sec-1. Harrison's scaling would predict that this term is an order of magnitude larger using the parameters:
U = 5 - 10 cm/sec L = 100 km
and e = 20C at 500 m.
This is not consistent with the turning of the mean velocity vector in the Array II moorings between 600 and 1000 m depth. From the average turning of about .1 radian and the average speed of 7 cm/sec, the mean horizontal temper-ature advection is 0(10-70C sec-1). If the mean horizontal advection were an order of magnitude larger, the mean velocity vector would turn through a 60 degree instead of a 6 degree angle between the two depths. Thus we con-clude that in the Array II region the eddy heat flux term is the same order of magnitude as the mean horizontal and vertical temperature advection.
2.IV. (C) LOCAL DYNAMICS ARRAY
Since the mean flow is assumed to be isotropic in the LDE region, the scaling of the mean temperature balance (Table 2.6, column 1) is the same as in the mid-ocean. Unlike the mid-ocean, however, the meridional thermocline eddy heat fluxes are significant with larger correlation coefficient than in the Array II data. The scale estimates for the mean heat balance are evalu-ated using the mean temperature scale T = 150C and the array average
merid-ional heat flux at 700 m, v't' = 2°C cm/sec. The lowest order balance at thermocline depth in the LDE (Table 2.8, column 3) is between the mean vertic-al temperature advection and the eddy heat flux divergence. The mean hori-zontal temperature advection may also be important although the scale analysis suggests that it is a factor of two smaller. These scale estimates are veri-fied in Chapter 4 by direct computation of the mean advection and eddy terms from the LDE data.
2.V. SUMMARY AND CONCLUSIONS
Because the new data do not suggest radically different scale paramet-ers, it is surprising that some of the results differ significantly from those of Harrison (1980). In part this is a reflection of the possible errors in the scale parameters and especially in the ratios of these quantities. In the momentum balance (Table 2.3) for all three regions, the eddy terms are not likely to upset the mean geostrophic momentum balance although they may be comparable to or larger than mean advection. The importance of the eddy term relative to the Coriolis term decreases in the less energetic mid-ocean re-gion, while it increases relative to mean advection. In the vorticity balance
region where both the eddy term and the horizontal advection of vorticity may also be important. The eddy term in the LDE and mid-ocean regions is an order of magnitude larger than mean advection. This reflects the increase in mean
length scale and decrease in mean velocity scale in these two regions compared to the Array II region.
Our conclusions from the mean heat balance differ in all regions from the previous scale analysis. In the mid-ocean the eddy term is negligible so that the mean horizontal temperature advection balances vertical temperature
advection. Vertical velocity can then be estimated using the thermal wind relation from the turning of the velocity vector with depth. In the Array II and LDE regions the eddy heat flux divergence may be comparable to both mean horizontal and vertical advection at thermocline depth. The vertical velocity in all three regions is consistent with a scaling based on the linear vortic-ity balance while Rossby number scaling underestimates the mean vertical temperature advection by several orders of magnitude in the mid-ocean and LDE regions. In Array II the vertical velocity scale wro is more nearly equal to w because the ratio BL2/U0 approaches one. The magnitude of the
ver-tical velocity w = 10-4 cm/sec based on geostrophic scaling is consistent with both the vorticity and heat balances in all three regions.
We conclude from these scale estimates that the thermocline eddy field should not affect classical mid-ocean dynamics. The linear vorticity balance should remain valid and the mean temperature balance will be between mean hor-izontal and vertical temperature advection. In the Array II region the eddy terms as well as the mean advective terms are not negligible in the mean vor-ticity and heat balances. The scale estimates suggest that the divergence of the eddy relative vorticity flux u' ' may be the same order as planetary
advection and mean advection of vorticity in the mean vorticity balance. The eddy term may also be important in the mean heat balance of this region where significant eddy heat fluxes are generated by baroclinic instability of the mean flow. The balances in the LDE region show some similarity to both the Array II and mid-ocean regions. In the LDE region like in the mid-ocean the linear vorticity balance should not be upset by either the eddy term or by mean advection of vorticity. However, both the eddy heat flux divergence and the mean horizontal temperature advection may be significant in the mean heat balance. These conclusions are significantly different from the previous scale analysis. They suggest that eddies are most likely to have an effect on the mean dynamical balances of the Gulf Stream recirculation region.
TABLES AND FIGURES Table 2.1: Table 2.2: Table 2.3: Table 2.4: Table 2.5: Table 2.6: Table 2.7: Table 2.8:
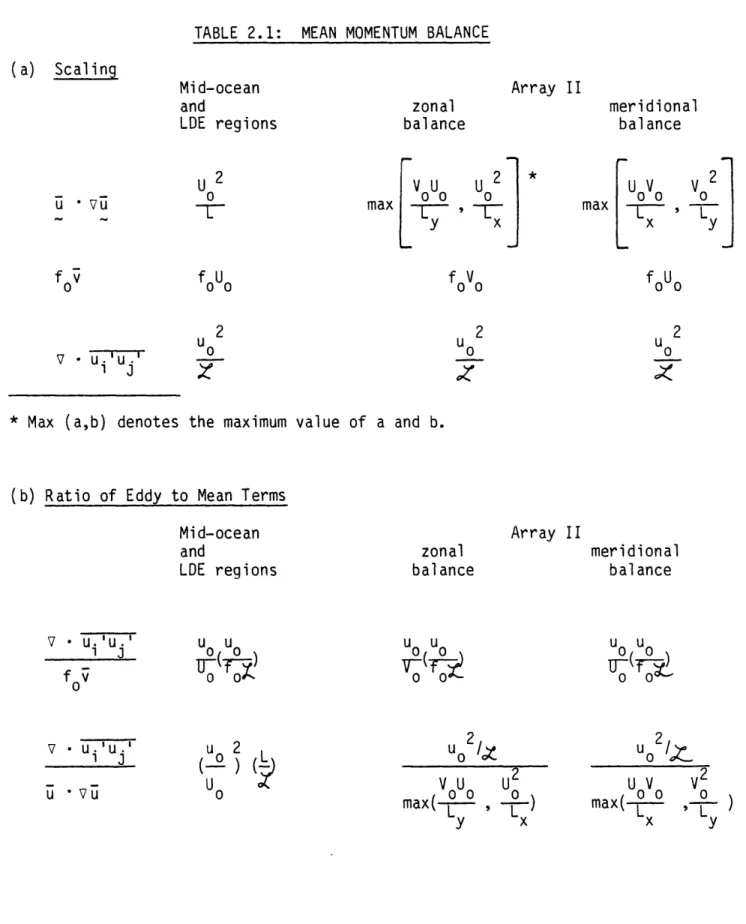
Scaling (a) for the mean and eddy terms in the mean momentum equa-tion and the ratios (b) of the eddy to the mean terms. The first column shows the scaling for the mid-ocean and the LDE regions, while the second column shows the appropriate scaling for the Array II region.
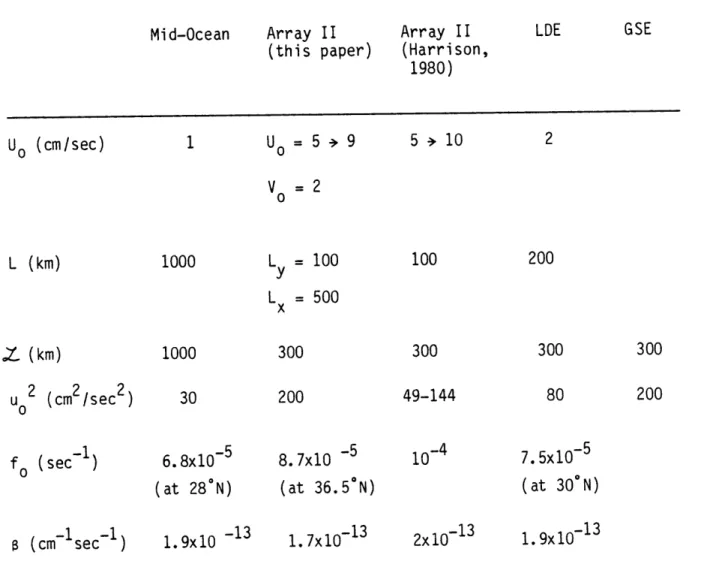
Observational scale parameters used in the mean momentum and vorticity equations.
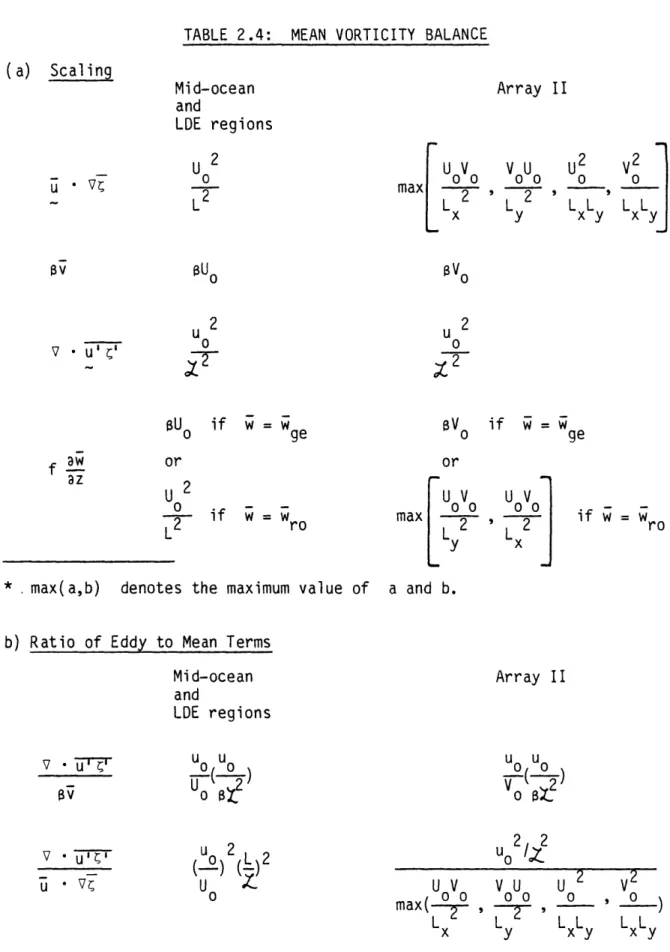
Evaluated ratios of eddy to mean terms in the mean momentum equation for the three regions identified in this paper. Scaling (a) for the mean and eddy terms in the mean vorticity equation and the ratios (b) of the eddy to the mean terms. Evaluated ratios of eddy to mean terms in the mean vorticity equation.
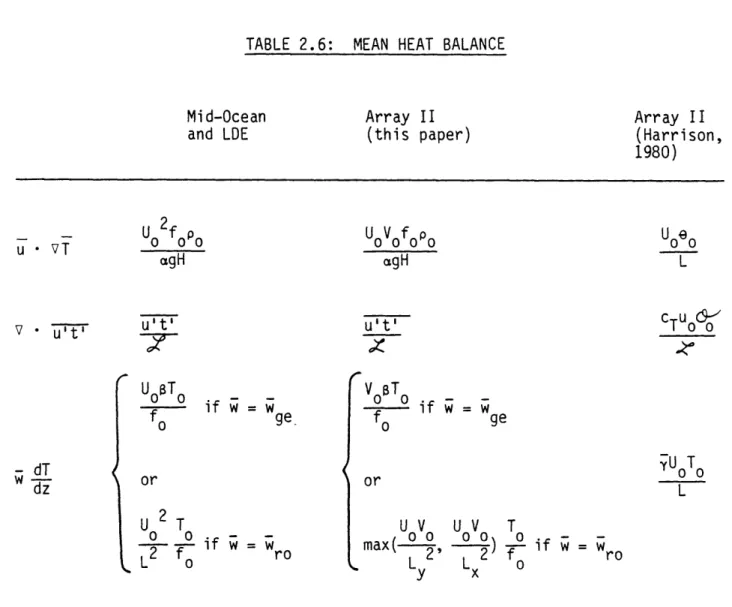
Scaling for the mean heat balance.
Observational scale parameters used in the mean heat equations. Evaluated terms in the mean heat equation.
Figure 2.1: Western North Atlantic map showing the locations of the arrays referred to in this paper: (MODE) Mid-Ocean Dynamics Experiment, (LDE) Local Dynamics Experiment, (PMI) POLYMODE Array I, (PMII) POLYMODE Array II, (PMIII A&B) POLYMODE Array III Clusters A and B, (GSE) Gulf Stream Extension. Also shown in this figure is the historical mean position of the 15°C isotherm at 200 m depth from Fisher (1977).
Figure 2.2:
Appendix A Table A.1: Table A.2:
Summary of the geographic variation of eddy kinetic energy in the near field and mid-ocean from current meter data. The MODE East, Center, PMI, PMIIIA, and PMIIIB values are the cluster averages reported in Fu et al. (1982), Table 3. These arrays have been plotted as a function of longitude along 280N (bottom scale). The other data from the LDE, PMII, and GSE arrays are tabulated in Appendix A. The data from the LDE and the GSE have been plotted as a function of longitude (bottom scale). Since Array II was deployed meridionally along 550W, those data have been plotted as a function of latitude (top scale). The projection of the latitude and longitude scales has been chosen so that they have equal distances in kilometers.
Near field statistics from POLYMODE Array II, LDE, and GSE. Mid-ocean statistics from POLYMODE Array I and III Clusters A
TABLE 2.1: MEAN MOMENTUM BALANCE (a) Scaling Mid-ocean and LDE regions zonal balance Array II meridional balance maxVoUo U2
Ly
J
f V 2 uo U V max , Ly foUo 2* Max (a,b) denotes the maximum value of a and b.
(b) Ratio of Eddy to Mean Terms Mid-ocean and LDE regions zonal balance Array II meridional balance u u
o o
2 U 2 0 max 0 , 0 y x 2 0 0 0 max( L ' L x y f 0v U 0 ---f0U 2 u o V u.u
i U. j u0 o
U V u.'i u ' 1 j f v ui'U j u uoV- o
0 0d
u2 U0TABLE 2.2: SCALE PARAMETERS Array II (this paper) Array II (Harrison, 1980) U0 (cm/sec) L (km) Z (km) u 02 (cm2/sec2) Uo = 5 9 V =2 0 1000 1000 L = 100 y L = 500 x 300 200 fo (sec-1) s (cm-1sec- 1) 6.8x10- 5 (at 28TN) 1.9x10 -13 8.7x10 -5 (at 36.5°N) 1.7x10- 13 2x10- 1 3
Mid-Ocean LDE GSE
5 > 10 200 100 300 49-144 300 300 200 7.5x10- 5 (at 30'N) 1. 9x10- 1 3
TABLE 2.3: EVALUATED MOMENTUM BALANCE RATIOS Array II (this paper) meridional Array II (Harrison, 1980) v * ui 'u ' u 0 u V • u'j .004 30 .04 4 .02 + .01 20 .002 > .004 .3 Mid-Ocean zonal LDE .02