HAL Id: hal-00297458
https://hal.archives-ouvertes.fr/hal-00297458
Submitted on 19 May 2008
HAL is a multi-disciplinary open access
archive for the deposit and dissemination of
sci-entific research documents, whether they are
pub-lished or not. The documents may come from
teaching and research institutions in France or
abroad, or from public or private research centers.
L’archive ouverte pluridisciplinaire HAL, est
destinée au dépôt et à la diffusion de documents
scientifiques de niveau recherche, publiés ou non,
émanant des établissements d’enseignement et de
recherche français ou étrangers, des laboratoires
publics ou privés.
Origin and influence of PM10 in urban and in rural
environments
A. Kerschbaumer, M. Lutz
To cite this version:
A. Kerschbaumer, M. Lutz. Origin and influence of PM10 in urban and in rural environments.
Advances in Science and Research, Copernicus Publications, 2008, 2, pp.53-55. �hal-00297458�
Adv. Sci. Res., 2, 53–55, 2008 www.adv-sci-res.net/2/53/2008/
©Author(s) 2008. This work is distributed under
the Creative Commons Attribution 3.0 License.
Advances in
Science and
Research
7th
EMS
Annual
Meeting
and
8th
Eur
opean
Confer
ence
on
Applications
of
Meteor
olo
gy
2007
Origin and influence of PM
10
in urban and in rural
environments
A. Kerschbaumer1and M. Lutz2
1Institute of Meteorology, FU-Berlin, Germany
2Senate Department for Health, Environment and Consumer Protection, Berlin, Germany
Received: 10 January 2008 – Revised: 7 April 2008 – Accepted: 22 April 2008 – Published: 19 May 2008 Abstract. The paper presents an estimate of emission source influence on PM10 concentrations in Berlin.
Particulate matter less than 10 µm in aerodynamic diameter (PM10) is a conglomerate of different chemical
components related to distinct sources and physico-chemical processes in the atmosphere and lithosphere.
Emission reduction thus has temporally and spatially varying effects on different scales. Urban PM10
concen-trations are heavily influenced by long range transport (up to 70%) from remote source areas, whereas rural air pollution is strongly determined by urban emissions. By means of emission reduction scenario simulations with a chemistry-transport-model it has been found that on average two third of the urban background concen-trations in Berlin are due to Berlin-specific emissions. This percentage varies strongly considering primary and
secondary components: only about 5% of secondary PM10concentrations are related to local emissions, while
approximately 70% of primary concentrations stem from the urban sources. City related emissions influence homogenously the rural air-pollution concentrations, but with different ranges of influence.
1 Introduction
In order to derive effective PM10 concentration reduction
strategies the sources of these concentrations have to be
known and associated. PM10is composed of different species
of primary as well as secondary origin. Thus, composition and concentration are strongly varying temporally as well as spatially. Different techniques based on either measurements
or computer simulations have been proposed to assign PM10
concentrations to distinct emission sources. Lentschow et al. (2001) have analysed simultaneous measurement results
in order to associate different PM10 components
concentra-tions to monitoring site representative emissions. They have
shown that for instance kerbside PM10 concentrations on a
yearly average can be explained by roughly 30% long range transport, 30% urban increment and 30% traffic related emis-sions. Reimer et al. (2004) have analysed air mass back-trajectories relating high local concentrations to surface con-tact points of the air parcels. This analysis has shown high spatial correlation between high sulphate concentrations in
Berlin and south-eastern regions while primary PM10
pollu-tions are related more to local sources exhibiting no clear
Correspondence to: A. Kerschbaumer
(kerschba@zedat.fu-berlin.de)
preferential pathways toward the city of Berlin. Chemistry transport models have been applied in estimating the con-tribution of individual countries to other countries’ air pol-lution (van Loon et al., 2007). On the local scale, Thunis et al. (2007) applied the same technique to different Euro-pean cities. In this study, we analysed the influence of urban
emission sources on the local as well as on the remote PM10
concentrations in the Berlin-Brandenburg region.
2 Method
The Chemistry Transport Model REM Calgrid (Stern et al., 2003, Beekmann et al., 2007) has been used to simulate
the PM10 concentration in the Berlin-Brandenburg region
for the whole year 2002 with a horizontal resolution of ca. 4 km. This region is a nested domain of a Europe-wide application of the same model taking its boundary condi-tions from the coarser resolved run. The horizontal exten-sion of approximately 300×300 km has been considered suf-ficient to allow considerations concerning origin and fate of
PM10-concentrations. The vertical extension was 3000 m
with a resolution of 4 mixing-height-following levels and one surface layer of 20 m height. This ground level height is representative of the particle concentration at ground. Emissions were provided by local authorities of Berlin and Published by Copernicus Publications.
54 A. Kerschbaumer and M. Lutz: PM10in urban and in rural environments PPM10 PPM10 PPM10 PPM10 PPM10 PM10 PM10 PM10 PM10 PM10 SAER SAER SAER SAER SAER 0 10 20 30 40 50 60 70 80
Centre Urban backgr. North. Outskirt North South
%
PPM10:Prim. Components PM10:Total PM10 SAER:Sec. Components
Figure 1. Relative maximum contribution of Berlin Emission to
Primary PM10 (PPM10), to Total PM10 (PM10) and to Secondary (PM10) concentrations in city-centre (centre) areas, in central res-idential areas (Urban backgr.), in northern urban suburbs (North. Outskirt), in northern residential areas (North) and in southern resi-dential areas (South).
neighbouring L¨ander. In order to estimate the maximum
lo-cal influence on lolo-cal as well as on remote PM10
concen-trations, a scenario run with no Berlin emissions has been made without altering the background boundary conditions. Ranges of influence have been determined considering ra-dial air pollution concentration reduction potentials. In order to obtain also an estimate of the preferential wind direction
for distinct PM10components, species fluxes towards to and
from Berlin have been analysed. Thus, the in- and outgo-ing mass-exchanges through rectangular boundaries around Berlin and therefore around the main emission sources have been recorded on an hourly basis, integrated over the whole simulation time period. Transport processes only have been analysed. Chemical transformations, emission and deposi-tion processes which all contribute to an overall mass con-servation balance are not discussed explicitly.
3 Results
Simulating Berlin PM10concentration levels with and
with-out Berlin emissions gives an extreme estimate of the Berlin maximum potential contribution to the Berlin air pollution situations. Figure 1 shows the relative contribution of Berlin
emission sources to Berlin PM10air pollution concentrations,
subdivided into primary, total and secondary PM10
compo-nents and analysed at different representative areas inside the urban agglomerate. REM Calgrid considers elemental car-bon and primary organic carcar-bon, emitted by combustion pro-cesses, and mineral particles stemming from soils as primary
PM10 components, while secondary components comprise
inorganic (sulphate, nitrate, ammonium, sodium and
chlo-ride) and organic aerosols. Both fractions form Total PM10.
Primary PM10 in the city centre and in the central
residen-tial areas amount to more than 70% from Berlin emission sources, while in the outskirts only approximately 40% can be related to local emissions. Within ca. 25 km (city
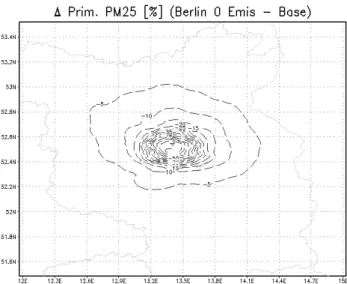
cen-Figure 2.Primary PM2.5concentration reduction due to total Berlin
emission reduction. Isolines in %, contour levels in 5% intervals. Light gray lines indicate political borders of Berlin and surrounding L¨ander and countries.
Figure 3.Secondary Sulphate aerosol concentration reduction due
to total Berlin emission reduction. Isolines in %, contour levels in 0.5% intervals. Light gray lines indicate political borders of Berlin and surrounding L¨ander and countries.
tre to outskirts) the influence of local PM10-sources to local
PM10concentrations is reduced by a factor of 1.75. The same
gradient is evident in the total PM10concentration reduction,
although the relative contribution of local emissions to local
concentrations is only half of that of primary PM10
concen-trations. Nevertheless, this is a strong indication, that total
PM10 reduction spatial distribution is dominated by that of
primary PM10 components. Furthermore, it is evident that
total PM10concentrations, even in the inner circle of the city,
are related only by approximately 40% by local emissions,
A. Kerschbaumer and M. Lutz: PM10in urban and in rural environments 55
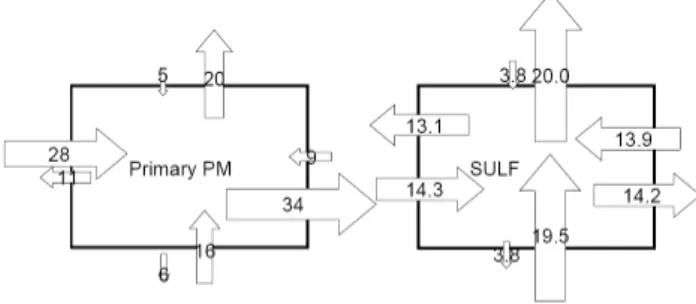
Figure 4. Absolute contribution of primary PM and Sulphate
aerosols (SULF) to Berlin PM10 concentrations due to horizontal advective processes through fictitious walls (arrows toward the rect-angle indicate accumulation processes, arrows from rectrect-angle indi-cate loss processes) in kilo-tons per year.
while ca. 60% are due to transport processes from outside the city. The local influence on secondary aerosol concentra-tions is all over Berlin only ca. 5%. Figure 2 shows contour
isolines of primary PM2.5 (modelled inert aerosols smaller
than 2.5 µm) reductions due to a total Berlin emission re-duction. Longer ranges of influence are simulated towards north. The 10% reduction isoline due to Berlin emissions is approximately between 50 km in the west and 60 km in the
east of the city centre. Thus, Brandenburg’s primary PM2.5
(comprising elemental carbon, primary organic carbon and mineral dusts smaller than 2.5 µm) concentrations inside of a roughly 20 km belt around Berlin can be ascribed for 10% only to Berlin Emissions. Considering the main secondary aerosol component sulphate (see Fig. 3) there is almost no contribution of Berlin emission sources to sulphate concen-trations. Also inside Berlin, only approximately 5% can be attributed to Berlin emissions. Fluxes toward and from the city of Berlin are also component specific (Fig. 4.). While
primary PM10come predominantly from the west and leave
the city mainly towards the east, sulphate aerosols enter the urban agglomerate mainly from the south and are exported toward the north. This indicates different sources for these different components, being the first in the west or local and the second in the south to south-east.
4 Discussion and conclusions
We simulated with a chemistry transport model the growth and loss of secondary pollutions considering non-linear effects of different variables such as emissions, atmospheric conditions and solar insolation. Primary particles do not undergo any chemical processes in the model. Emission, deposition and transport are the only processes contributing to the primary particle concentrations. Secondary aerosols, however, undergo chemical transformations from gaseous to solid phases and are thus highly non-linear in their formation, thus altering the amount of one species alters the whole chemistry chain. Emission scenarios varying the amount of individual precursor species by different
percent-ages, however, have shown, that reductions of 50% NOx
Berlin emissions lead to a comparable amount of reduced secondary aerosol concentrations. The overall reduction of maximum 5% is not compromised by the non-linear effects of aerosol chemistry. The local extension of Berlin is too small to influence the long-term character of secondary aerosols. In conclusion, it has been shown that local sources
are responsible for local PM10 concentrations only by
approximately 40% in the Berlin residential areas. Primary particles have their origin and their fate in the city being related mainly to traffic- and industry-related combustion processes. Moreover, a strong contributor to local primary
PM10accumulations is wind-blown dust in form of minerals
in the atmosphere. The re-suspended material from roads
due to traffic-induced turbulences is another important PM10
source in cities which cannot be reduced but with traffic reduction. Estimates of these turbulence related emissions, whoever, are even more uncertain than direct emissions. Nevertheless, they are responsible for a considerable part
of PM10-concentrations in urban environments. Secondary
aerosols have their origin in remote areas, mainly in the
south or south-east of Berlin. The contribution of local
emission sources to local secondary aerosol concentrations is very limited.
Edited by: A. Baklanov
Reviewed by: two anonymous referees References
Lenschow, P., Abraham, H.-J., Kutzner, K., Lutz, M., Preuss, J., and Reichenb¨acher, W.: Some ideas about the sources of PM10, Atmos. Environ., 35, 1, 23–33, 2001.
Reimer, E., Kerschbaumer, A., Beekmann, M., and M¨oller, M.: Measurement campaign HOVERT: Aerosol transports, Geophys. Res. Abstr., 6, 04234, 2004.
Stern, R., Yamartino, R., and Graff, A.: Dispersion modelling within the European Community’s Air Quality Directives: long term modelling of O3, PM10and NO2, 26th ITM on Air Pollu-tion Modelling and its applicaPollu-tion, May 26–30, Istanbul, Turkey, Abstract No. 6.13, 2003.
Thunis, P., Rouil, L., Cuvelier, C., Stern, R., Kerschbaumer, A., Bessagnet, B., Schaap, M., Builtjes, P., Tarrason, L., Douros, J., Moussiopoulos, N., Pirovano, G., and Bedogni, M.: Analysis of model responses to emission-reduction scenarios within the CityDelta project, Atmos. Environ., 41, 1, 208–220, 2007. van Loon, M., Vautard, R., Schaap, M., Bergstr¨om, R., Bessagnet,
B., Brandt, J., Builtjes, P. J. H., Christensen, J. H., Cuvelier, C., Graff, A., Jonson, J. E., Krol, M., Langner, J., Roberts, P., Rouil, L., Stern, R., Tarrason, L., Thunis, P., Vignati, E., White, L., et al.: Evaluation of long-term ozone simulations from seven re-gional air quality models and their ensemble, Atmos. Environ., 41, 10, 2083–2097, 2007.