HAL Id: hal-00316923
https://hal.archives-ouvertes.fr/hal-00316923
Submitted on 1 Jan 2002
HAL is a multi-disciplinary open access
archive for the deposit and dissemination of
sci-entific research documents, whether they are
pub-lished or not. The documents may come from
teaching and research institutions in France or
abroad, or from public or private research centers.
L’archive ouverte pluridisciplinaire HAL, est
destinée au dépôt et à la diffusion de documents
scientifiques de niveau recherche, publiés ou non,
émanant des établissements d’enseignement et de
recherche français ou étrangers, des laboratoires
publics ou privés.
at 52° N in the period 1988?2000
H. R. Middleton, N. J. Mitchell, H. G. Muller
To cite this version:
H. R. Middleton, N. J. Mitchell, H. G. Muller. Mean winds of the mesosphere and lower thermosphere
at 52° N in the period 1988?2000. Annales Geophysicae, European Geosciences Union, 2002, 20 (1),
pp.81-91. �hal-00316923�
Annales
Geophysicae
Mean winds of the mesosphere and lower thermosphere at 52
◦
N in
the period 1988–2000
H. R. Middleton1, N. J. Mitchell1, and H. G. Muller2
1Department of Physics, University of Wales Aberystwyth, Penglais, Aberystwyth, Ceredigion, Wales, SY23 3BZ, UK 2University of Cranfield, Royal Military College of Science, Shrivenham, Swindon, SN6 8LA, UK
Received: 24 April 2001 – Revised: 19 July 2001 – Accepted: 28 August 2001
Abstract. A meteor radar in the UK (near 52◦N) has been
used to measure the mean winds of the mesosphere/lower-thermosphere (MLT) region over the period 1988–2000. The seasonal course and interannual variability is characterised and comparisons are made with a number of models. Annual mean wind trends were found to be +0.37 ms−1yr−1for the zonal component and +0.157 ms−1yr−1for the meridional component. Seasonal means revealed significant trends in the case of meridional winds in spring (+0.38 ms−1yr−1) and autumn (+0.29 ms−1yr−1), and zonal winds in summer (+0.48 ms−1yr−1) and autumn (+0.38 ms−1yr−1). Signifi-cant correlation coefficients, R, between the sunspot number and seasonal mean wind are found in four instances. In the case of the summer zonal winds, R = +0.732; for the winter meridional winds, R = −0.677; for the winter zonal winds, R = −0.472; and for the autumn zonal winds R = +0.508. Key words. Meteorology and atmospheric dynamics (cli-matology; general circulation; middle atmospheric dynam-ics)
1 Introduction
The general circulation of the mesosphere/lower-thermosphere (MLT) region is profoundly influenced by the deposition of momentum by waves ascending from lower heights. This momentum transfer leads to departures from the purely zonal geostrophic flow predicted by the consideration of radiative equilibrium alone. In particular, this “wave driving” results in significant ageostrophic meridional flows, which in turn, by continuity requirements, produce slow but sustained up-welling and down-welling in the mesosphere. The consequent adiabatic heating and cooling caused by these vertical motions forces the temperature structure away from the radiative equilibrium state and results in non-radiative equilibrium zonal winds. There is thus an intimate coupling between the upward flux Correspondence to: H. R. Middleton (hrm@aber.ac.uk)
of atmospheric waves, the temperature structure and the mean winds of the MLT region. A full understanding of the MLT region thus requires detailed investigation of all these phenomena, and their coupling mechanisms and variability.
Although the mean winds of the MLT region have been measured by a wide variety of techniques, there have been comparatively few studies of sufficient duration to allow in-vestigation of the variability and trends in the mean winds on decadal and longer time scales. Nevertheless, such studies are important because theoretical work indicates that the cir-culation of the MLT region may be influenced by long-term anthropogenic climate change and the 11-year solar cycle (e.g. Balachandran and Rind, 1995; Thomas, 1996; Arnold and Robinson, 1998). Among the long-term studies reported are observations made by meteor radar (e.g. Merzlyakov and Portnyagin, 1999), LF D1 measurements (e.g. Bremer et al., 1997; Jacobi, 1998; Jacobi et al., 2001) and MF radar (e.g. Namboothiri et al., 1994). These studies have suggested that in addition to significant interannual variability, there exists decadal-scale variability which may include a solar cycle in-fluence. In this study, we report observations made by me-teor radar in the years 1988–2000 over the UK. In particular, we present measurements of the monthly-mean winds and seasonal-mean winds, and their variability and trends over this period. In Sect. 2, we give details of the radar, the data and the analysis. Section 3 will detail the results of the anal-yses and give a brief discussion of how they relate to other studies. Companion papers will report analyses of the be-haviour of tides and planetary waves, using the same data set.
2 Data
The meteor radar used in this study was developed in the 1970s and at first was used only for short campaigns of ob-servation. By the late 1980s, it was capable of continuous op-eration, and has operated in runs consisting of several years in duration ever since. Occasional interruptions in the data
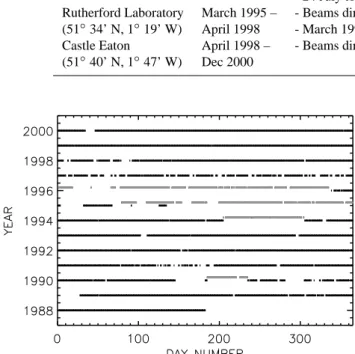
Table 1. Details of the radar’s location over the period of 1988–2000. Note that during the interval of March 1995 to May 1995, observations were made at both Sheffield and RAL
Location Date Notes
Sheffield Jan 1988 – - Beams usually directed NW (bearing 315◦) and SW (225◦); NW and NE (53◦23’ N, 1◦27’ W) May 1995 (45◦) before October 1990 and for short periods after
- July to Dec 1988 – no data available
- 24 July to 2 Nov 1994 – only data from the NW aerial available Rutherford Laboratory March 1995 – - Beams directed NW (bearing 300◦) and NE (30◦)
(51◦34’ N, 1◦19’ W) April 1998 - March 1995 to Dec 1996 – only NW aerial functional (NW – 300◦) Castle Eaton April 1998 – - Beams directed NW (bearing 300◦) and NE (30◦)
(51◦40’ N, 1◦47’ W) Dec 2000
Fig. 1. A schematic representation of the extent of data available from the meteor radar. Lines in black indicate data recorded when two orthogonal aerials were available. Lines in grey indicate data recorded when only one aerial was available.
set were caused when the radar was moved to different sites within the UK, although all were near 52◦N. Throughout this time, the system hardware remained largely unchanged.
The radar is a pulsed system that produces two orthogo-nal, low-elevation beams which are used to derive zonal and meridional winds. A detailed description of the radar can be found elsewhere (Muller et al., 1995). Occasionally, only one beam was available, and so separate orthogonal wind compo-nents could not be determined. Here we will consider only data recorded when two beams were available, allowing in-dependent zonal and meridional wind components to be de-rived. In this work, we will consider data recorded in the interval between January 1988 to December 2000. Precise details of the location of the radar and the beam configura-tion at particular times are given in Table 1. A schematic of the available data is presented in Fig. 1.
During the majority of the period considered here, the radar operated without a receiver interferometer and so no height information about the individual meteor echoes was available. The measured winds are, therefore, considered representative of a height of about 90–95 km, which is the approximate height of the maximum meteor count rate (e.g.
Mitchell et al., in press).
Since the available data from the UK radar spans some 13 years, possible changes in the height of the meteor region over this period must be considered; in particular, possible changes connected to the 11-year solar cycle. Meteor radars do not depend on background ionisation present in the atmo-sphere, but rather on the ionisation caused by ablating me-teoroids. The height at which ablation occurs is, in part, a function of atmospheric density. Changes in the height of density contours in the atmosphere may, therefore, produce changes in the height of the meteor region. In the absence of accurate height information, the possibility that significant variations in the height of the meteor region occur over the course of a solar cycle must be considered.
To investigate this further, density estimates in the 90–95 km height range were taken from the MSISE-90 model atmosphere (Hedin et al., 1991; also see http://nssdc.gsfc.nasa.gov/space/model/atmos/msise.html). Comparing density values for every month in 1990 (solar maximum) and 1996 (solar minimum), it was found that the change in density from solar maximum to solar minimum is usually less than 2% and never greater than 6%. Given that the scale height in this region is about 4–6 km, even the greatest change in density from solar maximum to solar minimum would vertically displace contours of constant density by only approximately 100 m or less. Therefore, we conclude that there is no significant change in the height of the meteor region over this solar cycle.
Hourly-mean horizontal winds were calculated in each beam direction using a two-hour running Hamming window, incremented in one-hour steps. These were then combined in a vector addition to yield hourly zonal and meridional winds. The daily meteor count rate displays a strong diur-nal variation (the dawn to dusk ratio is about 5:1) due to both the effects of beam geometry and astronomical varia-tions. To avoid under-representing the afternoon and evening (the times of lowest count rate), which would affect the mean through the diurnal tide, a superposed epoch (or composite day) method was employed to calculate the monthly means for each component. In this method, for each hour of the day, a mean was taken of all the values for that hour over the month. This gave a mean diurnal course for that month.
JanFebMarAprMayJun Jul AugSepOctNovDec -20 -10 0 10 20 30
JanFebMarAprMayJun Jul AugSepOctNovDec -20 -10 0 10 20 30
JanFebMarAprMayJun Jul AugSepOctNovDec -20 -10 0 10 20 30
JanFebMarAprMayJun Jul AugSepOctNovDec -20 -10 0 10 20 30 Velocity (ms -1 ) (d) (c) Velocity (ms -1 ) (b) Velocity (ms -1 ) (a) Velocity (ms -1 )
Fig. 2. Observed and model zonal winds (positive winds are east-wards): (a) Observed monthly-mean zonal wind, 1988–2000; er-ror bars indicate standard deviations. (b) CIRA-86 zonal winds for 93.3 km. (c) HWM-93 zonal winds for 90 km (d) HWM-93 zonal winds for 95 km.
A simple mean over this composite day yielded a monthly mean wind value.
3 Results
3.1 Mean seasonal cycle
In order to determine the representative seasonal behaviour of the zonal and meridional winds at 52◦N, the monthly-mean wind velocities for each month in the 13 years of data available were averaged. First, we will consider the results for the zonal wind. Figure 2a presents the monthly-mean winds measured between 1988 and 2000. The error bars indi-cate the standard deviation of the individual monthly means comprising each value. The figure shows a zonal wind that is positive (eastward) throughout the year except in spring to early summer. The annual course begins with a velocity of between 5–10 ms−1in January and February, followed by a velocity near zero in March, followed by a short spring re-versal which is strongest in April when wind speeds reach over 10 ms−1westwards. Early summer sees the return of an
JanFebMarAprMayJun Jul AugSepOctNovDec -15 -10 -5 0 5 10
JanFebMarAprMayJun Jul AugSepOctNovDec -15 -10 -5 0 5 10
JanFebMarAprMayJun Jul AugSepOctNovDec -15 -10 -5 0 5 10 (a) Velocity (ms -1 ) (b) Velocity (ms -1 ) (c) Velocity (ms -1 )
Month
Fig. 3. Observed and model meridional winds (positive winds are northwards/poleward): (a) Observed monthly-mean meridional wind, 1988–2000; error bars indicate standard deviations. (b) HWM-93 meridional winds for 90 km (c) HWM-93 meridional winds for 95 km.
eastward flow, which peaks in August at over 15 ms−1and
then weakens to less than 5 ms−1in October, before return-ing to values between 5–10 ms−1in November and Decem-ber. The standard deviation shown by the error bars can be ∼50 − 100% of each mean value, indicating a high degree of interannual variability (see Sect. 3.2).
We will now compare the UK observations with the CIRA-86 and HWM-93 empirical model atmospheres. Figure 2b presents the CIRA-86 zonal winds for a height of 93.3 km and latitude of 55◦N. This height was chosen since it was close to the height at which the maximum meteor counts are detected. In comparison with the observations, the seasonal pattern of the CIRA-86 winds has two maxima, not one. The first maximum in the model occurs in April, when the veloc-ity reaches about 30 ms−1, whereas the observations at this time show a minimum of about −10 ms−1. The second peak in the model occurs in September with a velocity of 25 ms−1, while the observed summer maximum peaked a month ear-lier at around 15 ms−1. The CIRA-86 winds are negative (westwards) in January and February. However, as evident from Fig. 2a, the observed reversal actually takes place at the spring equinox and in early summer. Similar
discrepan-Fig. 4. Monthly-mean zonal winds (ms−1), 1988–2000. The zero wind line is indicated by the heavy dashed contour.
cies between observed winds and the CIRA-86 winds for the MLT region were also found by Manson et al. (1991).
Figures 2c and 2d present the HWM-93 model zonal winds at 55◦N for heights of 90 km and 95 km, respectively. The main difference between the observations and the model winds at 90 km is that the strength of the summer model winds is less than observed; the model winds only reach 9 ms−1. The weak winds of about 4 ms−1observed at the autumnal equinox are also not evident in the model. How-ever, the HWM-93 model at 95 km (Fig. 2d) agrees quite well with the observations in Fig. 2a. For instance, the max-imum summer winds measured were 18 ms−1in August and
the model gives a maximum wind of 20 ms−1in July. The major difference between HWM-93 at both 90 and 95 km and the observations is that the model winds become weaker but do not actually reverse, as observed at the spring equinox. The general seasonal pattern of Fig. 2a has also been reported in other observations of the mid-latitude northern hemisphere. For example, Massebeuf et al. (1979) examined 6 years of data from a meteor radar at Garchy, France (47◦N, 3◦E) and Manson and Meek (1986) presented profiles of the mean wind measured by MF radar in 1981 and 1982 over Saskatoon, Canada (52◦N, 107◦W). In both these studies, heights of 90–95 km were selected from those presented for comparison with the results reported here. More recently, Jacobi et al. (2001) presented mean winds measured by MF radar at 88 km over Saskatoon, and by the LF D1 method at 94 km over Collm (52◦N, 15◦E) between 1983 and 1998. A comparison of all these results with the UK data presented in Fig. 2a reveals generally good agreement. In particular, the episode of westward flow near the spring equinox is evident in these other studies.
The observed meridional winds are shown in Fig. 3a. They are generally much weaker and more variable than the zonal winds. Again, the standard deviation of the individual
Fig. 5. As Fig. 4, except meridional wind.
monthly means used to derive each data point is indicated by the error bars. In the period between October and April, the mean meridional winds are poleward, but very weak and generally less than 2.5 ms−1. However, in proportion to the
magnitude of these velocities, the interannual variability as indicated by the error bars, is considerable, and equator-ward flow can occur in all months (see Sect. 3.2). The strongest winds are equator-ward and occur between May and August, after the early summer reversal. The strongest flow occurs in June when the 13-year mean reaches −8 ms−1. The CIRA-86 model does not provide meridional winds, so comparison will only be made with HWM-93. The seasonal patterns of meridional wind given by HWM-93 are quite different be-tween 90 and 95 km. At 90 km, the general form matches well the observed seasonal pattern; the minimum occurs at the right time of year, but only drops to −4 ms−1, whereas the observed winds drop to −8 ms−1, although the differ-ences may not be statistically significant. At 95 km, the ve-locities are also very small in the HWM-93 winds but the direction of flow (poleward in summer, equator-ward in win-ter) is the opposite to that observed.
The meridional wind profiles at 93 km over Saskatoon in 1981 and 1982 presented by Manson and Meek (1986) show a similar pattern to the data presented in Fig. 3a, i.e. strongly equator-ward during the summer and weakly pole-ward for the rest of the year. However, the 16-year mean monthly meridional winds found at 88 km over Saskatoon and at 94 km over Collm (both near 52◦N) are equator-ward all year round (Jacobi et al., 2001), although in the case of Saskatoon, this is not true at every height.
Both the zonal and meridional winds presented here agree well with the Global Empirical Wind Model of Portnyagin and Solovjova (2000). The general observed pattern of zonal winds, with a spring minimum and a summer maximum, as well as the meridional winds, with low but positive velocities throughout the winter and a summer minimum, can be found
in this model.
3.2 Interannual variability
The significant standard deviations displayed in the 13-year means of monthly wind in Figs. 2a and 3a indicate that there is considerable variability in the strength of the monthly-mean winds from year to year. To investigate this interannual variability, we will consider the individual years of data.
Figures 4 and 5 present contours of all the available monthly-mean winds. The gap in the figures which covers part of 1994, the latter half of 1995 and most of 1996 results from occasions when data from only one aerial was available, and so zonal and meridional winds could not be determined. These figures provide a clear indication of how the monthly-mean winds vary from year to year.
Considering the zonal winds of Fig. 4, the seasonal course evident in Fig. 2a is seen to repeat every year. In all years, there is a reversal to strong westward flow in spring, with the strongest eastward winds occuring in August. The strength of the spring reversal and the winds in autumn and winter appear to vary irregularly on time scales of 3–5 years, pos-sibly reflecting different levels of stationary planetary wave activity in successive years.
In contrast, the strength of the summer maximum appears to vary on a longer, decadal scale. The eastward flow in August varies over the years observed with a maximum of greater than 19 ms−1in 1989–1990, and a second maximum of greater than 20 ms−1in 1999–2000. An extended min-imum, which reaches values as low as 11 ms−1 in 1997, separates these maxima (this behaviour is even clearer if the months July–September are considered). This decadal scale of variability will be considered in light of the solar cycle in Sect. 3.5.
An identical analysis of the monthly-mean meridional winds is shown in Fig. 5. It is apparent from the figure that in every year, there is equator-ward flow in summer, although the duration and the strength of the episodes of equator-ward flow vary greatly from year to year. For instance, in 1993, the flow is equator-ward from February to Septem-ber and reaches values of −13 ms−1, whereas in 1997, the flow is equator-ward only in July and is never stronger than −3 ms−1. The summer flow appears to vary on a time scale of a few years. For example, there is an episode of strong equator-ward flow from 1990–1993, followed by an episode of weaker flow, lasting until 1998. In contrast, the strength and direction of the flow in the other seasons appears to fluc-tuate from year to year in a rather irregular fashion with time scales of 3–5 years.
3.3 Annual mean winds
Annual mean mesospheric winds measured by meteor radar for 31 years over Obninsk (55◦N) and Collm/Kuhlungsborn (51◦N/54◦N) have been reported by Merzlyakov and Port-nyagin (1999). Portnyagin et al. (1993) reported annual mesospheric winds measured for 17 years over Heiss Island
1988 1990 1992 1994 1996 1998 2000 -4 -2 0 2 4 6 8 10 1988 1990 1992 1994 1996 1998 2000 -4 -2 0 2 4 6 8 10 Velocity (ms -1 ) Year (b) (a) Velocity (ms -1 ) Year
Fig. 6. Annual-mean winds: a) Zonal, b) Meridional and associated linear fits.
(81◦N) and 19 years over Molodezhnaya (68◦S). All these
observations revealed significant long-term changes in the strength of the annual mean wind.
Annual means of the UK data were calculated by averag-ing the monthly-mean wind values. The zonal and merid-ional annual-mean winds are presented in Figs. 6a and 6b, respectively. For the zonal annual winds, a linear fit yields a trend of (+0.37 ± 0.13) ms−1yr−1, with a correlation co-efficient, R = 0.72, and a confidence level (calculated by Fisher’s Z-transformation) of over 98%. Thus, we find an increase in the strength of the zonal wind over the period 1988–2000. In the case of the meridional winds, the analy-sis yields a trend of (+0.16 ± 0.10) ms−1yr−1(R = 0.50),
with a confidence level of just less than 85%. This equates to a decrease in the strength of the equator-ward flow averaged over the whole year and a recent change to an annual average flow which is poleward.
In contrast, the long-term mid-latitude annual zonal means presented by Merzlyakov and Portnyagin (1999) revealed a systematic decrease in the strength of the zonal wind over the interval 1964–1995, with a rate of change of about 0.11 ms−1 yr−1. However, we note that examination of the annual zonal means presented by these authors reveals that within this long-term decrease, a positive trend was ob-served from 1979–1995 over Collm/Kuhlungsborn. The Arc-tic and AntarcArc-tic results of Portnyagin et al. (1993) also re-vealed a systematic decrease in annual zonal winds of about 0.5 ms−1yr−1over the interval 1968–1997.
Merzlyakov and Portnyagin (1999) also reported a signif-icant systematic decrease in the strength of the annual-mean meridional flow over the period 1964–1995, from about −7 ms−1to −2 ms−1 over Collm/Kuhlungsborn and from about −3 ms−1to −2 ms−1over Obninsk.
We should note that although long-term trends are evident in the long-term data sets discussed above, the level of vari-ability is such that episodes of opposite trend can occur with
1988 1990 1992 1994 1996 1998 2000 0 5 10 1988 1990 1992 1994 1996 1998 2000 0 5 10 15 1988 1990 1992 1994 1996 1998 2000 -10 -5 0 1988 1990 1992 1994 1996 1998 2000 5 10 15 20 (d) Autumn Velocity (ms -1 ) Year Year Velocity (ms -1 ) (b) Spring Year Velocity (ms -1 ) (c) Summer (a) Winter Year Velocity (ms -1 )
Fig. 7. Zonal seasonal-mean winds and associated linear fits.
durations of the order of ten years. The detailed structure of this variability probably reflects the many possible influences on the MLT region circulation.
3.4 Seasonal trends
The data presented in Figs. 4 and 5 suggest that the winds in each season may exhibit different types of interannual vari-ability. In this section, we will investigate seasonal trends displayed in three-monthly seasonal means over the duration of the data set (the specific case of solar cycle variability will be considered in Sect. 3.5).
Three-monthly seasonal means were calculated for each year. Here we define spring as the period of March–May, summer as June–August, autumn as September–November and winter as December–February. In cases where only two monthly means were available in a particular season in a par-ticular year (due to gaps in the data), the mean for the season was still calculated. However, if only one month was avail-able, no seasonal mean was produced.
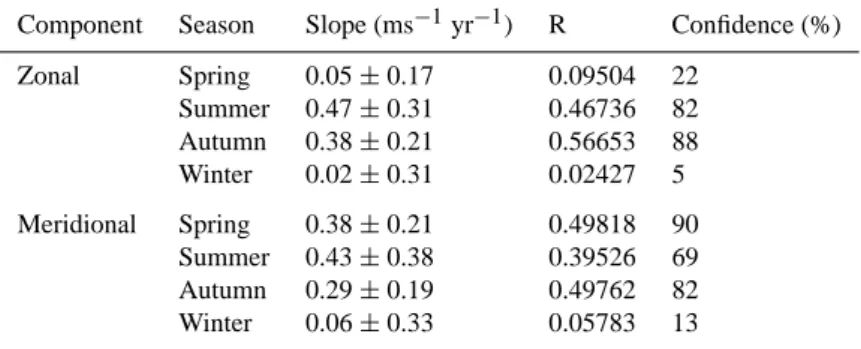
Figures 7a to d and 8a to d show the seasonal means of the zonal and meridional winds, respectively. A best-fit straight line for each data set is indicated on each figure. Table 2 lists the gradient of each line, the correlation coefficient and con-fidence level, as evaluated by the Fisher Z-transformation. We note that the gradients of all of these straight line fits are
1988 1990 1992 1994 1996 1998 2000 -5 0 5 1988 1990 1992 1994 1996 1998 2000 -5 0 5 10 1988 1990 1992 1994 1996 1998 2000 -6 -4 -20 2 4 6 1988 1990 1992 1994 1996 1998 2000 -10 -5 0 (a) Winter Velocity (ms -1 ) Year Year (b) Spring Velocity (ms -1 ) Year (c) Summer Velocity (ms -1 ) Year (d) Autumn Velocity (ms -1 )
Fig. 8. Meridional seasonal mean winds and associated linear fits.
positive. However, here we will only consider those gradi-ents with confidence levels in excess of 80%, i.e. zonal winds in summer and autumn and meridional winds in spring and autumn.
Comparing the zonal winds for all seasons (Figs. 7a to d), it is noticeable that in spring, autumn and winter, the sea-sonal means vary greatly from year to year. In contrast, in summer, over the period 1989–1997 there is a monotonic de-crease in the winds, and the summer-mean winds change by less than 2 ms−1 from year to year. This period of steady decrease ends abruptly in 1997, after which the strength of the summer winds increases dramatically. Overall, the gradi-ent for the summer zonal winds is (+0.47 ± 0.31) ms−1yr−1 with a confidence level of 82%. The winds in autumn also in-crease with time at a rate of (+0.38 ± 0.20) ms−1yr−1with a confidence level of 88%.
Considering the meridional winds of Figs. 8a to d, it can be seen that in all seasons, there is a high degree of vari-ability from year to year. Nevertheless, the decrease in the strength of the spring equator-ward winds at a rate of (+0.38 ± 0.21) ms−1yr−1reaches the 90% confidence level and the trend of (+0.29 ± 0.19) ms−1 yr−1 in the autumn winds reaches a confidence level of 82%.
A limited number of other studies have also considered the variability of seasonal-mean winds of the mesosphere on decadal and longer time scales. Merzlyakov and
Port-Table 2. Gradients and errors, correlation coefficients and confidence level (Fisher’s Z transformation) of best-fit straight lines fitted to seasonal winds over the interval of 1988–2000
Component Season Slope (ms−1yr−1) R Confidence (%) Zonal Spring 0.05 ± 0.17 0.09504 22 Summer 0.47 ± 0.31 0.46736 82 Autumn 0.38 ± 0.21 0.56653 88 Winter 0.02 ± 0.31 0.02427 5 Meridional Spring 0.38 ± 0.21 0.49818 90 Summer 0.43 ± 0.38 0.39526 69 Autumn 0.29 ± 0.19 0.49762 82 Winter 0.06 ± 0.33 0.05783 13
nyagin (1999) report decreases over the period of 1964– 1995 in the strength of both the zonal winds in summer (−0.22 ms−1yr−1) and winter (−0.38 ms−1yr−1), and the meridional winds in summer (−0.09 ms−1yr−1). There ap-pears to be no significant change in the strength of the merid-ional winter winds (estimated from their figures). However, within the 31 years considered by Merzlyakov and Portnya-gin (1999), there is considerable variability on decadal time scales, and so significantly different gradients can be calcu-lated if one were to consider shorter subsections of the full data set.
Jacobi et al. (2001) considered seasonal-mean winds mea-sured by MF radar and the LF D1 technique in the period of 1982–1999. The MF radar data recorded at 88 km over Saskatoon (52◦N) and the LF D1 data recorded at 94 km over Collm (52◦N) did not reveal a systematic trend in the sum-mer zonal winds. However, trends of about +0.18 ms−1yr−1 were reported in the summer meridional winds over both sites.
3.5 Solar cycle effects
The UK data set is some 13 years in length and covers the solar maxima of 1989–1990 and 2000 and the solar minimum of 1996–1997. Although ideally, several solar cycles worth of data should be available for studies of solar cycle influence on the MLT region, it is nevertheless interesting to examine the data in light of a possible solar cycle connection.
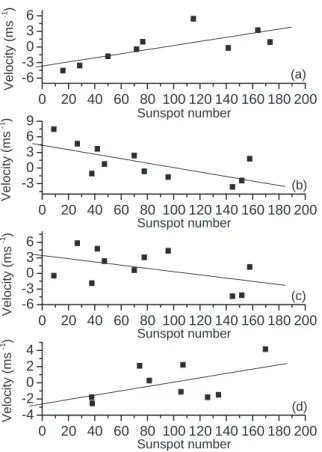
The correlation coefficient between the detrended seasonal-mean wind (i.e. the residual winds after subtraction of the trends detailed in the previous section) and the seasonal-mean sunspot number was calculated for both the zonal and meridional wind components for all four seasons, yielding eight results. In two of these eight seasonal cases, correlations were found with confidence levels of about 98%, and in another two seasons, correlations with confidence levels of over 80% were found. The sunspot numbers and detrended winds with associated lines of best fit for these four most significant cases are presented in Figs. 9a to d. In summer, the correlation between the seasonally averaged sunspot number and the detrended zonal winds is +0.732 (Fig. 9a). The correlation coefficient in the case of the
meridional winter detrended seasonal mean winds is −0.677 (Fig. 9b). Both of these results have confidence levels of around 98%. The correlation found between the seasonally averaged sunspot number and the zonal winter mean winds is −0.472 with a confidence level of 85% (Fig. 9c) and that found with the zonal autumn winds is +0.508 with a confidence level of 83% (Fig. 9d). The high confidence level in the correlation of the detrended summer zonal mean winds, as a function of the seasonal mean sunspot number (Fig. 9a), reflects what may be seen in the contour plot of Fig. 4, where the summer zonal mean wind is strongest near the solar maxima.
A number of other studies have also reported an apparent connection between the strength of the mesospheric mean winds and the solar cycle, although the results sometimes appear to be contradictory. For example, in the case of the zonal winds, Sprenger and Schminder (1969) found a posi-tive correlation for winter months of 1957–1968, between the zonal wind strength measured by the LF D1 method and the phase of the solar cycle. No summer data were considered by these authors. Bremer et al. (1997) considered LF D1 measurements made between 1964–1994 and also found a positive correlation between solar activity and the zonal pre-vailing wind in winter. These authors also found a negative correlation in summer, unlike that found in the present study. Jacobi (1998) also reported a negative correlation between the 13-month running mean sunspot number and the summer zonal wind measured by the LF D1 method for 1973–1996, but found no relationship with the winter zonal wind. Nam-boothiri et al. (1993) considered MF radar data covering the years 1979–1990 and found a positive correlation with the zonal winter winds and a negative correlation with the zonal summer winds. Thus, in three of these studies (Sprenger and Schminder, 1969; Namboothiri et al., 1993; Bremer et al., 1997), the correlation coefficient between the zonal wind in winter and solar activity has the opposite sign to that reported here, and in one of these studies (Jacobi, 1998), no significant correlation was reported.
In the case of the meridional winds, two of the above stud-ies (Sprenger and Schminder, 1969 and Bremer et al., 1997) found a positive correlation between the meridional winter prevailing wind and solar activity, which is in disagreement
0 20 40 60 80 100 120 140 160 180 200 -6 -3 0 3 6 0 20 40 60 80 100 120 140 160 180 200 -3 0 3 6 9 0 20 40 60 80 100 120 140 160 180 200 -6 -3 0 3 6 0 20 40 60 80 100 120 140 160 180 200 -4 -2 0 2 4 (c) Velocity (ms -1 ) Sunspot number (b) Velocity (ms -1 ) Sunspot number (a) Velocity (ms -1 ) Sunspot number (d) Velocity (ms -1 ) Sunspot number
Fig. 9. Detrended seasonal-mean winds against seasonally-averaged sunspot number for (a) zonal winds in summer, (b) merid-ional winds in winter, (c) zonal winds in winter and (d) zonal winds in autumn. The best-fit straight line is indicated.
with the negative correlation found here (Bremer et al., 1997 described the connection as being “slight”). All of these re-sults therefore, disagree to some extent with those presented here, and at least in some respects, with each other.
In contrast, Merzlyakov and Portnyagin (1999) reported correlations of R = −0.425 between the zonal wind in win-ter and the sunspot number, which is in good agreement with our value of R = −0.472 (confidence level of 83%). Greisiger et al. (1987) also reported a negative correlation between the zonal winter wind and the solar cycle (mea-sured by F10.7 radio flux), as observed here, but only be-tween 1975–1976 and 1983–1984, after which the behaviour changes again. However, Merzlyakov and Portnyagin also found a correlation of R = +0.42 between the sunspot num-ber and the summer meridional wind, where no significant result was found in the present study.
Three important factors have to be considered in attempt-ing to understand these differences. First, the upper-MLT re-gion addressed by the various techniques is characterised by strong vertical gradients (and even reversals) in the strength of the mean flow, particularly the zonal wind. Changing the height at which measurements are made can therefore, change the measured winds, even if there was no actual varia-tion in the winds themselves. The various techniques consid-ered here have different responses to the changes that might
1988 1989 1990 1991 1992 1993 1994 1995 1996 1997 1998 1999 2000 2001 -6 -4 -2 0 2 4 6 8 10 12 Velocity (ms -1) Year Zonal Meridional
Fig. 10. 12-month running mean of zonal and meridional monthly-mean winds.
be anticipated in the MLT region over a solar cycle. This may change the height at which measurements are made. For instance, the height variation of LF D1 measurements near 95 km over a typical solar cycle is thought to be about 1–1.5 km (Jacobi, 1998). Due to the shear in the zonal wind, this could contribute to an apparent dependence of zonal wind on solar activity up to about 3 ms−1if the results were interpreted in the absence of height information, such as the measurements made at Collm before 1983. Note that the study of Jacobi (1998) was made with height information available, and so it is not subject to this effect.
Meteor-radar wind measurements made by systems with-out height finding (such as those used in the present study and by Merzlyakov and Portnyagin, 1999) reflect the vertical dis-tribution of meteor echoes recorded by each particular radar. It is generally assumed that the winds from such radars are effectively representative of heights near the peak in the ra-dio meteor distribution at heights of 90–95 km. However, as discussed earlier, it is not thought that significant changes in the height distribution of meteors (and thus the winds mea-sured in the presence of a wind shear) occur over the solar cycle. MF radars operate with accurate height finding and so, are largely unaffected by the known changes in the reflec-tion height over a solar cycle. Thus, in the case of the studies considered here, it is not likely that the differences can be ex-plained as a result of differing instrumental response to solar cycle variations in atmospheric properties.
The second factor to be considered is that the various tech-niques actually measure winds at slightly different heights. For example, MF radars are generally regarded as produc-ing their best data at heights below 90 km, whereas meteor radars without height finding produce winds representative of the 90–95 km range. If the solar cycle induces a change in the circulation of the atmosphere which varies as a function
Fig. 11. Lomb periodogram of the monthly-mean winds, 1988–2000. Confidence levels of 50% and 99.9% are indicated.
of height across the MLT region, then different techniques may record different responses, simply reflecting their mea-surement heights. Some modelling studies have indicated that the response of the middle atmosphere circulation to the solar cycle may vary with height, season and latitude. For example, Arnold and Robinson (1998) suggested that plan-etary wave activity is increased at times of solar maximum, and that this, in turn, affects the strength of the mean flow. In particular, they suggest that from solar maximum to solar minimum, the speed of the MLT region zonal flow, above the mesospheric jet in the summer southern hemisphere, may not change at all at heights of 75–80 km, but may change by up to 13 ms−1at heights near 90 km. In other words, the response to the solar cycle may vary strongly with height across the MLT region. If a similar response occurred in the northern hemisphere, then this should certainly be detectable by MLT radars, but it would also mean that a difference of a few km in measurement height might yield significantly different levels of solar cycle response.
Finally, differences between various studies may arise if different years of data are considered. This could also be the case if the response of the atmosphere to solar forcing changed from cycle to cycle. More significantly, the atmo-sphere may well exhibit a natural decadal-scale variability which is independent of the solar cycle. Evidence to support this view is provided by the 30 year long data set presented in Merzlyakov and Portnyagin (1999). The zonal annual means, for example, display different trends within different subsec-tions of the whole period of observation; there is no obvi-ous repeated pattern throughout the entire period recorded.
Any solar cycle signature may be hidden by overlying nat-ural variability and therefore may require observations over several decades in order to reveal its presence.
3.6 Quasi-biennial periodicities
Kane et al. (1999) reported periodicities of about 2–2.9 years in mesospheric wind data measured by MF radar over Saska-toon. A 12-month running mean of zonal and meridional winds suggested peak values occurring approximately every 24–30 months. The authors interpreted this behaviour as a quasi-biennial oscillation (QBO) in the mesospheric winds.
A 12-month running mean was calculated for the zonal and meridional mesospheric winds recorded by the UK me-teor radar. The results of this analysis are presented in Fig. 10. As can be seen from the figure, although successive maxima and minima occur in the zonal 12-monthly mean winds between 1989 and 1993 with a spacing of around 2 years (e.g. the minima occurring in 1988, 1990 and 1992), after 1993, this system disappears. The meridional 12-monthly running mean displays no apparent periodicity.
To further investigate possible periodicities of about 2 years in the data set, a Lomb periodogram analysis of the monthly mean winds was performed (Press et al., 1992). This method is particularly useful here because it enables a spec-trum to be calculated from an incomplete data set. The re-sults of this analysis, presented in Fig. 11, clearly show the annual and semiannual harmonics of the prevailing wind in both the zonal and meridional components, but reveal no
sig-nificant signal at a period of around 2–2.5 years. A MEM spectrum analysis (not shown) yielded similar results.
4 Conclusion
Observations of zonal and meridional winds in the MLT re-gion over the period of 1988–2000 have been made with a meteor radar near 52◦N in the UK. The data have been analysed to investigate the properties of the monthly-mean and seasonal-mean zonal and meridional winds. Generally good agreement was found with other mid-latitude studies when considering the average seasonal course of the prevail-ing winds. However, the pattern of winds observed is not well reflected in some models (e.g. CIRA-86 and HWM-93). In particular, the observed episode of monthly-mean westwards flow at the spring equinox is not present in these models, and the equator-ward flow measured in summer at 90–95 km occurs at a greater height than in HWM-93. An-nual mean winds calculated for the 13-year data set are only a few ms−1and have a positive trend: +0.37 ms−1yr−1for the
zonal wind and +0.157 ms−1yr−1for the meridional wind. This result is in disagreement with the negative trends found in the 30-year study of Merzlyakov and Portnyagin (1999), but most likely reflects a higher degree of decadal-scale vari-ability superimposed on longer term trends.
When divided into seasons, the positive trends remain. For the zonal winds, the summer and autumn yielded significant (i.e. confidence levels over 80%) trends of +0.48 ms−1yr−1
and +0.38 ms−1 yr−1, respectively, and the meridional winds in spring and autumn show significant trends of +0.38 ms−1yr−1and +0.29 ms−1yr−1, respectively.
Correlations between solar activity (represented by sunspot number) and the seasonal means reveal correlation coefficients with confidence levels of 98% for the zonal winds in summer (R = +0.732) and the meridional winds in winter (R = −0.677). Two other correlations have confi-dence levels above 80%: the zonal winter winds, which dis-play a correlation of R = −0.472, and the zonal autumn winds with a correlation of R = +0.508. Comparisons with other studies have revealed both agreements and disagree-ments. Given that the studies considered were made over a number of recent solar cycles, the disagreements may be a result of decadal-scale variability in the seasonal winds, unconnected to the solar cycle. The discrepancies between the various studies raise the question as to whether the ap-parent correlations with the solar cycle, reported here and elsewhere, reflect a genuine connection or merely a chance agreement between decadal-scale variability and solar activ-ity.
Finally, Lomb periodogram and MEM spectrum analyses did not reveal a clear signature of the QBO in the wind data. All of these observations highlight the need for long-term measurements to unambiguously identify the roles of long-term trends, decadal-scale variability and solar cycle influ-ence.
Acknowledgements. Topical Editor D. Murtagh thanks A. Manson
and another referee for their help in evaluating this paper.
References
Arnold, N. F. and Robinson, T. R.: Solar cycle changes to planetary wave propagation and their influence on the middle atmosphere circulation, Ann. Geophysicae, 16, 69–76, 1998.
Balachandran, N. K. and Rind, D.: Modeling the effects of UV variability and the QBO on the troposphere-stratosphere system. Part 1: the middle atmosphere, J. Clim., 8, 2058–2079, 1995. Bremer, J., Schminder, R., Greisiger, K. M., Hoffmann, P.,
K¨urschner, D., and Singer, W.: Solar cycle dependence and long-term trends in the wind field of the mesosphere/lower thermo-sphere, J. Atmos. Solar-Terr. Phys., 59, 497–509, 1997. Greisiger, K. M., Schminder, R., and K¨urschner, D.: Long-period
variations of wind parameters in the mesopause region and the solar cycle dependence, J. Atmos. Terr. Phys., 49, 281–285, 1987.
Hedin, A. E.: Extension of the MSIS thermospheric model into the middle and lower atmosphere, J. Geophys. Res., 96, 1159, 1991. Jacobi, Ch.: On the solar cycle dependence of winds and planetary waves as seen from mid-latitude D1 LF mesopause region wind measurements, Ann. Geophysicae, 16, 1534–1543, 1998. Jacobi, Ch., Lange, M., K¨urschner, D., Manson A. H., and Meek, C.
E.: A long-term comparison of Saskatoon MF radar and Collm LF D1 mesosphere- lower thermosphere wind measurements, Phys. Chem. Earth, 26, 419–424, 2001.
Kane, R. P., Meek C. E., and Manson, A. H.: Quasi-biennial and higher-period oscillations in the mean winds in the mesosphere and lower thermosphere over Saskatoon, 52◦N, 107◦W, J. Geo-phys. Res., 104, 2645–2652, 1999.
Manson, A. H. and Meek, C. E.: Dynamics of the middle atmo-sphere at Saskatoon (52◦N, 107◦W): a spectral study during 1981, 1982, J. Atmos. Terr. Phys., 48, 1039–1055, 1986. Manson, A. H., Meek, C. E., Fleming, E., Chandra, S., Vincent, R.
A., Phillips, A., Avery, S. K., Fraser, G. J., Smith, M. J., Fellous, J. L., and Massebeuf, M.: Comparisons between satellite-derived gradient winds and radar-derived winds from the CIRA-86, J. Atmos. Sci., 48, 411–428, 1991.
Massebeuf, M., Bernard, R., Fellous, J. L., and Glass, M.: The mean zonal circulation in the meteor zone above Garchy (France) and Kiruna (Sweden), J. Atmos. Terr. Phys., 41, 647–655, 1979. Merzlyakov, E. G. and Portnyagin, Yu. I.: Long-term changes in the
parameters of winds in the mid-latitude lower thermosphere (90– 100 km), Izv. Akad. Nauk, Fiz. Atmos. Okeana, 35, 531–542 [Izvestiya, Atmospheric and Oceanic Physics (English Trans.) 35, 482–493], 1999.
Mitchell, N. J., Pancheva, D., Middleton, H. R., and Hagan, M. E.: Mean winds and tides in the arctic mesosphere and lower thermosphere, J. Geophys. Res., in press, 2001.
Muller, H. G., Havill, R. L., Comley, V. E., and Hill, P. C. J.: A study of meteor radar winds from two locations in the British Isles, J. Atmos. Terr. Phys., 57, 979–993, 1995.
Namboothiri, S. P., Manson, A. H., and Meek, C. E.: Variations of mean winds and tides in the upper middle atmosphere over a solar cycle, Saskatoon, Canada, 52◦N, 107◦W, J. Atmos. Terr. Phys., 55, 1325–1334, 1993.
Namboothiri, S. P., Meek, C. E., and Manson, A. H.: Variations of mean winds and solar tides in the mesosphere and lower thermo-sphere over time scales ranging from 6 months to 11 yr:
Saska-toon, Canada, 52◦N, 107◦W, J. Atmos. Terr. Phys., 56, 1313– 1325, 1994.
Portnyagin, Yu. I., Forbes, J. M., Fraser, G. J., Vincent, R. A., Avery, S. K., Lysenko, I. A., and Makarov, N. A.: Dynamics of the Antartic and Arctic mesosphere and lower thermosphere regions – I. The prevailing wind, J. Atmos. Terr. Phys., 55, 827–841, 1993.
Portnyagin, Yu. I. and Solovjova, T. V.: Global empirical wind model for the upper mesosphere/lower thermosphere. I.
Prevail-ing wind, Ann. Geophysicae, 18, 300–315, 2000.
Press, W. H., Teukolsky, S. A., Vetterling, W. T., and Flannery, B. P.: Numerical Recipes in C: the art of scientific computing, Cam-bridge University Press, 569–577, 1992.
Sprenger, K. and Schminder, R.: Solar cycle dependence of winds in the lower ionosphere, J. Atmos. Terr. Phys., 31, 217–221, 1969.
Thomas, G. E.: Is the polar mesosphere the miner’s canary of global change? Adv. Space Res., 18, 3, 149–158, 1996.