HAL Id: hal-00317450
https://hal.archives-ouvertes.fr/hal-00317450
Submitted on 1 Jan 2002
HAL is a multi-disciplinary open access
archive for the deposit and dissemination of
sci-entific research documents, whether they are
pub-lished or not. The documents may come from
teaching and research institutions in France or
abroad, or from public or private research centers.
L’archive ouverte pluridisciplinaire HAL, est
destinée au dépôt et à la diffusion de documents
scientifiques de niveau recherche, publiés ou non,
émanant des établissements d’enseignement et de
recherche français ou étrangers, des laboratoires
publics ou privés.
Effects of solar eclipse on the electrodynamical processes
of the equatorial ionosphere: a case study during 11
August 1999 dusk time total solar eclipse over India
R. Sridharan, C. V. Devasia, N. Jyoti, Diwakar Tiwari, K. S. Viswanathan, K.
S. V. Subbarao
To cite this version:
R. Sridharan, C. V. Devasia, N. Jyoti, Diwakar Tiwari, K. S. Viswanathan, et al.. Effects of solar
eclipse on the electrodynamical processes of the equatorial ionosphere: a case study during 11 August
1999 dusk time total solar eclipse over India. Annales Geophysicae, European Geosciences Union,
2002, 20 (12), pp.1977-1985. �hal-00317450�
Annales Geophysicae (2002) 20: 1977–1985 c European Geosciences Union 2002
Annales
Geophysicae
Effects of solar eclipse on the electrodynamical processes of the
equatorial ionosphere: a case study during 11 August 1999 dusk
time total solar eclipse over India
R. Sridharan, C. V. Devasia, N. Jyoti, Diwakar Tiwari, K. S. Viswanathan, and K. S. V. Subbarao
Space Physics Laboratory, Vikram Sarabhai Space Centre, Trivandrum 695 022, India Received: 19 November 2001 – Revised: 17 May 2002 – Accepted: 11 July 2002
Abstract. The effects on the electrodynamics of the
equato-rial E- and F-regions of the ionosphere, due to the occurrence of the solar eclipse during sunset hours on 11 August 1999, were investigated in a unique observational campaign in-volving ground based ionosondes, VHF and HF radars from the equatorial location of Trivandrum (8.5◦N; 77◦E; dip lat. 0.5◦N), India. The study revealed the nature of changes brought about by the eclipse in the evening time E- and F-regions in terms of (i) the sudden intensification of a weak blanketing ES-layer and the associated large enhancement
of the VHF backscattered returns, (ii) significant increase in h0F immediately following the eclipse and (iii) distinctly
different spatial and temporal structures in the spread-F ir-regularity drift velocities as observed by the HF radar. The significantly large enhancement of the backscattered returns from the E-region coincident with the onset of the eclipse is attributed to the generation of steep electron density gra-dients associated with the blanketing ES, possibly triggered
by the eclipse phenomena. The increase in F-region base height immediately after the eclipse is explained as due to the reduction in the conductivity of the conjugate E-region in the path of totality connected to the F-region over the equa-tor along the magnetic field lines, and this, with the peculiar local and regional conditions, seems to have reduced the E-region loading of the F-E-region dynamo, resulting in a larger post sunset F-region height (h0F) rise. These aspects of
E-and F-region behaviour on the eclipse day are discussed in relation to those observed on the control day.
Key words. Ionosphere (electric fields and currents;
equato-rial ionosphere; ionospheric irregularities)
1 Introduction
The occurrence of a total solar eclipse over India during sun-set hours on 11 August 1999 provided a unique opportunity to investigate the effects of this phenomenon on the
elec-Correspondence to: R. Sridharan
(r sridharan@vssc.org)
trodynamics of the equatorial ionosphere/atmosphere. The geographical latitude of Trivandrum being 8.5◦N and the path of totality cutting across the subcontinent being from 24◦N to ∼ 18◦N, Trivandrum experienced only a partial eclipse (∼ 69%) with its first contact at 11:48 UT, i.e. at 17:18 h Indian Standard Time (IST) and for a total duration of 57 min up to 18:15 IST. An observational campaign in-volving ground based ionosonde, VHF backscatter radar op-erating at 54.95 MHz and HF radar at 18 MHz was conducted from Thumba, (Trivandrum) to study the eclipse induced ef-fects in the twilight ionosphere.
The equatorial E- and F-regions of the ionosphere, whether referred in connection with the phenomenon of Equatorial Electrojet (EEJ) or the development of the Equa-torial Ionization Anomaly (EIA) or the generation of plasma density irregularities in the E- and F-regions due to a variety of plasma instabilities, are essentially controlled by electro-dynamic processes. Under normal circumstances, the above processes undergo drastic changes at dusk in the whole of the low/equatorial latitude region. The daytime E-region in-stabilities pave the way to F-region plasma instability pro-cesses and the normal E-region dynamo wanes, releasing the F-region dynamo to dominate after sunset thus providing one of the basic conditions for the plasma instabilities to operate. The results presented in this paper are unique in several ways as they deal with the conditions existing in the ionosphere when the incident solar radiation suddenly gets blocked due to a solar eclipse and when the eclipsed sun sets in the hori-zon. More importantly, the path of totality of the eclipse cuts across the latitude zone where, from the E-region, geomag-netic field lines get mapped to the base of the F-region over the magnetic dip equator. The consequences of these form the subject matter of this paper.
2 Data base
The data are from a co-ordinated campaign intended to study the ionospheric effects of the eclipse which was conducted during 10 and 11 August 1999. The ionosonde operated
1978 R. Sridharan et al.: Effects of solar eclipse on the electrodynamical processes
Figure 1.
16:15 16:45 17:15 17:45 18:15 18:45 19:15 19:45 10 AUGUST, 1999 11 AUGUST, 1999 16:15 16:45 17:15 17:45 18:15 18:45 19:15 19:45 FREQUENCY (MHz)V
IR
T
U
A
L HE
IG
HT (
k
m
)
TRIVANDRUM
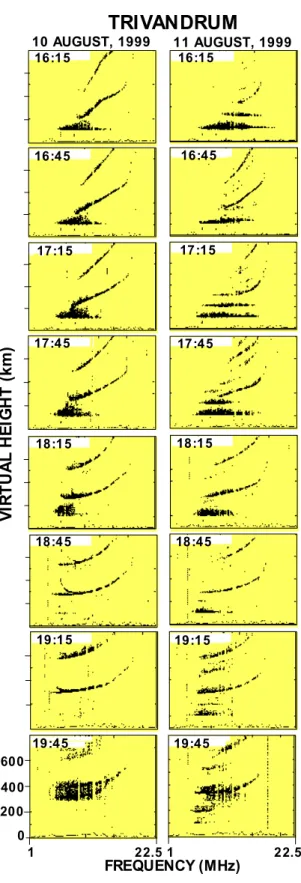
1 22.5 1 22.5 600 400 200 0Fig. 1. The sequence of ionograms from Trivandrum on 10 and 11
August 1999 corresponding to the same time on both the days. The E-region behaviour during 17:15–18:15 IST is distinctly different on both the days.
round the clock while the VHF radar operating at 54.95 MHz (corresponding to 2.7 m scale size irregularities) monitored the electrojet region by means of a westward beam and HF radar at 18 MHz was focused on the F-region irregularities (corresponding to 8.3 m scale size) using the vertical beam. The magnetic activity level on 10 and 11 August had been rather quiet with the Ap values lying between 5 and 6,
re-spectively. In addition to the standard ionospheric parame-ters, like foF2 and h0F from the Ionosonde, the radars pro-vided data on the backscatter signal strength from the elec-tron density irregularities both in the E- and F-regions and also their movements in terms of the mean Doppler fre-quency (fD). 10 August data are treated to represent the control day. The main results relating to the eclipse induced effects on the dusk time electrodynamics of the equatorial E-and F-regions of the ionosphere are: (i) the explosive devel-opment and sustenance of gradient instabilities of 2.7 m scale size at the sharp edges of the intensified blanketing ES(ESb
)-layer with a sudden drop of the ESb-layer by 8 km, exactly
for the same duration of the eclipse and (ii) an abnormal and early height rise of the F-region immediately following the eclipse which resulted in an earlier appearance of spread-F with distinct characteristics.
3 Ionosonde data
Figure 1 depicts the sequence of ionograms from Trivan-drum during 16:15–19:45 IST on 10 and 11 August. The behaviour of the ionosphere during this period on 10 Au-gust is typical with the presence of normal ESq-layer
in-dicating the presence of eastward electric field until sunset and the equatorial spread-F was triggered by 19:30 IST. On the contrary, 11 August showed distinctly different features during this period with the presence of a weak blanketing ES (ESb) from ∼ 16:15 IST onwards which intensified with
the onset of eclipse at ∼ 17:18 IST with 5 multiple reflec-tions and ∼ 17:30 IST with the f ESb (blanketing frequency
of ESb-layer) exceeding 6.5 MHz. The ESb disappeared by
1815 IST but normal q type sporadic-E layer (ESq) continued
well beyond 19:15 IST with the first occurrence of equatorial spread-F around the same time. The sudden intensification of the blanketing ES at 17:18 IST and its disappearance at
∼18:15 IST coincide with the eclipse duration.
4 VHF backscatter radar results
The VHF backscatter radar, operating at 54.95 MHz with an obliquely incident beam (30◦west from the zenith) for mon-itoring the Equatorial Electrojet (EEJ) irregularities of 2.7 m scale size, revealed distinctly different patterns in their move-ments and in the backscattered power on 10 and 11 August 1999. The mean Doppler frequency (fD), one of the mea-sured parameters of the irregularity drift corresponding to the height of maximum backscattered signals (at ∼ 104 km), is a direct measure of the zonal electric field in the EEJ region
R. Sridharan et al.: Effects of solar eclipse on the electrodynamical processes 1979 (Balsley, 1973) and is depicted in Fig. 2 along with the
pa-rameter representing the intensity of the EEJ based on ground magnetic data. The latter had been obtained by the standard convention for the Indian longitudes, i.e. the difference be-tween 1H values (which is the difference in the instanta-neous values of the horizontal magnetic field component and the average night time value) for Trivandrum (1HTRV), an
equatorial station, and for Alibag (1HABG) a station away
from the EEJ belt for the period under consideration. The value 1HTRV−1HABG ensures the removal of
magneto-spheric contribution if any (Rastogi and Patel, 1975). 10 Au-gust 1999, had been a Counter Electrojet (CEJ) day when the EEJ reversed its direction during ∼ 13:30 IST to 16:15 IST with the CEJ intensity maximum of −30 nT at 15:00 IST. The E-region zonal electric field is believed to reverse its direc-tion during this period, off-setting one of the primary crite-ria for the development of gradient drift instability, i.e. the primary electric field should be eastward, generating a verti-cally upward polarization field in the same direction as that of the vertical electron density gradient in the electrojet region (Reid, 1968; Prakash et al., 1972). When the electric field reverses, the ESq irregularities usually disappear leaving the
EEJ region void of any tracers for radar backscattering (Ras-togi, 1971; Krishna Murthy and Sen Gupta, 1972). The disappearance of the backscatter returns coinciding with the CEJ on 10 August conforms to the general pattern (Fig. 2).
With the electrojet reverting back from the CEJ condition by 16:00 IST, the increasing fDcentered ∼ 104 km indicates establishment of the eastward electric field once again. The situation is distinctly different on the eclipse day which, in-cidentally, is a normal electrojet day as indicated by the na-ture of the variation in electrojet intensity. Though the EEJ intensity decreased steadily from ∼ 70 nT around 13:00 IST to zero around 17:00 IST, it picked up again to ∼ 10 nT level during 17:00–18:00 IST and continued to be so up to 20:00 IST. The mean Doppler frequency fD, corresponding to 104 km, showed a near in phase variation with the EEJ intensity.
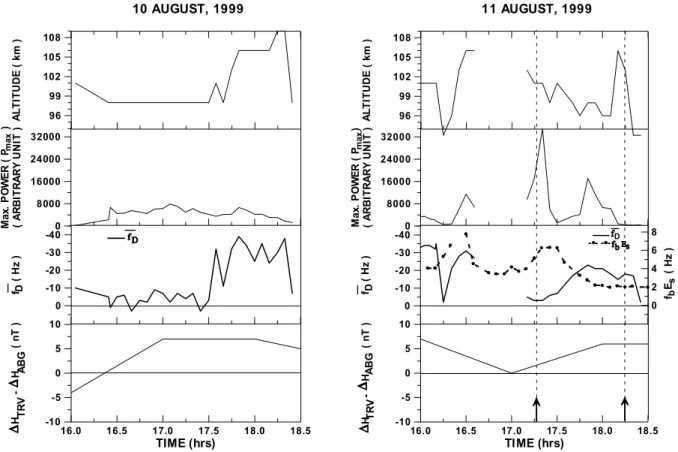
A diagrammatic representation (Fig. 3) of the variation of the maximum backscattered power (Pmax), the
correspond-ing mean Doppler frequency fD and the height location of Pmaxduring the period 16:00–18:15 IST may be used to
in-terpret the growth and decay processes of the gradient insta-bility in the presence of a weak eastward electric field but with different characteristic features on both 10 and 11 Au-gust 1999. On 10 AuAu-gust, the positive electron density gra-dient typically present at this time of the day (∼ 16:30 IST) combined with the eastward electric field is capable of pro-viding the requisite condition for the growth and sustenance of gradient instability and result in the observed radar re-turns. This situation of weak scattered returns continued un-til 18:15 IST with further confirmation from the ionospheric data (Fig. 1) where the persistence of normal ESq-layer is
clearly seen in the ionogram up to 18:15 IST.
It may be noted that the pattern of eastward electric field variations present during 16:00–18:15 IST on the eclipse day of 11 August 1999 is quite different compared to that on 10
13 14 15 16 17 18 19 20 -80 -70 -60 -50 -40 -30 -20 -10 0 10 20 f ( H z) D
OBSERVED E-REGION CHANGES BY VHF RADAR - - - -10 AUG. 1999 11 AUG. 1999 13 14 15 16 17 18 19 20 TIME (hrs) -40 -20 0 20 40 60 H - H ( n T ) TR V AB G - - - -10 AUG. 1999 11 AUG. 1999
Fig. 2. The variation of the mean Doppler frequency (fD) as
ob-served by the VHF backscatter radar corresponding to the height re-gion of 104 km over the magnetic equator at Trivandrum (top panel) and the intensity of the electrojet given as 1HTRV−1HABG
(bot-tom panel) corresponding to the 10 and 11 August 1999. Negative values of fDcorrespond to eastward electric field.
August. However, the normal radar returns from the Esq
ir-regularities on the eclipse day disappeared between 16:00– 18:15 IST because of the change of the normal Esq-layer into
a blanketing ES-layer at ∼ 16:15 IST. The presence of
blan-keting ES in the presence of eastward electric fields (as
rep-resented by the fairly large value of fD) over the dip equator is a rare occurrence and this aspect will be discussed later. During 16:15–16:45 IST, there was a surge of backscattered returns with Pmax located at around 104 km, possibly due
to the presence of a fairly large eastward electric field and the positive gradient associated with the blanketing ES-layer.
The radar returns disappeared at ∼ 16:45 IST coinciding with the weakening of the blanketing ES-layer and its gradients
(Fig. 1), which implies that the combination of a ing eastward electric field to low values (denoted by decreas-ing fD values) and the weakened gradients of the blanket-ing ES-layer could not sustain the gradient instability during
16:45–17:10 IST. With the onset of the eclipse at 17:18 IST, very strong backscattered signals were obtained in two bursts
1980 R. Sridharan et al.: Effects of solar eclipse on the electrodynamical processes 0 8000 16000 24000 32000 Ma x. P O W E R ( P ) ( AR B IT R AR Y U N IT ) 96 99 102 105 108 A LTI TUD E ( k m ) -40 -30 -20 -10 0 f ( Hz ) 16.0 16.5 17.0 17.5 18.0 18.5 TIME (hrs) -10 -5 0 5 10 H - H ( n T ) D 10 AUGUST, 1999 ma x TR V AB G 0 8000 16000 24000 32000 Ma x. P O W E R ( P ) ( AR B IT R AR Y U N IT ) 96 99 102 105 108 A LTI TUD E ( k m ) -40 -30 -20 -10 0 f ( Hz ) 16.0 16.5 17.0 17.5 18.0 18.5 TIME (hrs) -10 -5 0 5 10 H - H ( n T ) D 11 AUGUST, 1999 ma x. 0 2 4 6 8 f E ( H z ) b s D -TR V AB G
Fig. 3. A comparison of the variation in maximum backscattered power (Pmax), Doppler frequency (fD) and the height location of Pmax
observed during 16:00–18:30 IST on the eclipse day and the control day along with the variations in 1HTRV−1HABGduring the same
period. The peak power return coinciding with the onset of the eclipse is > 35 000 (in arbitrary units) on 11 August whereas, during the same time period, the peak power return on 10 August is only about 6500 (in arbitrary units). The duration of the eclipse is indicated by the arrow marks.
during the period 17:18–18:15 IST which was nearly the du-ration of the eclipse. The first burst of large radar returns much larger than that preceding the eclipse during (16:15– 16:45 IST) has also coincided with the intensification of the already existing, though weak blanketing, ES-layer into a
strong blanketing ES-layer with 5 multiple reflections while
the eastward electric field has decreased to a very low value. Thus, it is clear that only very sharp gradients associated with the intensified blanketing ES-layer could sustain the build up
gradient instabilities and cause such large backscatter returns as observed with the onset of the eclipse in the presence of a very weak eastward electric field. Therefore, the immediate manifestation of the onset of the eclipse in the EEJ region was the change of the decaying blanketing ES-layer into an
intense one with very sharp gradients, giving rise to strong backscattered signals even in the presence of a very weak, near zero, electric field. The possible mechanisms that could generate the required gradients are discussed later.
The height location of Pmax(top panel of Fig. 3) is an
indi-cator of the height of the blanketing ES-layer and its
associ-ated region of steep/sharp electron density gradient. Figure 4 depicts the Range Time Intensity (RTI) plot of the backscat-ter returns, highlighting the spectacular effect of the solar eclipse on the equatorial E-region in another form. Initially,
irregularities resulting in significant backscatter (Pmax) were
located at ∼ 104 km, which is the typical behaviour for nor-mal EEJ. With the onset of the solar eclipse, the central re-gion of these irregularities slid down to as low as 96 km with significant enhancement in the backscatter signal strengths. The irregularities were constrained to this narrow height re-gion until the eclipsed sun set and then reverted back to their normal height. Such a behavior is unusual. It is strongly believed that this is an eclipse-induced effect. The possible causes will be discussed later. On the other hand, 10 August showed a steady increase in the height region of irregularities upto ∼ 18:15 IST from 97 km and going up to 106 km but the signal strength had been significantly weaker, by more than an order of magnitude.
5 F-region effects
With regard to the F-region effects the two representative ionospheric parameters chosen are the foF2, i.e. the max-imum frequency of reflection from the ionosphere and the h0F, the base height of the F-region. The former gives an idea of the ionization content in the equatorial ionosphere and the latter represents the large scale movements of the
F-R. Sridharan et al.: Effects of solar eclipse on the electrodynamical processes 1981 91 95 99 103 107 111 115 A LT IT U D E ( km ) 0 2 3 4 16.5 17.0 17.5 18.0 18.5 19.0 19.5 TIME (hrs) 91 95 99 103 107 111 115 A LTI TUD E ( km) 0 2 3 4 11 AUGUST, 1999 10 AUGUST, 1999 VHF BACKSCATERRED POWER (P) Log. (P) Log. (P)
Fig. 4. A comparison of RTI plots of the backscatter returns over
the height region of 91–115 km in the electrojet on 10 August (top panel) and on 11 August (bottom panel) during 16:30–20:00 IST. The duration of the eclipse is indicated by the arrow marks.
region as it typically retains the layer shape; more so at dusk and during night hours. The variations in h0F and foF2 ob-served on 10 (control day) and 11 August are shown for the time duration of 16:00–19:30 IST in Fig. 5. Also depicted are the quiet day averages of h0F values for August 1999. The h0F values of both 10 and 11 August were significantly less than the average pattern and behaved more or less the same way before and after the eclipse. Strikingly, the h0F on 11
August raised higher by ∼ 60 km above the control day val-ues, immediately after the onset of eclipse; these were once again comparable after the eclipsed sun, set. It is to be noted that on 11 August, h0F values even over shot the average val-ues by 10–15 km during the eclipse. The foF2 valval-ues on the eclipse day were uniformly less by 10–20% as compared to the control day. These observations have important ramifica-tion and will be discussed later.
The other late evening phenomenon viz., the occurrence of equatorial spread-F, also showed different characteristics on both the days which again indicates the possible changes the solar eclipse could have brought about to the overall equa-torial electrodynamics. Both the days 10 and 11 August vealed the presence of strong ESF. Though the ionograms re-vealed ESF as early as 19:45 IST on both the days, the 8.3 m irregularities showed their presence in the 18 MHz HF radar only beyond 20:15 IST. Figure 6 depicts the Range Time Ve-locity (RTV) plot showing the existence of 8.3 m
irregulari-16 17 18 19 8 9 10 11 12 13 14
TIME (hrs)
f
F
(
M
H
z)
10 AUG. 1999
TRIVANDRUM
16 17 18 19 200 225 250 275 300h'
F
(
km
)
0 211 AUG. 1999
Fig. 5. A comparison of the variations in foF2 (top panel) and h0F
(bottom panel) observed at Trivandrum on 10 and 11 August during 16:00–19:30 IST. The dotted curve represents the quiet day average values of h0Fduring this period in the month of August 1999.
ties at altitudes exceeding 675 km. On 10 August, the peak altitude of the irregularities came down steadily to ∼ 450 km by 22:30 IST, with a somewhat broad plume structure while, on 11 August, one notices a steep pillar-like structure with large vertical velocities and with an abrupt end at 21:15 IST.
6 Discussion
The total solar eclipse in the Indian longitudes, around 18– 24◦N latitudes, with its gradually decreasing totality towards
the geomagnetic equator during the evening and sunset hours in the month of August, in between the summer solstice and the autumn equinox, provided a unique opportunity to study the effects of the eclipse on the equatorial electrodynamic processes. The intensification of the blanketing ES-layer and
its gradual movement to 96 km from 104 km coinciding with the eclipse duration (Figs. 1, 3 and 4) is spectacular. Usu-ally, over the magnetic dip equator the formation of blan-keting ES is rather rare and invariably coincides with the
1982 R. Sridharan et al.: Effects of solar eclipse on the electrodynamical processes
TIME (hrs)
HF RADAR - TRIVANDRUM
10 AUG. 1999 11 AUG. 1999
VE
LO
CI
T
Y
(
m
/s
)
-500 50Fig. 6. The RTV plots of HF radar returns from the spread-F irregularities of 8.3-meter scale size observed on 10 and 11 August 1999.
VHF radar observations in the past, during such events, have shown an entirely different pattern of back scattered radar return with very large backscattered power coinciding with the explosive growth of gradient instability sustained by the sharp gradients associated with the blanketing ES-layer and
then followed by gradual weakening of radar returns (Reddy and Devasia, 1977). During evening hours, the occurrence is relatively more common as the electric field, though weak, might alternate between eastward and westward responding to external forcings but usually the trend is to push the region of irregularity down unidirectionally. However, in the present case with the setting of the eclipsed sun, the scattering region abruptly increases to its initial value of ∼ 104 km. Very steep gradients in the plasma density will be required for the gen-eration of irregularities to produce the observed effects in the ionograms and also in the backscatter radar returns during
this time. The backscatter returns will be stronger for steeper density gradients. Wind shear mechanism (Axford and Cun-nold, 1966), which is usually ascribed for the accumulation of ionization in the form of sharp layers in the E-region over low- and mid-latitudes, is known to be inoperative over the dip equator where the geomagnetic field lines are horizon-tal. Further, the electric field polarity (eastward) was also in the daytime mode even during the solar eclipse, preventing the formation of sharp layers of ionization due to downward ion transport. The other alternative mechanism is chemi-cal recombination; during eclipse the lower E-region will be depleted quickly providing steeper gradients. But this will cause an apparent upward shift in the region of irregularities as they get themselves locked to the gradients. On the other hand, the observations reveal a sudden drop in the irregularity height during the eclipse and, interestingly, this reverts back
R. Sridharan et al.: Effects of solar eclipse on the electrodynamical processes 1983 as soon as the eclipse is over. The large changes in the
loca-tion of maximum VHF backscattered power are related to the changes in electron density gradients (both positive and nega-tive) associated with blanketing ES-layer with varying
inten-sity (in terms of blanketing frequency of the ES-layer). This
means that there has to be an additional force, which will keep the region gradually pushed down to 96 km enabling the sudden growth and sustenance of gradient instabilities. Over the dip equator this force has to be necessarily elec-trodynamic in nature, as neutral dynamics are not expected to bring out any changes directly with respect to altitude ex-cept, probably, those due to vertical winds if present. It may be noted that such down drafting of irregularities has been seen on several occasions at latitudes a few degrees away from the dip equator (for example, Gadanki, MST Radar Fa-cility in India, 6.6◦ dip latitude). The magnetic dip angle
at Gadanki is finite (13.2◦) and therefore the wind shear
ef-fects are expected to be significant (Sridharan et al., 1989). On the other hand, vertical winds if present, could have a considerable impact over the dip equator (Raghavarao et al., 1987). In their analysis, Raghavarao et al. (1987) ascribed the vertical winds to be of gravity wave origin; they could also be part of a larger scale circulation cell that could have been set up during eclipse due to the sudden changes brought out in the overall circulation pattern. This is a conjecture and could not be confirmed for want of neutral atmospheric data. Simulation of the eclipse-induced effects might give a better physical insight. So far no attempts have been made to simulate the possible effects of a dusk time solar eclipse over the low/equatorial latitudes. It may also be noted, from Fig. 3, that at the time of occurrence of the large bursts of radar returns, coinciding with the onset of eclipse, the east-ward electric field was extremely weak (as indicated by the very low value ∼ 2–3 Hz of the fD) which again points to the need for the sharp electron density gradient (of length ∼ 100– 200 m) for sustaining the gradient drift instability. Moreover, the appearance of radar returns in two prominent bursts dur-ing the eclipse period shows two dominant periodicities with quasiperiods in the range of 30–35 min. This is clear evi-dence of the manifestation of gravity wave modulation of the gradient drift instability within the blanketing ES-layer,
sim-ilar to the one shown by Woodman et al. (1991) in the case of midlatitude ES. Altadill et al. (2001), and Farges et al. (2001)
have investigated the effect of 11 August 1999 eclipse at Ebre (40.8◦N; 0.5◦E), a mid-latitude station, and reported gravity wave-like oscillations in the ionosphere, one to a few hours after the maximum of solar occultation by the moon at far away distances. Altadill et al. (2001) have observed a train of three successive oscillations from about 12:00–14:00 UT, both on foF1 and foF2. It is well known that the supersonic movement of the moon’s shadow triggers such waves and the oscillations in VHF radar power at 17:18 IST onwards, recorded from Thumba (near Trivandrum), corroborate these results. Gravity wave wind-induced electric fields could con-trol the generation of very steep plasma density gradients and its eventual culmination into regions of strong backscatter, even in the presence of very weak zonal electric fields. The
65 69 73 77 81 85 89
Geog. Longitude (°E)
-12 -8 -4 0 4 8 12 16 20 24 28G
eog.
L
at
it
ud
e (
°)
S
N
DUSK TIME TOTAL SOLAR ECLIPSE OVER INDIA 11 AUG. 1999 TRV ALTITUDE (km)
G
eo.
m
ag.
L
at
it
ud
e (
°)
0 200 400 600 800 18 °N 18 °S DAY NIGHT DAY NIGHT 12° 12° 9° 9° Path of totality Sunset terminatorFig. 7. The possible scenario on the eclipse day illustrating how the
magnetically conjugate E-region (encircled cross) in the horizontal plane traversed by the eclipse path (shaded area) over India is linked to the 250–300 km region of the F-layer over the equatorial location of Trivandrum where the other magnetically conjugate E-region is well in the nightside.
very new result is that, unlike the ESb that is normally
gen-erated during westward field, during this particular event a decaying ESbwas intensified when the electric field was
di-rected eastward.
The second important aspect of the probable eclipse in-duced effect is the different behaviour of the F-region during the control day and the eclipse day especially during post sunset times; this provides answers to a fundamental ques-tion about the causative mechanism for the post sunset en-hancement of the equatorial F-region. In the equatorial iono-sphere, the post sunset height rise of the base of the F-layer is a regular phenomenon which, incidentally, provides one of the basic criteria for the triggering of the plasma instability and for the generation of equatorial spread-F. Though there are several other factors that assist the plasma instability, the primary driving force is believed to be the Rayleigh-Taylor instability driven by earth’s gravity (Haerendel, 1974).
The physical process that results in the post sunset F-region height rise is believed to be the F-F-region dynamo. Three main mechanisms, namely, (i) the irrotational nature
1984 R. Sridharan et al.: Effects of solar eclipse on the electrodynamical processes of the electric fields and the steep gradient in the plasma
densities in the zonal direction during sunset hours (Rish-beth, 1981), (ii) the sudden removal of the E-region load-ing of the F-region dynamo (Farley et al., 1986) and (iii) the possible linkage of the EEJ and the F-region during sunset hours (Haerendel and Eccles, 1992) have been proposed to be responsible for the post sunset F-region rise. Though there are indications that one, or all of them could be responsible, more recently, it has been thought that the original mecha-nism by Rishbeth could be the main cause (Eccles, 1998). The present solar eclipse is believed to provide a pointer and to give some clues in resolving this issue.
The possible scenario for the observed response of the equatorial E- and F-region electrodynamics to the solar eclipse of 11 August 1999 over the Indian longitudes is shown in Fig. 7. The equatorial F-region cross section in the vertical east-west plane is linked to the magnetically conju-gate E-layers in the horizontal plane as depicted in the figure. The angle between the sunset terminator and the magnetic meridian is around 12.0◦, corresponding to the eclipse day of 11 August 1999 which is about 43 days behind the autumnal equinox. It may be noted from the figure that the magneti-cally conjugate E-region, in the horizontal plane at E-region heights traversed by the moon’s shadow over India, is linked to the 250–300 km region of the F-layer over the equatorial location of Trivandrum whereas the southern magnetically conjugate E-region is well in the nightside. This unique con-figuration has significant control on the equatorial electrody-namics as can be seen below.
According to one of the mechanisms by Farley et al. (1986) and supported by Abdu (1992) and Tsunoda (1985), during equinox, the sunset terminator would sweep through conjugate E-regions simultaneously and systemati-cally to reduce the E-region conductivity in both the hemi-spheres, thus effectively removing the load on the F-region dynamo and consequently causing the uplifting of the F-layer. In one of the most recent theoretical studies by Bhat-tacharyya and Burkey (2000), they have taken the transmis-sion line analogy and invoked field aligned currents between the F-region and the E-region. They had shown how the E-region loading of the F-region dynamo could be visual-ized and eventually have a control on the base height of the F-region and the consequent generation of plumes. During other seasons, more so during solstice, the summer hemi-sphere will continue to receive sunlight and the E-region loading will be removed somewhat asymmetrically thus re-ducing its overall impact on the post sunset F-region rise. During the month of August in the northern hemisphere, un-der normal circumstances, the E-region loading will persist for a longer duration as compared to the September equinox (autumnal equinox). The total solar eclipse, sweeping past 24◦N–18◦N during local sunset will, thus, effectively create a situation where the conductivity of the summer hemisphere E-region that gets linked to the equatorial F-region along the geomagnetic field lines might even be taken below the win-ter hemisphere values. Therefore, one might expect a signifi-cant increase in the post sunset height rise during the eclipse
day as compared to the non-eclipse day. However, it should be borne in mind that the eclipse is a transient phenomenon and the F-region dynamo per se depends on several other factors like the overall thermal state of the thermosphere in which no major changes may occur within the short dura-tion of the eclipse. The results, presented in Fig. 5, show the effect of the solar eclipse on the pre-reversal uplifting of the F-layer which is significantly more on 11 August than the day to day variation, increasing from as low as 200 km to as high as 260 km within 30 min, coincident with onset and progression of the eclipse. The typical increase in base height is never more than 20 km during the time interval of 17:00–17:30 IST. This effect is presumably due to the solar eclipse induced changes in the conjugate E-region conduc-tivity, suggesting that, in addition to the irrotational nature of the electric fields (Rishbeth, 1981), the mechanism proposed by Farley et al. (1986) is equally important for the post sun-set F-region height rise. It is to be noted that the height rise over the magnetic equator is purely an electrodynamic effect unlike the case of midlatitude stations reported by Altadill et al. (2001), where neutral winds would also have a direct control.
Further, though there had been spread-F on both the days, the characteristic features have a bearing on the electrody-namical forcing preceding the event. The foF2 values on 10 August indicated larger values as it was a CEJ day and the Equatorial Ionisation anomaly would be relatively weak with relatively larger ionization over the dip equator. On the other hand, 11 August had been a normal Electrojet day with a sig-nificant amount of ionisation having been pumped out of the equatorial region resulting in a stronger equatorial anomaly during the day. The most important observation is the persis-tent eastward field extending up to 20:00 IST on both days. This would imply the operation of the upward plasma foun-tain even at these hours. Under such circumstances the top-side vertical gradients would be shallower and, hence, would enable generation of pillar-like plume structure (Fig. 6) for a given initial perturbation; such a possibility has been con-vincingly demonstrated by Sekar et al. (1994) using nonlin-ear numerical simulations. On the other hand, the plume structure on 10 August, as depicted in the Range Time Ve-locity plots (Fig. 6), is comparatively broader implying the distinctly different altitude distribution of electron density in the topside ionosphere which, once again, is controlled by the equatorial electrodynamical processes.
7 Conclusion
The total solar eclipse of 11 August 1999 in the Indian lon-gitudes and the partial solar eclipse in the observing location over the dip equator (Trivandrum) reveal the significant effect of this phenomenon on the electrodynamics of the equatorial region. The striking observations were (i) the sudden inten-sification of an already existing weak and decaying blanket-ing ES-layer with the onset of eclipse, presumably due to
con-R. Sridharan et al.: Effects of solar eclipse on the electrodynamical processes 1985 ditions for the development of gradient instabilities of 2.7 m
scale size at the sharp electron density gradients of the in-tense blanketing ES-layer, (ii) the region of 2.7 m
irregular-ities in the E-region is seen to be pushed down by ∼ 8 km during the eclipse with significant increase in the backscatter intensities due to the continued presence of sharp gradients provided by the gradual descent of the blanketing ES-layer,
thereby sustaining the gradient drift instabilities. The spe-cific questions would be whether the combination of ∼ 69% eclipse and the associated changes in the electron density distribution in combination with the local time of the event (dusk), could have brought the changes needing to be ad-dressed through simulation studies. Furthermore, the pecu-liar local and regional conditions during the event reduce the E-region loading of the F-region dynamo with a resultant in-crease in the post sunset F-region rise to larger heights as compared to the control day. The post sunset spread-F on both days showed distinctly different characteristics, associ-ated with the changes brought about in the overall equatorial electrodynamics.
Acknowledgements. We wish to gratefully acknowledge the active
participation of our colleagues in Atmospheric Technology Divi-sion, Space Physics Laboratory in the solar eclipse campaign by op-erating the HF and VHF backscatter radars. This work is supported by the Department of Space, Government of India. The authors also wish to acknowledge the cooperation of the Indian Institute of Ge-omagnetism, Mumbai, by supplying the magnetograms used in this study. The useful suggestions from the referees are also duly ac-knowledged.
Topical Editor M. Lester thanks two referees for their help in evaluating this paper.
References
Abdu, M. A., Batista, I. S., and Sobral, J. H. A.: A new aspect of magnetic declination control of equatorial spread-F and F-region dynamo, J. Geophys., Res., 97, 14 897–14 904, 1992.
Altadill, D., Sole, J. G., and Apostolov, E. M.: Vertical structure of a gravity wave like oscillation in the ionosphere generated by the solar eclipse of 11 August 1999, J. Geophys. Res., 106, 21 419– 24 428, 2001.
Axford, W. I. and Cunnold, D. M.: The wind shear theory of tem-perate zone sporadic-E, Radio Sci., 1, 191–197, 1966.
Balsley, B. B.: Electric fields in the equatorial ionosphere: A re-view of techniques and measurements, J. Atmos. Terr. Phys., 35, 1035–1044, 1973.
Bhattacharyya, A. and Burke, W. J.: A transmission line analogy for the development of equatorial ionospheric bubbles, J. Geophys. Res., 105, 24 941–24 950, 2000.
Eccles, J. V.: A modeling investigation of the evening pre-reversal enhanced of the zonal electric field in the equatorial ionosphere, J. Geophys. Res., 103, 26 709–26 719, 1998.
Farges, T., Jodogne, J. C., Bamford, R., Le Roux, Y., Gauthier, F.,
Vila, P. M., Altadill, D., Sole, J. G., and Miro, G.: Disturbance of the western European ionosphere during the total solar eclipse of 11 August 1999 measured by a wide ionosonde and radar net-work, J. Atmos. Terr. Phys., 63, 915–924, 2001.
Farley, D. T., Bonelli, E., Fejer, B. G., and Larsen, M. F.: The pre-reversal enhancement of the zonal electric field in the equatorial ionosphere, J. Geophys. Res., 91, 13 723–13 728, 1986. Haerendel, G.: Theory of Equatorial Spread-F, pre-print,
Max-Planck-Instit f¨ur extraterr., Phys., Garching, M¨unchen, Germany, 1974.
Haerendel, G. and Eccles, J. V.: The role of the Equatorial electro-jet in the evening ionosphere, J. Geophys. Res., 97, 1181–1192, 1992.
Krishna Murthy, B. V. and Sen Gupta, K.: Disappearance of equa-torial Es associated with magnetic field depression, Planet Space Sci., 20, 371–378, 1972.
Prakash S., Subbaraya, B. H., and Gupta, S. P.: Rocket measure-ments of ionization irregularities in the equatorial ionosphere at Thumba and identification of plasma instabilities, Ind. J. Radio & Space Phys., 1, 72–80, 1972.
Prakash, S., Gupta, S. P., Subbaraya, B. H., and Pandey, R.: Elec-tric fields in the E-region during the counter electrojet, in: Ad-vances in Space exploration, Low latitude Aeronomical pro-cesses, COSPAR symposium series, (Ed) Mitra, A. P., Pergamon Press, 8, 279–282, 1980.
Raghavarao, R., Gupta, S. P., Sekar, R., Narayanan, R., Desai, J. N., Sridharan, R., Babu, V. V. and Sudhakar, V.: In situ measure-ments of winds electric fields and electron densities after onset of equatorial spread-F, J. Atmos. Terr. Phys., 49, 485–492, 1987. Rastogi, R. G., Chandra, H., and Chakravarty, S. C.: The disappear-ance of equatorial Es and the reversal of electrojet current, Proc. Indian Acad. Sci. Sect. A, 74, 62–67, 1971.
Rastogi, R. G. and Patel, V. L.: Effects of interplanetary magnetic field on ionosphere over the magnetic equator, Proc. Ind. Acad. Sci. Sect. A, 82, 121–141, 1975.
Reddy, C. A. and Devasia, C. V.: VHF Radar observations of gradi-ent instabilities associated with blanketing Es-layers in the
Equa-torial Electrojet, J. Geophys. Res., 82, 125–128, 1977.
Reid, G. C.: The formation of small-scale irregularities in the iono-sphere, J. Geophys. Res., 73, 1627–1640, 1968.
Rishbeth, H.: The F-region dynamo, J. Atmos. Terr. Phys., 43, 387– 392, 1981.
Sekar, R., Suhasini, R., and Raghavarao, R.: Effects of vertical winds and electric fields in the nonlinear evolution of equatorial spread-F, J. Geophys. Res., 99, 2205–2213, 1994.
Sridharan, R., Raghavarao, R., Suhasini, R., Narayanan, R., Sekar, R., Babu, V. V., and Sudhakar, V.: Winds, winds shears and plasma densities during the initial phase of a magnetic storm from equatorial latitudes, J. Atmos. Terr. Phys., 51, 169–177, 1989.
Tsunoda, R. T.: Control of the seasonal and longitudinal occurrence of equatorial scintillations by longitudinal gradient in integrated E-region Pedersen conductivity, J. Geophys., Res., 90, 447–456, 1985.
Woodman, R. F., Yamamoto, M., and Fukao, S.: Gravity wave mod-ulation of gradient drif instabilites in mid latitude sporadic-E ir-regularities, Geophys. Res. Lett., 28, 1197–1200, 1991.