The Effect of Financial Reporting on Strategic Investments:
Evidence from Purchase Obligations
By Suzie Noh
B.A. Economics & Mathematics Emory University, 2013
Master of Finance
MIT Sloan School of Management, 2014 Master of Science in Management Research
MIT Sloan School of Management, 2018
SUBMITTED TO THE SLOAN SCHOOL OF MANAGEMENT IN PARTIAL FULFILLMENT OF THE REQUIREMENTS FOR THE DEGREE OF
DOCTOR OF PHILOSOPHY IN MANAGEMENT at the
MASSACHUSETTS INSTITUTE OF TECHNOLOGY MAY 2020
©2020 Massachusetts Institute of Technology. All rights reserved.
Signature of Author:__________________________________________________________ Department of Management
April 25, 2020 Certified by: ________________________________________________________________
Eric So Sarofim Family Career Development Professor Thesis Supervisor Certified by: ________________________________________________________________
Rodrigo Verdi Nanyang Technological University Professor Thesis Supervisor Accepted by: _______________________________________________________________
Catherine Tucker Sloan Distinguished Professor of Management Professor, Marketing Faculty Chair, MIT Sloan PhD Program
The Effect of Financial Reporting on Strategic Investments:
Evidence from Purchase Obligations
∗by Suzie Noh
Submitted to the Sloan School of Management on April 25, 2020 in Partial Fulfillment of the Requirements for the Degree of Doctor of Philosophy in Management
Abstract
I examine whether mandating the disclosure of investments influences firms’ strategic interactions. I exploit an SEC regulation requiring firms to report off-balance sheet purchase obligations, such as commitments to inventory purchases, CAPEX, R&D, and advertising. Motivated by theory on strategic investments, I predict and find that firms respond to the regulation by increasing investments if they have substitutive product market strategies with competitors, and decreasing investments if they have complementary strategies. This two-way finding is consistent with firms using investments to influence competitors’ behavior in ways that increase their own profits. I show that changes in investments are concentrated among firms with large market share, which have a greater ability to influence competitors’ actions, and that they have real effects on firms’ sales and profit margins. Collectively, my results illustrate a novel channel through which financial reporting shapes firms’ investments and competition.
Thesis Supervisor: Eric So
Title: Sarofim Family Career Development Professor Thesis Supervisor: Rodrigo Verdi
Title: Nanyang Technological University Professor
∗ I am sincerely grateful to Eric So (co-chair), Rodrigo Verdi (co-chair), and Joe Weber (committee member) for their
helpful feedback and insights in developing this idea. I thank Inna Abramova, Matt Bloomfield, Matthias Breuer, Ki-Soon Choi, Jinhwan Kim, Kwang J. Lee, Rebecca Lester, Gabriel Pundrich, Steve Stubben, Dan Taylor, and Rachel Yoon for providing helpful comments and suggestions. I also thank seminar participants at MIT, New York University, Stanford University, London Business School, University of Chicago, University of Pennsylvania, Columbia University, Yale University, University of Michigan, University of Colorado Boulder, and Harvard Business School. I gratefully acknowledge generous financial support from the Deloitte Foundation. All errors are my own. The internet appendix can be found at: http://bit.ly/Noh2020Appendix. Email: snoh3@mit.edu.
1 1. Introduction
I examine how mandating the disclosure of investments shapes firms’ strategic interactions. Specifically, I study the effects of a regulation requiring disclosures of off-balance sheet investments on firms’ strategic investments. My study is motivated by the idea that investments are more likely to affect competitors’ behavior when they are observable, and thus that mandated reporting increases the extent to which firms strategically change their investments to affect competitors’ behavior. My findings provide support for this idea and, in doing so, suggest that increased disclosures about investments have real effects on competitive dynamics.
Following the literature on strategic investments, I define investments to be activities that are (partially) irreversible and time-bound. The first implies that they cannot be cancelled without incurring some losses or costs, and the latter implies that they need to be executed in a timely manner before production or sales. Activities with such characteristics signal credible commitments to future strategies (e.g., von Stackelberg 1934). Therefore, consistent with prior literature, I consider a wide range of activities including inventory purchases, CAPEX, R&D, advertising, marketing, etc. (Ellison and Ellison 2011; Bloomfield and Tuijin 2019).
My study exploits a regulation (hereafter “the regulation”) implemented by the U.S. Securities and Exchange Commission (SEC) in 2003 that requires firms to disclose in their 10-Ks off-balance sheet purchase obligations. These are minimum or non-cancellable future expenditures, such as payment obligations for inventory purchases, CAPEX, R&D, and advertising. This regulation is well suited for my study, because purchase obligations are irreversible and timely, which makes them effective at signaling commitments to future product market strategies.
Intuitively, the specific investment strategy that firms choose likely depends on how they interact with other firms. Accordingly, my predictions for how firms respond to the 2003 regulation depend on their mode of competition. To guide my predictions, I rely on classical theory
2
on strategic investments developed in the industrial organization literature, which classifies competition into two types: competition with strategic substitutes and competition with strategic complements (Fudenberg and Tirole 1984; Bulow et al. 1985).1
Firms are considered to be in competition with strategic substitutes when more aggressive strategies, such as increasing quantity, induce competitors to adopt less aggressive strategies by reducing competitors’ marginal profits. For example, suppose Coca-Cola signals that it intends to flood the market with soft drinks by making large investments in distribution centers. Coca-Cola would be classified as having strategic substitutes if these investments induced smaller competitors, such as Shasta, to reduce the quantity of production in anticipation of a reduction in the prices consumers are willing to pay for their products. Thus, in competition with strategic substitutes, firms’ choices have negative correlations.
Firms are considered to be in competition with strategic complements when more aggressive strategies, such as lowering price or increasing quality, induce competitors to similarly adopt more aggressive strategies by increasing competitors’ marginal profits. For example, suppose Boeing signals that it intends to increase the energy efficiency of its aircraft. Boeing would be classified as having strategic complements if these investments induced smaller competitors, such as General Dynamics, to also improve the quality of their aircraft to avoid losing market share. Hence, in competition with strategic complements, firms’ choices have positive correlations.2
I develop a two-way prediction that, after the SEC regulation, firms in competition with strategic substitutes increase investments, and those in competition with strategic complements reduce investments. In the examples above, Coca-Cola increases investments in distribution
1 See Appendix C for detailed discussions on competition with strategic substitutes and strategic complements. 2 Competition with strategic substitutes is commonly referred to as Cournot competition, and competition with
strategic complements is commonly referred to as Bertrand competition. This categorization holds true under general conditions, such as when demand is linear and marginal cost is constant (e.g., Bulow et al. 1985).
3
centers, and Boeing reduces investments in energy efficiency. The intuition is that firms desire to induce less aggressive strategies from competitors, as this helps increase their own profits, and greater observability of investments increases firms’ ability to use investments as a signal to induce desired responses from competitors. To induce less aggressive strategies from competitors, firms with strategic substitutes signal commitments to more aggressive strategies, whereas firms with strategic complements signal commitments to less aggressive strategies.
The predictions from classical models of strategic investments center on firms with a first-mover advantage (Fudenberg and Tirole 1984; Bulow et al. 1985). Accordingly, my predictions center on dominant firms (i.e., those with large market share), which have the capacity to exert a significant influence on the quantity and price of products in the industry, and hence on the subsequent actions of other firms (e.g., Gisser 1984, 1986; Lieberman and Montgomery 1988).
To test my predictions, I employ difference-in-differences tests around the regulation on dominant firms. I examine whether dominant firms with a greater increase in investment observability (i.e., a greater degree of “treatment”) change investments by a greater amount. To estimate the degree of “treatment”, I count redacted investment contracts as manifested in 10-K/Q and 8-K exhibits before the regulation.3 Because the regulation increases disclosure of contractual
investments, firms that redact more investment contracts in the pre-period likely experience a greater increase in observability of their investments.4 To partition firms into different competition
types, I use a measure developed by Kedia (2006).
3 To count redacted contracts related to investments, I conduct a textual analysis similar to those of Verrecchia and
Weber (2006), Boone et al. (2016), Glaeser (2018), and Bourveau et al. (2019). See Section 4.1 for details.
4 I use the unscaled number of redacted contracts, not the ratio of redacted contracts over all investment contracts.
This is because the extent of firms’ use of contractual investments has large across-firm variation. Using the ratio imposes an assumption that firms equally rely on contractual investments. I also validate using the unscaled number in Table 7, where I show firms with more unscaled investment contracts are more likely to have a greater amount of purchase obligations.
4
My tests examine changes in firms’ investments recognized in financial statements from the pre- to post-regulation period, because firms’ off-balance sheet purchase obligations are not observable prior to the regulation. Thus, an assumption of my empirical design is that off-balance sheet purchase obligations—such as inventory purchases, CAPEX, R&D, and advertising expenses—are soon reflected in financial statements under corresponding items. This assumption seems reasonable given that purchase obligations reflect non-cancellable amounts of payments.
Consistent with my predictions, I find that dominant firms with strategic substitutes are more likely to increase their investments if the 2003 regulation makes their investments more observable. In terms of economic magnitudes, a one-standard-deviation increase in the exposure to the regulation leads to an approximately 5% increase in investments for an average firm. In contrast, dominant firms with strategic complements display a change in investments of similar economic magnitude, but of opposite sign. Specifically, they are more likely to decrease their investments if the 2003 regulation makes their investments more observable.
I also document that dominant firms with strategic substitutes primarily increase investments in capacity (e.g., inventory purchases and CAPEX), whereas those with strategic complements primarily reduce investments in product differentiation (e.g., R&D and advertising). These findings are consistent with firms using differing levers depending on their mode of competition (e.g., Kreps and Scheinkman 1983; Singh and Vives 1984). Specifically, my finding that firms with strategic substitutes increase investments in capacity is consistent with these firms being more likely to compete in quantity, and aligns with the example above of Coca-Cola. My finding that firms with strategic complements reduce investments in product differentiation is consistent with these firms being more likely to compete in quality, and aligns with the example above of Boeing. To sharpen my main inferences, I show that the divergence in investments in each type of competition only emerges after the 2003 regulation, consistent with firms displaying parallel trends
5
prior to the regulation. I also run falsification tests showing that firms do not appear to change expenditures on acquisitions or operating leases, which are informative about future strategies but whose disclosures are not affected by the regulation.
To understand the consequences of the strategic actions taken by dominant firms, I also study the behavior of non-dominant firms. I find that they decrease investments after the 2003 regulation across both types of competition. Continuing with the above examples, the decrease in investments by non-dominant firms with strategic substitutes is consistent with Shasta rationally reducing its investments in production when Coca-Cola’s increased investments signal an intention to flood the market. In contrast, the decrease in investments by non-dominant firms with strategic complements is consistent with General Dynamics optimally engaging in less aggressive investments in technology when Boeing’s reduced investments signal reduced commitments to improving energy efficiency.
I corroborate my findings by analyzing the costs of goods sold (COGS)—which increase with the quantities sold—in each type of competition. I confirm that firms’ investments foretell their aggressiveness, proxied by COGS (i.e., investments are not “cheap talk”). Furthermore, to help substantiate the effect of dominant firms’ strategic investments on competition, I show that, after the 2003 regulation, dominant firms with strategic substitutes increase sales by capturing larger market share, and dominant firms with strategic complements increase profit margins through less intense competition. These findings suggest that dominant firms’ strategic investments have real effects on product market outcomes.
In the final section of this paper, I perform a series of tests to validate my methodology and confirm the robustness of my main findings. First, I show firms with more investment contracts— redacted or non-redacted—before the regulation are more likely to report greater amounts of purchase obligations after the regulation. This positive relation supports the assumption for my ex
6
ante “treatment” measure that firms with more redacted investment contracts experience a greater increase in their disclosure of contractual investments. Second, I verify that amounts of off-balance sheet purchase obligations positively predict amounts of investments subsequently reported. This suggests that purchase obligations are soon reflected in investments, and thus validates my tests examining changes in investments from the pre- to post-regulation period. Lastly, I confirm that my results are robust to using alternative proxies for competition type used by Bloomfield (2019), using a dichotomous “treatment” variable, and using a shorter period excluding the dot-com bubble.
Readers may ask why dominant firms did not engage in strategic investments prior to the regulation by voluntarily disclosing their future strategies. Disclosing future strategies may be considered as anti-competitive practices and it increases the risk of antitrust investigations (Antitrust Guidelines for Collaborations Among Competitors April 2000; Steuer et al. 2011; Bourveau et al. 2019). The SEC regulation likely provided firms with legitimate channels to increase their disclosure about future strategies. Therefore, my findings add to growing evidence on potential conflicts between antitrust and securities regulations (e.g., Bourveau et al. 2019).
Also, while I interpret my results in light of the theory on strategic investments, readers may be concerned that they are driven by alternative channels through which financial reporting affects investments, such as an increase in proprietary costs (e.g., Verrecchia 1983; Ali et al. 2014). The theory I rely on yields a two-way prediction for dominant firms’ investments that specifically hinges on their competition type. Although alternative explanations can account for some aspects of my findings, I am not aware of any theory that would explain opposite changes in investments for firms with substitutive versus complementary strategies, and the concentration of such changes among dominant firms. Therefore, a plausible alternative story would need to be quite complex. Nonetheless, my findings are subject to an important caveat that they may reflect changes in investments net of the effects of the regulation through these alternative channels.
7
The central contribution of my study is to show that financial reporting allows firms to make strategic gains through investments. A growing literature in accounting investigates the relationship between firms’ strategic disclosures and the dynamics of competition.5 This paper
expands this literature and examines how mandatory disclosures affect firms’ strategic real decisions. One of the few papers that study this relationship is by Bloomfield (2019), who finds that large firms with complementary strategies adopt revenue-based CEO pay packages to commit to aggressive behavior after a mandatory increase in executive pay disclosures. I provide related evidence on a different commitment mechanism under which financial reporting affects competition: strategic investments.
This study also contributes to the investment literature by examining a type of investment disclosure overlooked in the literature: off-balance sheet purchase obligations. Purchase obligations reflect wide-ranging future strategies, as they include future expenditures not only for CAPEX and R&D but also for inventory purchases and advertising. This paper highlights the economic significance of purchase obligations and their strategic uses.
Finally, my findings have important implications for regulators. The primary objective of the regulation was to provide investors with information about firms’ obligations from off-balance sheet arrangements. Although they do not speak to the net effect of the regulation, my finding that firms use the strategic effect of disclosures about their investments to their advantage sheds light on a potential unintended effect of the regulation and an unexplored role of financial reporting.
The remainder of the paper proceeds as follows: Section 2 discusses the regulatory background of purchase obligation disclosures. Section 3 develops hypotheses, and Section 4 describes my sample and data. Section 5 reports my empirical results, and Section 6 concludes.
5 e.g., Bernard (2016); Aobdia and Cheng (2018); Bloomfield and Tuijin (2019); Bourveau et al. (2019); Glaeser and
8 2. Setting: Disclosure of Purchase Obligations
In response to the Sarbanes-Oxley Act of 2002, the SEC adopted in April 2003 amendments to the Securities Exchange Act of 1934 to require audited disclosure of off-balance sheet arrangements. The regulation was implemented to primarily provide investors with contextual information to assess firms’ short- and long-term liquidity and capital resource needs and demands, after the failures of giant firms such as Enron and Winstar following their accounting scandals.6
This regulation has the following two components, which are enforced sequentially over a six-month period.
The first is that it requires SEC-registered firms, except for small business owners, to provide an explanation of their contractual off-balance sheet arrangements in the Management's Discussion and Analysis (MD&A) section of their 10-Ks for their fiscal years ending on or after June 15, 2003.7, 8 Firms need to disclose the material facts and circumstances that provide investors with a
clear understanding of firms’ off-balance sheet arrangements and their material effects on changes in financial condition, revenues and expenses, results of operations, liquidity, capital expenditures, and capital resources.
A second key feature of the regulation is requiring a detailed tabular disclosure of contractual obligations in the MD&A section of 10-Ks for the fiscal years ending on or after December 15, 2003. Firms need to provide, in a single location in the MD&A section, tabular information about future payments by specified category of contractual obligations (i.e., long-term debt obligations,
6 The complete text of this regulation “SEC Final Rule: Disclosure in Management’s Discussion and Analysis about
Off-Balance Sheet Arrangements and Aggregate Contractual Obligations” (Release No. 33-8182) is available at https://www.sec.gov/rules/final/33-8182.htm
7 “Small business issuer” is defined as any entity that (1) has revenues of less than $25,000,000; (2) is a U.S. or
Canadian issuer; (3) is not an investment company; and (4) if a majority-owned subsidiary, has a parent corporation that also is a small business issuer. An entity is not a small business issuer, however, if it has a public float (the aggregate market value of the outstanding equity securities held by non-affiliates) of $25,000,000 or more.
8 The regulation also requires these explanations in 10-Qs if there exist material changes outside their ordinary course
of business. Therefore, most firms are expected to not report updates on their off-balance sheet arrangements or simply
9
capital lease arrangements, operating lease arrangements, purchase obligations, and other long-term liabilities reflected on the balance sheet) and by due date (e.g., less than one year, one to three years, three to five years, and more than five years). The SEC provides a format that a firm’s table should substantially conform to, which is shown in Appendix B. Appendix B also contains actual tabular disclosures made by a few sample firms after the regulation.9
Before this regulation, firms were already required to aggregate and disclose their contractual payment obligations for debt and for capital or operating leases (see FASB SFAS No. 13, Accounting for Leases (Nov. 1976); SFAS No. 47, Disclosure of Long-Term Obligations (March 1981)). This regulation additionally requires disclosures of purchase obligations as of the latest fiscal year-end date. Purchase obligations are defined as agreements to purchase goods or services that are enforceable and legally binding on the firm. These unconditionally binding definitive agreements, subject only to customary closing conditions, specify all significant terms, including: fixed or minimum quantities to be purchased; fixed, minimum or variable price provisions; and the approximate timing of the transaction.10 They include a broad range of arrangements, including
inventory purchases, CAPEX, R&D, royalty/licensing, advertising/marketing, and strategic alliances.
This forward-looking information related to firms’ inputs for production and sales is not available in firms' financial statements, because executory contracts—where both parties to the contract have not yet performed their duties—are not recorded on firms’ balance sheets. Moreover,
9 The regulation allows a firm “to disaggregate the specified categories by using other categories suitable to its
business, but the table must include all of the obligations that fall within specified categories. In addition, the table should be accompanied by footnotes necessary to describe material contractual provisions or other material information to the extent necessary for an understanding of the timing and amount of the contractual obligations in the table.”
10 If the purchase obligations are subject to variable price provisions, then the firm must provide estimates of the
payments due and include footnotes about payments that are subject to market risk. In addition, the footnotes should discuss any material termination or renewal provisions to the extent necessary for an understanding of the timing and amount of the firm’s payments under its purchase obligations.
10
prior to the regulation, if firms requested confidential treatment of their material contracts and redacted their contracts, this forward-looking information was not available to outsiders.
Although they are off-balance sheet expenses, the amounts of purchase obligations reported are economically significant. Using disclosures of purchase obligations made in fiscal year 2007 and applying an annual discount rate of 5%, Lee (2010) reports that the average value is 9.3% of total assets for non-financial firms including those not reporting purchase obligations. Furthermore, he shows that disclosures of purchase obligations after the regulation provide useful information to investors, because growth in purchase obligations is associated with higher future sales and earnings. In my online appendix, I document a greater reduction in analysts’ dispersion for firms with a greater exposure to the regulation (i.e., firms that redacted more contracts before the regulation), which suggests that the regulation increased the information set of outsiders about firms’ future operations.
Firms typically need to enter into purchase obligations well in advance, in time for future production and/or sales, and these purchase obligations reflect minimum or legally binding (e.g., non-cancellable) amounts that are audited. Therefore, disclosures of purchase obligations are likely to credibly and effectively signal a commitment to future product market strategies. I use this regulation to study strategic changes in firms’ investments, because it increases the information about firms’ future strategies that is observable to competitors.
11
3. Hypotheses
Due to their irreversible and time-bound nature, investments signal credible commitments to future strategies that subsequently alter competitors’ decisions (von Stackelberg 1934; Schelling 1960; Spence 1977; Dixit 1980). For example, increased purchases of inventory or R&D signal more aggressive future strategies (e.g., greater quantity, lower price, or higher quality), and the opposite signal less aggressive strategies. These signals affect competitors’ decisions on future strategies, because competitors deem those as credible commitments. Therefore, in a dynamic setting, investments not only have an internal profit-increasing value, but also have an important strategic value.
My first set of hypotheses examines whether reporting of purchase obligations increases the extent to which firms strategically change their investments to affect competitors’ behavior. When more information about firms’ investments becomes observable to their competitors, firms will adjust their investments to exploit their increased strategic value. Therefore, reporting of purchase obligations should increase the extent to which firms’ investment decisions are influenced by strategic motives. I develop specific predictions on firms’ investment choices based on classical theory of strategic investments (Fudenberg and Tirole 1984; Bulow et al. 1985).11
Theory on strategic investments classifies firms’ competition into two types—competition with strategic substitutes and competition with strategic complements. This classification applies to firms that produce imperfectly or perfectly substitutive products and hence horizontally compete for profits. If a firm’s more aggressive strategy (e.g., greater quantity, lower price, higher quality)
11 I rely on theory on strategic investments for entry accommodation (equivalent to incumbent competition). There
exists related, but distinct, theory on strategic investments for entry deterrence (e.g., Spence 1977, 1979; Dixit 1979; Smiley 1988; Ellison and Ellison 2011; Cookson 2017, 2018). Based on this theory, recent papers by Bloomfield and Tuijin (2019) and Glaeser and Landsman (2019) empirically show that firms facing a threat of entry increase voluntary disclosure of greater investments to deter the entry of competitors. To help the reader understand the underlying theory for entry deterrence versus entry accommodation as well as the notions of overinvestment versus underinvestment, I discuss theory on strategic investments introduced by Tirole (1988) in my online appendix.
12
decreases competitors’ marginal profits, then it has competition with strategic substitutes (e.g., Cournot competition). If it increases competitors’ marginal profits, then it has competition with strategic complements (e.g., Bertrand competition).12
According to theory, firms desire to commit to actions that induce their competitors to take less aggressive product market strategies, because this increases their expected future profits (e.g., Bulow et al. 1985; Sundaram et al. 1996). However, the action they need to take to induce such strategies is contingent on how they expect their moves will affect their competitors’ marginal profits or, equivalently, on whether they have strategic substitutes or complements with their competitors. If they face competition with strategic substitutes, then firms will increase their investments to signal that they will use aggressive product market strategies in the future (e.g., greater quantity, lower price, higher quality). This is because doing so reduces competitors’ marginal profits and induces them to adopt less aggressive strategies in response. On the other hand, if firms face competition with strategic complements, then they will reduce their investments. This is because doing so reduces competitors’ marginal profits and induces them to match firms’ less aggressive strategies.13
I expect to find a change in investments only among dominant firms with large market share which have the “first-mover” advantage. They can exert a significant influence on the quantity and price of products in the industry, and hence the actions of other firms, while small firms cannot (e.g., Gisser 1984, 1986; Lieberman and Montgomery 1988; Gourio and Rudanko 2014; Aobdia and Cheng 2018; Bloomfield 2019). For example, dominant firms likely have advantages in capital (e.g., liquidity, fixed assets, technology) and costs (e.g., economies of scale, bargaining power,
12 By construction, an increase in a firm’s aggressiveness reduces its competitors’ profits. The difference between
strategic substitutes and complements is its effect on competitors’ marginal profits with respect to their aggressiveness. See Appendix C for further discussion of competition with strategic substitutes versus complements.
13 This prediction is based on the assumption that an increase in a firm’s investments, on average, raises its competitors’
13
customer loyalty) that give them enough flexibility to substantially increase or decrease investments. Therefore, I predict that dominant firms whose investment choices are more revealed by the regulation increase their investments if they have substitutive strategies with competitors, and reduce them if they have complementary ones. This leads to my first set of hypotheses, H1a
and H1b:
H1a: In competition with substitutive strategies, dominant firms with an increase in disclosures about investments raise their investments after the regulation.
H1b: In competition with complementary strategies, dominant firms with an increase in disclosures about investments reduce their investments after the regulation.
My next hypothesis examines the responses of non-dominant firms to their dominant competitors’ strategic investments. Theory predicts that firms’ commitments signaled by investments affect competitors’ decisions about their future actions (e.g., von Stackelberg 1934; Fudenberg and Tirole 1984).14 Therefore, non-dominant firms are expected to choose their optimal
product market strategies conditional on their dominant competitors’ strategies signaled through their investments.
Specifically, after dominant firms change their investments to signal their future product market strategies, non-dominant firms will re-optimize their product market decisions based on their new marginal profitability. The direction of this readjustment depends on whether their new marginal profitability is decreased or increased. Because dominant firms’ strategies signaled by their strategic investments reduce their marginal profits in both types of competition, I expect non-dominant firms to optimally reduce their aggressiveness. Furthermore, because investments foreshadow product market strategies due to their irreversible and time-bound nature, reductions
14 For example, in industries with quantity competition, competitors may interpret the firm’s purchase of inventory as
bad news about their profitability and may reduce their quantity. This is because purchase of large inventory, which is costly to remove if it goes unsold, credibly signals a plan to produce and sell a large quantity.
14
in the aggressiveness of non-dominant firms’ strategies will be first manifested as lower investments. This leads to the following hypothesis, H2:
H2: In both types of competition, non-dominant firms reduce investments after the regulation. Results consistent with these hypotheses would suggest that reporting of future investments makes dominant firms engage more in strategic investments and subsequently makes non-dominant firms adopt less aggressive product market strategies.
4. Sample & Data
To construct my sample, I start with the universe of firms at the intersection of Compustat and CRSP. I then discard utility (SIC codes 4900–4949) and financial (SIC codes 6000–6999) firms, which are highly regulated, and drop small business companies, which are exempt from the regulation. Excluding firm-years that end between the first and second effective dates of the regulation (i.e., June 15, 2003 and December 15, 2003, respectively), I use 5 years before and after the regulation—a 10-year window surrounding the regulation—to examine its impact on strategic investments.15 Furthermore, to mitigate the possibility that changes in sample composition affect
the results, I only keep firms with at least one year of data in each of the pre- and post-regulation periods.
Due to data availability of text-based SEC filings from the EDGAR website and Hoberg and Phillips’ similarity score, as well as an additional sample restriction of having at least one investment contract prior to the regulation (discussed below in section 4.1), my main sample consists of 14,712 firm-years representing 1,890 firms spanning from 1998 through 2008. Below, I discuss in detail how I obtain the data used in my analyses.
15 I use 5 years after the regulation to allow for changes in off-balance sheet purchase obligations to manifest in
investments recognized in financial statements. I find that the average and median durations of purchase obligations reported are 3.2 and 3.3 years, respectively.
15
4.1. Data on Pre-regulation Redaction of Contracts Related to Investments
I collect data on investment contracts by conducting a textual analysis on all material contracts that are filed as exhibits to 10-K/Q and 8-K required by Item 601 of Regulation S-K. Using Python, I first extract all material contracts filed during the 5 years prior to the regulation using the string “<TYPE>EX-10” which the EDGAR system adds to the top of every contract for identification purposes (Li 2013). I then identify investment contracts by counting the number of words related to investments. By building a search string based on prior papers, such as Merkley (2014) and Costello (2013), I ensure that I build a sufficiently comprehensive set of search terms to find contracts related to investment activity.
The words or portions of words I use to capture firms’ investments are the following: advertis, aircraft, build, built, buy, bought, capacity, capacities, CAPEX, clinical, collaborat, construct, consumer, customer, deliver, develop, distribut, drug, engineer, equipment, estate, exclusive, expand, expansion, expenditure, facility, facilities, factory, factories, fuel, hardware, infrastructure, innovate, invent, invest, joint venture, land, license, licensing, manufactur, marketing, material, merchandis, operat, outsource, patent, plant, procure, product, project, property, properties, purchas, research, R&D, right, royalt, science, scientist, sell, software, sold, sponsor, store, storage, supply, supplie, technology, transportation, truck, vehicle, and warehouse. 16
I categorize a contract to be related to investments if it contains at least 5 unique words in the set of search terms for investments. Furthermore, to ensure that I capture the extent of a firm’s investment outsourcing, instead of investment insourcing, I drop any contract that includes at least one term from “acquire”, “acquisition”, “merge”, and “M&A” even if it includes at least 5 unique words related to investments. I also drop contracts that include at least one term related to
16 I do not include words related to operating or capital leases, despite them relating to investments, because disclosures
about future lease obligations were required in a footnote before the regulation (FASB SFAS No. 13 and SFAS NO. 47).
16
employee compensation and debt or shareholder contracts even if it includes at least 5 unique words related to investments.17 These additional steps further increase the accuracy of my ex ante
“treatment” as a proxy for a firm’s exposure to the regulation. Additionally, to address the concern that firms with contractual investments could be fundamentally different from those without, I exclude firms from all my analyses that have no investment contracts during the 5-year pre-regulation period.
Next, among the contracts categorized as investment contracts, I identify those that are redacted. By Rule 406 and Rule 24b-2, portions of material contracts can be redacted if they are deemed by the SEC to cause competitive harm to the filing firm. A redacted copy of the material contract should still be filed as an exhibit to 10-K/Q and 8-K, and I identify redacted contracts by taking an approach similar to those of Verrecchia and Weber (2006), Boone et al. (2016), Glaeser (2018), and Bourveau et al. (2019). Specifically, I use Python to search contracts for the following phrases: “confidential treatment”, “confidential request”, “redact”, “CT Order”, “Freedom of Information Act”, “FOIA”, “Rule 406”, “Rule 24b-2”, “confidential…redact/omit/delete…”, “redact/omit/delete…confidential…”, “intention… redact/omit/delete…”, and “redact/omit/delete…intention...”18 I classify an investment contract as a redacted one, if it contains
any of these phrases.
4.2. Tabular Data on Off-Balance Sheet Purchase Obligations
I use a Python code to collect the purchase obligation data for 5 years after the regulation. In addition to using the terms like purchase obligation(s), firms use various labels to report their
17 The keywords used are as follows: bonus plan/agreement, compensation plan/agreement, employment
plan/agreement, incentive plan/agreement, stock award/incentive/option, severance, pension plan/agreement, retirement benefit/plan/agreement, savings plan, loan (modification) plan/agreement, debenture, promissory note, credit agreement/facility, stock/share (re)purchase, shareholder agreement, shareholders’ agreement, and shareholder agreement.
18 According to Heinle et al. (2018), one could use confidential treatment (CT) order forms to identify redacted
17
future contractual investments, including “supply contract”, “exclusive license agreement”, “production-related obligation”, “commercial commitments”, etc. Therefore, I first read approximately two hundred 10-Ks to create the following list of words or portions of words that firms use to indicate purchase obligations: advertis, agreement, aircraft, alliance, build, buy, capacit, capex, capital, clinical, collaborat, commitment, commercial, connectivity, construct, consult, consumer, customer, deliver, develop, distribut, drug, employment, energy, engineer, equipment, estate, exclusiv, expand, expansion, expenditure, facility, facilities, factory, factories, fuel, gas, hardware, infrastructur, innovat, intellectual, invent, invest, joint venture, land, license, licensing, manufactur, marketing, material, merchandis, methane, obligation, oil, operat, outsourc, patent, plant, procure, product, program, project, promot, property, properties, purchas, research, R&D, right, royalt, science, scientist, sell, software, sponsor, storage, store, supplie, supply, take-or-pay, technology, transmission, transportation, truck, utilities, utility, vehicle, ventures, and vessel.
Then, I scrape the relevant data related to firms’ purchase obligations from 10-Ks downloaded from the EDGAR website, including the unit used (e.g., thousands, millions) and the amounts due each period (e.g., less than one year, one to three years, three to five years, more than five years). To ensure that I only scrape data on purchase obligations, not other types of long-term liabilities (e.g., long-term debt, operating/capital leases, employee benefits), I drop the data whenever its label includes one of the following words: borrowing, benefit, credit, debt, debenture, deposit, equity, financing, interest, lease, loan, minority, note, pension, and tax.
4.3. Data on Types of Competition
To find out whether a firm faces competition with strategic substitutes or complements, I first need to identify its competitors that have the same targeted customers. Therefore, I define as competitors the 5 nearest firms identified by Hoberg and Phillips (2010, 2016)’ firm-by-firm
18
pairwise similarity score in the year prior to the regulation.19 I obtain this data from the
Hoberg-Phillips Data Library. Hoberg and Hoberg-Phillips’ score is based on the similarity of two firms’ final products, not production processes (which some of the more traditional industry classifications do), and is purged of vertical relationships. These features make their measure better at identifying a small set of direct competitors than traditional industry classifications, such as SIC, NAICS, and Fama-French industry classifications, which tend to be more crude.20
Having identified a firm’s direct competitors, following Bloomfield (2019), I use a measure developed by Kedia (2006) to classify the firm’s competition type using the 5-year quarterly data on sales and net income prior to the regulation. The distinction of strategic substitutes versus complements is determined by whether more aggressive strategies (e.g., greater quantity, lower price, higher quality) by competitors decrease or increase a firm’s marginal profitability (Bulow et al. 1985). Kedia’s measure is designed to directly estimate this change in marginal profitability by empirically measuring the slope of a firm’s reaction function (i.e., cross partial derivative of a firm’s net income with respect to the firm’s own sales and its competitors’ sales). If the value of the measure is negative, then the firm faces competition with strategic substitutes. If the value of the measure is positive, then the firm faces competition with strategic complements.
By using firms’ quarterly data on sales and net income during the 5 years before the regulation, I assume that firms’ competition types do not vary from the pre- to post-regulation period as is commonly done in the literature (e.g., Sundaram et al. 1996; Bloomfield 2019). This assumption is reasonable because firms’ competition types are determined by their demand functions (e.g., elasticity) and cost functions (e.g., decreasing marginal cost), which are unlikely to change much
19 My results are robust to using 10 nearest firms, although they become slightly weaker.
20 Hoberg and Phillips (2010, 2016) show that their measure outperforms SIC and NAICS in explaining firm-specific
characteristics, such as profitability, Tobin’s Q, and dividends. Their measure is based on web-crawling and text-parsing algorithms that process the text in the business descriptions of 10-K annual filings on the EDGAR website.
19
during a short time window around the 2003 regulation. See Appendix C for underlying theory for strategic substitutes and complements as well as discussion of Kedia’s empirical proxy.
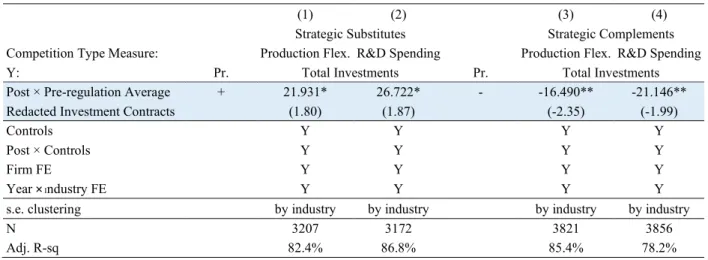
Although it is considered a state-of-art measure for competition type, Kedia (2006)’s measure is subject to errors as it uses ex post data on sales and profits to capture firms’ ex ante incentives. Therefore, in a robustness test, I use the three measures alternative to Kedia (2006) used by Bloomfield (2019). The results from using the two measures based on production flexibility and R&D spending, respectively, are in Table 8. The results from using mining firms are tabulated in the online appendix.
5. Findings
5.1. Descriptive Statistics
Panel A of Table 1 presents descriptive statistics for the key variables used in my main tests. In the 5-year pre-regulation period, firms on average have 0.7 investment contract per year and redact 0.12 investment contract per year. I find that 16.6% (=313/1890) of firms have at least one redacted investment contract during pre-regulation years. These statistics are similar to what prior literature documents. For example, Heinle et al. (2018) find the average annual redacted disclosures of 0.13. Also, Verrecchia and Weber (2006) and Glaeser (2018) report that about 16-17% of firms redact their material contracts. The average amount of total investments reflected on firms’ financial statements—which include inventory purchases, CAPEX minus sale of PP&E, R&D, and advertising expenses—is approximately 100% of lagged total assets. As expected, the majority of these investments are inventory purchases, which constitute about 84% of lagged total assets on average.
Panel B of Table 1 reports descriptive statistics of purchase obligations required by the regulation, which are primarily used in my validation tests. In the post-regulation period,
20
approximately 69% of my sample firm-years report purchase obligations in their 10-Ks, and the average amount of purchase obligations is 25% of total assets.21 If I restrict my sample to those
reporting purchase obligations, the amount of total purchase obligations is large, with an average of $703 million (or 51% of total assets) and a median of $29 million (or 9% of total assets). These suggest that firms’ use of purchase obligations is economically meaningful, although right-skewed.
Moreover, off-balance sheet purchase obligations are economically large, even compared to total investments reflected in firms’ financial statements. The average and median amounts due within one year are 29-30% and 5-7% of annual total investments, respectively. The average and median durations are 3.2 and 3.3 years, respectively. Moreover, the average and median durations weighted by the amount due each period are 2 and 1.7 years, respectively. Figure 1 plots the distribution of purchase obligations by each due date. The figure indicates that the majority of the total payment is due within the first two years. For example, on average, 59% of total purchase obligations are due within one year after the reporting date.22
In the rest of Panel B of Table 1, I show descriptive statistics of purchase obligations by type. Taking advantage of the labels firms use to report purchase obligations in their 10-Ks, I categorize purchase obligations into four types: inventory purchases, CAPEX, R&D, and advertising expenses.23 While all these four types are informative about firms’ future strategies, they represent
investments into different assets (e.g., inventory, PP&E, intangibles). I find that inventory purchases are the most economically significant, with the average amount of 56% of total assets
21 By summing payment obligations across years, I effectively assume a zero discount rate.
22 To compute the duration of purchase obligations, I assume a duration of 1 year for payments due within 1 year, 2
years for payments due in 1-3 years, 4 years for payments due in 3-5 years, and 5 years for payments due after 5 years.
23 The words used to identify inventory purchases include deliver, inventory, manufacture, merchandise, supplies, etc.
Those used to identify CAPEX include capex, capacity, capital expenditure, equipment, facility, plant, etc. Those used to identify R&D include alliance, clinical, collaboration, develop, innovation, license, patent, R&D, research, joint venture, royalty, etc. Those used to identify advertising expenses include advertising, marketing, promotion, sponsor, etc. I categorize a purchase obligation as multiple categories, if its label contains more than one keyword for different categories.
21
(or $730 million) for firms reporting inventory purchases as purchase obligations and 5.7% of total assets for all reporting and non-reporting firms. This suggests that purchase obligations differ significantly from traditional investments considered in prior literature, which tends to focus just on CAPEX or R&D.
Panel A of Figure 2 provides similar information graphically, indicating that inventory purchases are the most frequent and largest type of purchase obligations, followed by R&D, CAPEX, and advertising expenses. This order of magnitudes is the same as the order of magnitudes among the four corresponding financial statement items (see Panel A of Table 1). This is consistent with purchase obligations foreshadowing future investments to be recognized in financial statements. Panel B of Figure 2 illustrates economic magnitudes of the four types of purchase obligations, conditioned on reporting each corresponding type. It shows that all four types have large magnitudes on average when I restrict my sample to reporting firms. For example, although only 9% of purchase obligations correspond to advertising expenses (Panel A of Figure 2), the average and median amounts reported are 65% and 3% of total assets, respectively, for those reporting advertising expenses as purchase obligations (Panel B of Figure 2).
Altogether, the descriptive statistics provided in Table 1, Figure 1, and Figure 2 suggest that purchase obligations disclosed in a given year are likely to be an informative signal about firms’ investments (i.e., expenditures for operations, fixed assets, and innovations) and hence about their product market strategies in the near future. This is consistent with the findings of Lee (2010), who shows that growth in purchase obligations is associated with higher future sales and earnings.
5.2. Tests on Investments (H1a, H1b, and H2)
My main tests examine whether dominant firms affected by the 2003 regulation strategically change their investments (H1a and H1b). Because not all firms are affected by the regulation to
22
revealed by the regulation increase their investments by a greater amount if they have substitutive strategies with competitors, and reduce by a greater amount if complementary. I run the following difference-in-differences regression model separately for dominant firms with strategic substitutes and those with strategic complements:
𝑇𝑇𝑇𝑇𝑇𝑇𝑇𝑇𝑇𝑇 𝐼𝐼𝐼𝐼𝐼𝐼𝐼𝐼𝐼𝐼𝑇𝑇𝐼𝐼𝐼𝐼𝐼𝐼𝑇𝑇𝐼𝐼𝑖𝑖,𝑡𝑡
= 𝛼𝛼1𝑃𝑃𝑇𝑇𝐼𝐼𝑇𝑇𝑡𝑡× 𝑃𝑃𝑃𝑃𝐼𝐼𝑃𝑃𝐼𝐼𝑃𝑃𝑃𝑃𝐼𝐼𝑃𝑃𝑇𝑇𝑃𝑃𝑇𝑇𝑃𝑃𝑇𝑇𝐼𝐼𝑖𝑖+ � 𝛽𝛽 𝐶𝐶𝑇𝑇𝐼𝐼𝑇𝑇𝑃𝑃𝑇𝑇𝑇𝑇𝐼𝐼𝑖𝑖,𝑡𝑡
+ � 𝛽𝛽 𝑃𝑃𝑇𝑇𝐼𝐼𝑇𝑇𝑡𝑡× 𝐶𝐶𝑇𝑇𝐼𝐼𝑇𝑇𝑃𝑃𝑇𝑇𝑇𝑇𝐼𝐼𝑖𝑖,𝑡𝑡+ 𝛿𝛿𝑃𝑃𝑇𝑇𝐼𝐼𝑇𝑇𝑡𝑡(𝑇𝑇𝑃𝑃 𝜏𝜏𝑡𝑡 𝑇𝑇𝑃𝑃 𝜌𝜌𝑖𝑖𝑖𝑖𝑖𝑖× 𝜏𝜏𝑡𝑡) + 𝛾𝛾𝑖𝑖+ 𝜖𝜖𝑖𝑖,𝑡𝑡, (1)
where the dependent variable captures the amount of investments recognized in financial statements (i.e., balance sheet, income statement, and cash flow statement). The key independent variable PreRegRedaction is the annual average number of redacted investment contracts in pre-regulation years, which serves as an ex ante “treatment” measure. Post is an indicator variable that takes the value of one for post-regulation years. 𝜏𝜏𝑡𝑡, 𝜌𝜌𝑖𝑖𝑖𝑖𝑖𝑖× 𝜏𝜏𝑡𝑡, and 𝛾𝛾𝑖𝑖 are year, industry by year,
and firm fixed effects, respectively. For control variables, I follow prior research on investments (e.g., Durnev and Mangen 2009; Badertscher et al. 2013; Beatty et al. 2013; Kausar et al. 2016). I include return on assets, book to market (BTM), market value of equity, leverage, losses indicator, illiquidity, volatility, size-adjusted return, institutional ownership, Tobin’s Q, sales growth, cash flows from operations (CFO), cash and cash equivalents, and asset tangibility.24
I measure the dependent variable as the sum of inventory purchases, R&D expenditure, CAPEX, and advertising expenditure less cash receipts from sale of PP&E multiplied by 100 and scaled by lagged total assets, following Biddle et al. (2009). I do not scale investments by sales, because strategic investments can lead to changes in sales (see Table 6). Also, I do not include acquisition costs because their disclosure is not affected by the regulation.
23
To classify firms into competition with strategic substitutes versus complements, I use a proxy constructed by Kedia (2006) using pre-regulation quarterly sales and net income data for firms and their 5 closest competitors identified by Hoberg and Phillips (2010, 2016) (see Section 4.3 for details). I categorize a firm as a dominant firm if its market share is above the median of its competition group, consisting of the firm itself and its 5 nearest competitors, and a non-dominant firm if its market share is equal to or below the median.
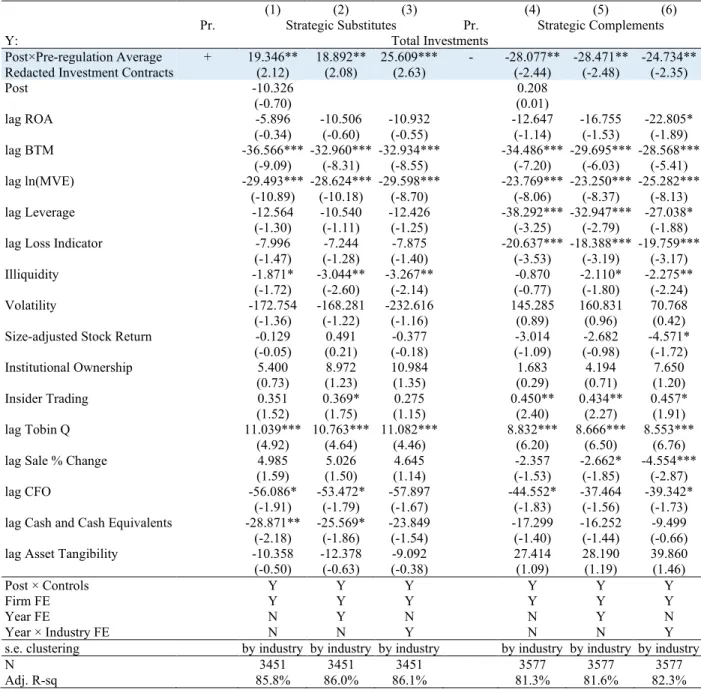
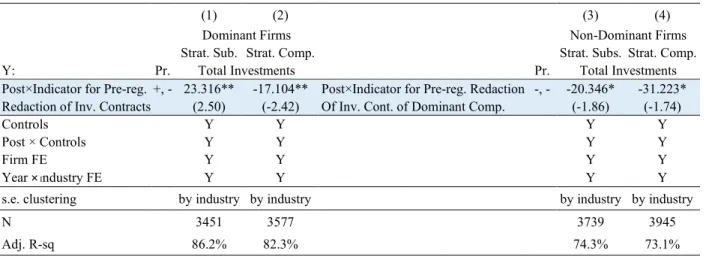
Table 2 reports results consistent with my hypotheses (H1a and H1b). In particular, I find that
dominant firms with a greater increase in investment observability (i.e., a greater degree of “treatment”) increase their investments by a greater amount if they have substitutive strategies with competitors, and reduce them by a greater amount if they have complementary strategies. The coefficient of 25.609 in Column (3) of Table 2 suggests that a one-standard-deviation increase in pre-regulation redacted investment contracts leads to a 5.1% (=25.609⨯0.2/100) increase in investments for a dominant firm with the average value of investments in competition with strategic substitutes.25 Similarly, the coefficient of –24.734 in Column (6) suggests that a
one-standard-deviation increase in pre-regulation redacted investment contracts leads to a 4.9% (=– 24.734⨯0.2/100) reduction in investments for an average dominant firm with strategic complements. According to theory on strategic investments, this two-way finding is consistent with firms strategically changing investments in directions that reduce the marginal profitability of competitors and thus induce less aggressive strategies from them.
25 I find results of similar economic magnitudes when I use log-transformed variables. For example, when I use the
log of investments and the log of one plus pre-regulation average redacted investment contracts as the dependent variable and the key independent variable, respectively, I find that an increase of approximately 0.2 in pre-regulation average redacted investment contracts (or an 18% increase in one plus pre-regulation average) results in approximately a 6.2% increase in investments for an average firm with strategic substitutes and a 5.1% reduction for an average firm with strategic complements. To facilitate interpretations of results, I report results using variables without log transformations.
24
These results are especially intuitive if we view firms with strategic substitutes as competing in quantity, and firms with strategic complements as competing in price or quality, which is a common approach in the literature (e.g., Gal-or 1986; Darrough 1993).26 My findings then suggest
that dominant firms competing in quantity increase their investments to signal a larger quantity, as it will reduce the market-clearing prices of competitors’ products and induce them to reduce their quantities. In contrast, dominant firms competing in price or quality reduce their investments to signal less aggressive pricing or quality strategies, as it will induce competitors to similarly engage in less aggressive behavior.
In Figure 3, I show that the trend lines for investments between dominant firms affected (i.e., “treated” firms) and unaffected (i.e., “control” firms) by the regulation decouple after the regulation for both types of competition, while showing parallel trends prior to the regulation. The figure plots the coefficients on Year⨯ PreRegRedaction for years surrounding the regulation date and their 90% confidence intervals. The notation Year+1 denotes the first firm-year after the
regulation date, Year+2 denotes the second firm-year, and so on. I exclude 4 and 5 years before
the regulation (i.e., Year-5 and Year-4) to find the average difference in investments between
firms affected and unaffected by the regulation in the absence of the regulation.27 Therefore, the
coefficients on the interaction terms measure the change in investments relative to the baseline years Year-5 and Year-4. The coefficients become significant in the year following the regulation,
suggesting that “treated” firms and “control” firms display strong similarities in investments leading up to the regulation. After the regulation date, “treated” firms engage in significantly higher investments in competition with strategic substitutes and lower in competition with strategic complements.
26 This categorization is always true when demand is linear and marginal cost is constant.
27 In all tests, I exclude firm-years that end between the two effective dates of the regulation (i.e., June 15, 2003 and
25
I supplement my main tests with tests on different components of investments. Specifically, I estimate the regression model (1), after replacing the dependent variable with investments for capacity and for product differentiation. These tests are motivated by the idea that competition with strategic substitutes has greater physical capacity (e.g., Kreps and Scheinkman 1983; Maggi 1996), and competition with strategic complements has a greater degree of product differentiation or customer loyalty (e.g., Chamberlin 1933; Lancaster 1966; Schmalensee 1982; Singh and Vives 1984). These characteristics suggest that investments in capacity likely have a greater strategic value in competition with strategic substitutes, and investments in product differentiation have a greater strategic value in competition with strategic complements.
I use the sum of inventory purchases and CAPEX less cash receipts from sale of PP&E as investments in capacity, and the sum of R&D and advertising expenses as investments in product differentiation. The results of tests on these two types of investments are shown in Table 3. Table 3 shows that, after an increase in the observability of investments, dominant firms with strategic substitutes primarily increase investments in capacity, and those with strategic complements primarily reduce investments in product differentiation. These results provide additional assurance that changes in investments are driven by strategic motives.28 Moreover, these results are
consistent with firms with strategic substitutes primarily competing in quantity and those with strategic complements primarily competing in quality. If R&D expenses are considered to be reducing production costs rather than increasing product differentiation, the result for firms with strategic complements is consistent with them primarily competing in price.
28 Further tests show that results in competition with strategic substitutes concentrate in inventory purchases and
results in competition with strategic complements concentrate in R&D (untabulated). This is consistent with the 2003 regulation primarily increasing disclosures of firms’ future investments in inventory purchases and R&D (see Panel B of Table 1).
26
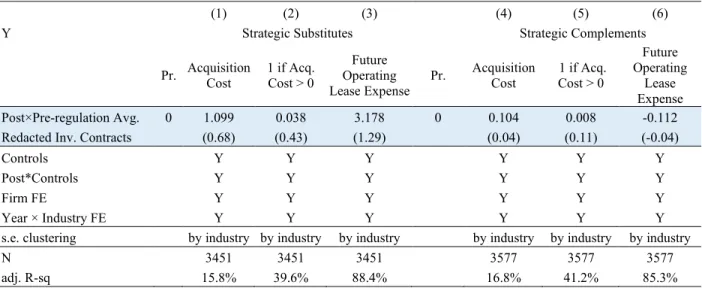
I report in Table 4 the results of falsification tests where I use acquisition costs or off-balance sheet future operating lease expenses as the dependent variable in model (1). Although these two investment items are informative about future strategies, their disclosures were required even before 2003. By SFAS No. 13, disclosures about future operating leases were required in a 10-K footnote before the regulation. Also, disclosures about acquisitions were required, prior to the regulation, on Form 8-K, Schedule 14A, S-4, etc. I find that no dominant firms change their acquisition costs or operating lease expenses after the 2003 regulation.29 This non-result for
investment items whose disclosures are not affected by the regulation adds further confidence to my findings.30
Next, I investigate whether and how non-dominant firms respond to dominant firms’ strategic investments. To test this, I change model (1) such that Post is interacted with the pre-regulation average number of redacted investment contracts for a firm i’s dominant competitors among the 5 nearest competitors identified by Hoberg and Phillips (2010, 2016) (i.e., average “treatment” of dominant competitors). This is because non-dominant firms’ response will be correlated with how much their dominant competitors are affected by the regulation and therefore are engaging in strategic investments. The model for testing non-dominant firms’ response is as follows:
𝑇𝑇𝑇𝑇𝑇𝑇𝑇𝑇𝑇𝑇 𝐼𝐼𝐼𝐼𝐼𝐼𝐼𝐼𝐼𝐼𝑇𝑇𝐼𝐼𝐼𝐼𝐼𝐼𝑇𝑇𝐼𝐼𝑖𝑖,𝑡𝑡
= 𝛼𝛼1𝑃𝑃𝑇𝑇𝐼𝐼𝑇𝑇𝑡𝑡× 𝑃𝑃𝑃𝑃𝐼𝐼𝑃𝑃𝐼𝐼𝑃𝑃𝑃𝑃𝐼𝐼𝑃𝑃𝑇𝑇𝑃𝑃𝑇𝑇𝑃𝑃𝑇𝑇𝐼𝐼−𝑖𝑖+ � 𝛽𝛽 𝐶𝐶𝑇𝑇𝐼𝐼𝑇𝑇𝑃𝑃𝑇𝑇𝑇𝑇𝐼𝐼𝑖𝑖,𝑡𝑡
+ � 𝛽𝛽 𝑃𝑃𝑇𝑇𝐼𝐼𝑇𝑇𝑡𝑡× 𝐶𝐶𝑇𝑇𝐼𝐼𝑇𝑇𝑃𝑃𝑇𝑇𝑇𝑇𝐼𝐼𝑖𝑖,𝑡𝑡+ 𝜌𝜌𝑖𝑖𝑖𝑖𝑖𝑖× 𝜏𝜏𝑡𝑡+ 𝛾𝛾𝑖𝑖 + 𝜖𝜖𝑖𝑖,𝑡𝑡. (2)
I predict 𝛼𝛼1<0 for non-dominant firms across both types of competition (H2) for the following
reasons. In competition with strategic substitutes, it is optimal for non-dominant firms to reduce
29 I measure off-balance sheet operating lease expenses as the sum of all future operating expenses. The results are
robust to including the current operating lease expense recognized in income statements.
27
the aggressiveness of strategies when dominant competitors signal more aggressive strategies through increased investments, because competitors’ aggressive strategies reduce their marginal profitability. Similarly, in competition with strategic complements, it is optimal to reduce aggressiveness when dominant competitors signal less aggressive strategies through reduced investments, because competitors’ less aggressive strategies reduce their marginal profitability. Non-dominant firms’ less aggressive strategies will manifest as lower investments, because investments are indicative of firms’ future product market strategies.
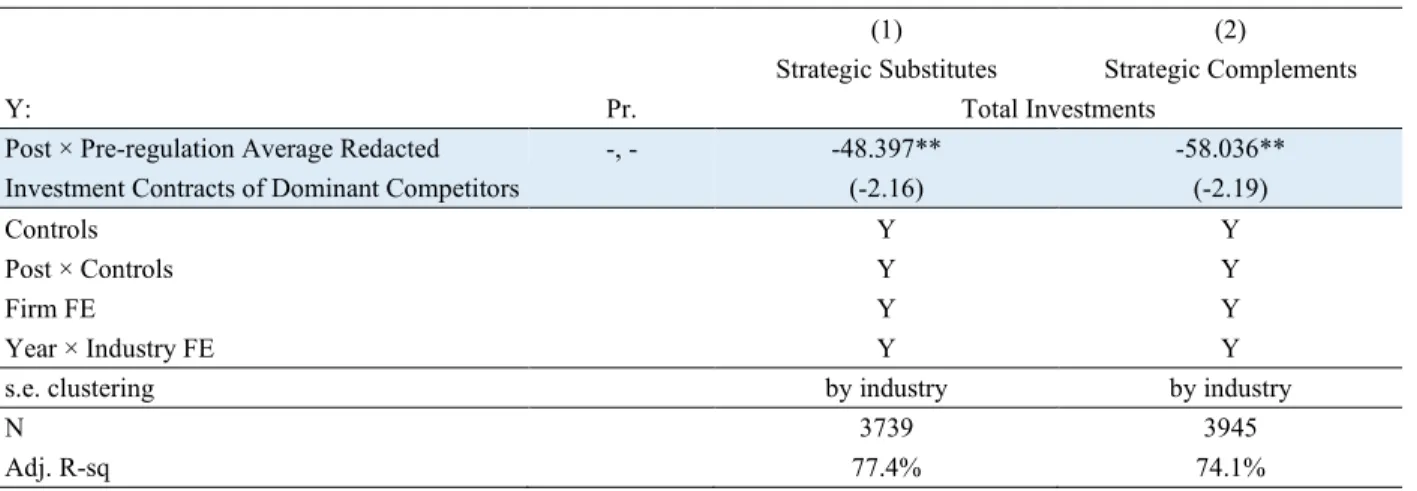
The results in Panel A of Table 5 are consistent with my prediction for H2. The coefficients
of –48.397 and –58.036 in Columns (1) and (2), respectively, suggest that a one-standard-deviation increase in a dominant competitor’s pre-regulation redacted investment contracts reduces an average non-dominant firm’s investments by 3.2% (=–48.397⨯(0.2/3)/100) in competition with strategic substitutes and by 3.9% (=–58.036⨯(0.2/3)/100) in competition with strategic complements. These suggest that non-dominant firms respond optimally to dominant firms’ signaling of future strategies that reduce their marginal profits.
Again, if we view firms with strategic substitutes as competing in quantity, and firms with strategic complements as competing in price or quality, these results for non-dominant firms are very intuitive. In quantity competition, when dominant firms increase their investments to signal a larger quantity, it is optimal for non-dominant firms to reduce their investments in quantity and avoid a further reduction in the market-clearing prices of their products. In price or quality competition, when dominant firms reduce their investments to signal less aggressive pricing or quality strategies, it is optimal for non-dominant firms to also reduce their investments in lowering price or improving quality and benefit from greater profit margins.
Furthermore, as falsification tests, I show in Panel B of Table 5 that non-dominant firms’ changes in investments are not correlated with increases in the observability of their own
28
investments. This is consistent with non-dominant firms not engaging in strategic investments as their investments do not have strategic effects (i.e., they do not have a “first-mover” advantage).
In sum, my findings are consistent with H1a, H1b, and H2. I find that dominant firms
strategically change investments after the regulation, which increased the observability of future investments to competitors and therefore the signaling value of investments. I also find that these changes in investments induce less aggressive behavior from their non-dominant competitors.
5.3. Implications for Competition
In this section, I test whether dominant firms’ strategic investments change their own and non-dominant competitors’ product market outcomes. I do so by estimating the following two regression models for dominant firms and non-dominant firms, respectively:
𝑃𝑃𝑃𝑃𝑇𝑇𝑃𝑃𝑃𝑃𝑃𝑃𝑇𝑇𝑃𝑃𝑇𝑇𝑃𝑃𝑃𝑃𝐼𝐼𝑇𝑇𝑃𝑃𝑃𝑃𝑇𝑇𝑃𝑃𝑇𝑇𝐼𝐼𝐼𝐼𝑖𝑖,𝑡𝑡 = 𝛼𝛼1𝑃𝑃𝑇𝑇𝐼𝐼𝑇𝑇𝑡𝑡× 𝑃𝑃𝑃𝑃𝐼𝐼𝑃𝑃𝐼𝐼𝑃𝑃𝑃𝑃𝐼𝐼𝑃𝑃𝑇𝑇𝑃𝑃𝑇𝑇𝑃𝑃𝑇𝑇𝐼𝐼𝑖𝑖+ � 𝛽𝛽 𝐶𝐶𝑇𝑇𝐼𝐼𝑇𝑇𝑃𝑃𝑇𝑇𝑇𝑇𝐼𝐼𝑖𝑖,𝑡𝑡+ � 𝛽𝛽 𝑃𝑃𝑇𝑇𝐼𝐼𝑇𝑇𝑡𝑡× 𝐶𝐶𝑇𝑇𝐼𝐼𝑇𝑇𝑃𝑃𝑇𝑇𝑇𝑇𝐼𝐼𝑖𝑖,𝑡𝑡 + 𝜌𝜌𝑖𝑖𝑖𝑖𝑖𝑖× 𝜏𝜏𝑡𝑡+ 𝛾𝛾𝑖𝑖+ 𝜖𝜖𝑖𝑖,𝑡𝑡, (3) 𝑇𝑇𝐼𝐼𝑃𝑃 𝑃𝑃𝑃𝑃𝑇𝑇𝑃𝑃𝑃𝑃𝑃𝑃𝑇𝑇𝑃𝑃𝑇𝑇𝑃𝑃𝑃𝑃𝐼𝐼𝑇𝑇𝑃𝑃𝑃𝑃𝑇𝑇𝑃𝑃𝑇𝑇𝐼𝐼𝐼𝐼𝑖𝑖,𝑡𝑡 = 𝛼𝛼1𝑃𝑃𝑇𝑇𝐼𝐼𝑇𝑇𝑡𝑡× 𝑃𝑃𝑃𝑃𝐼𝐼𝑃𝑃𝐼𝐼𝑃𝑃𝑃𝑃𝐼𝐼𝑃𝑃𝑇𝑇𝑃𝑃𝑇𝑇𝑃𝑃𝑇𝑇𝐼𝐼−𝑖𝑖+ � 𝛽𝛽 𝐶𝐶𝑇𝑇𝐼𝐼𝑇𝑇𝑃𝑃𝑇𝑇𝑇𝑇𝐼𝐼𝑖𝑖,𝑡𝑡+ � 𝛽𝛽 𝑃𝑃𝑇𝑇𝐼𝐼𝑇𝑇𝑡𝑡× 𝐶𝐶𝑇𝑇𝐼𝐼𝑇𝑇𝑃𝑃𝑇𝑇𝑇𝑇𝐼𝐼𝑖𝑖,𝑡𝑡 + 𝜌𝜌𝑖𝑖𝑖𝑖𝑖𝑖× 𝜏𝜏𝑡𝑡+ 𝛾𝛾𝑖𝑖+ 𝜖𝜖𝑖𝑖,𝑡𝑡. (4)
In these two models, the dependent variable represents various product market outcomes, such as COGS, sales, and profit margins. Post is an indicator variable that takes the value of one for post-regulation years. 𝜌𝜌𝑖𝑖𝑖𝑖𝑖𝑖× 𝜏𝜏𝑡𝑡 and 𝛾𝛾𝑖𝑖 are industry by year and firm fixed effects, respectively.
𝑃𝑃𝑃𝑃𝐼𝐼𝑃𝑃𝐼𝐼𝑃𝑃𝑃𝑃𝐼𝐼𝑃𝑃𝑇𝑇𝑃𝑃𝑇𝑇𝑃𝑃𝑇𝑇𝐼𝐼𝑖𝑖 in model (3) is the pre-regulation average number of firms’ own redacted
investment contracts in the 5-year pre-regulation period (i.e., “treatment”), and 𝑃𝑃𝑃𝑃𝐼𝐼𝑃𝑃𝐼𝐼𝑃𝑃𝑃𝑃𝐼𝐼𝑃𝑃𝑇𝑇𝑃𝑃𝑇𝑇𝑃𝑃𝑇𝑇𝐼𝐼−𝑖𝑖 in model (4) is the pre-regulation average number of redacted investment
29
contracts of dominant competitors identified by Hoberg and Phillips (2010, 2016) (i.e., average “treatment” of dominant competitors).
I first investigate whether both dominant and non-dominant firms’ COGS change in the same direction as their investments. This is to validate that investments are credible commitments. I use COGS as the dependent variable to capture the aggressiveness of strategies, because a higher value of COGS is consistent with a larger quantity sold via aggressive product market strategies, and a lower value of COGS is consistent with a smaller quantity sold. I predict 𝛼𝛼1 > 0 for dominant
firms with strategic substitutes, 𝛼𝛼1 < 0 for dominant firms with strategic complements, and 𝛼𝛼1 <
0 for non-dominant firms across both types of competition.
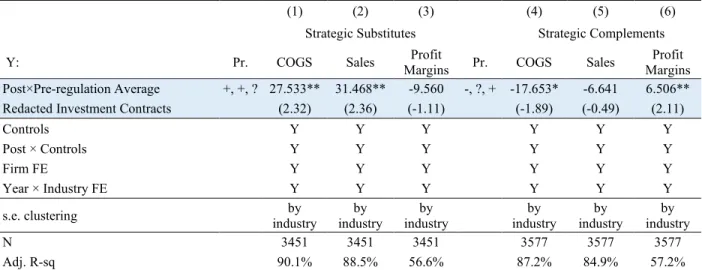
The results for dominant firms are shown in Columns (1) and (4) of Table 6 Panel A. The coefficient of 27.533 in Column (1) suggests that a one-standard-deviation increase in pre-regulation redacted investment contracts results in a 6.6% (=27.533⨯0.2/83) increase in COGS over lagged total assets for an average dominant firm with substitutive strategies. Similarly, the coefficient of –17.653 in Column (4) indicates that a one-standard-deviation increase in pre-regulation redacted investment contracts results in a 4.3% (=–17.653⨯0.2/83) reduction in COGS over lagged total assets for an average dominant firm with complementary strategies. This suggests that dominant firms’ signaling of commitments through investments foretells the aggressiveness of their future strategies (i.e., it is not “cheap talk”), which is expected, as investments are irreversible and time-bound.
The results for non-dominant firms are shown in Columns (1) and (4) of Table 6 Panel B. The results suggest that non-dominant firms adopt less aggressive strategies, consistent with their reduced investments. The coefficients in Columns (1) and (4) suggest that a one-standard-deviation increase in one of the dominant competitors’ pre-regulation redacted investment contracts leads to a 3.5% (=–42.956⨯(0.2/3)/83) reduction in COGS over lagged total assets for an average