The Effect of Continuous Infusion of Human Parathyroid Hormone on Bone Architecture in Female Mice
by
Rahel E. Eisenberg
Submitted to the Department of Mechanical Engineering in Partial Fulfillment of the Requirements
for the Degree of
Bachelor of Science in Engineering as recommended by the Department of Mechanical Engineering at the
Massachusetts Institute of Technology June 2009
o Rahel E. Eisenberg All rights reserved
ARCHIVES
MASSACHUfSETTS I irLrufkfOF TECHNOLOGY
SEP
16
2009
L
1 '
R i
I
The author hereby grants to MIT permission to reproduce and to distribute publicly paper and electronic copies of this thesis document in whole or in part
in any medium now known or hereafter created.
Signature of Author:
Department of MechanicaEngineering
/A
/
/May 8, 2009Certified by:
Senior Lecturer of Harvar
Accepted by:
W V
- -Myron
Spector
d-MIT Division
ealth
iences
and Technology
hesis Supervisor
k
r
sr J. Lienhard V
' ..
C
Qollins Professor
of Mechanical Engineering
Chairman, Undergraduate Thesis Committee
The Effect of Continuous Infusion of Human Parathyroid Hormone on Bone Architecture in Female Mice
by
Rahel E. Eisenberg
Submitted to the Department of Mechanical Engineering on May 8, 2009 in partial fulfillment of the requirements for
the Degree of Bachelor of Science in Engineering as recommended by the Department of Mechanical Engineering
ABSTRACT
This research sought to create an animal model of secondary
hyperparathyroidism through continuous infusion of parathyroid hormone (PTH) in adult female mice, and to subsequently study the catabolic effects of PTH. Osmotic pumps were implanted subcutaneously and infused either vehicle, 40 pg/kg/day of PTH or 80 pg/kg/day of PTH for either 2 week or 4 week duration. Total body bone mineral density (BMD) and bone mineral content (BMC), trabecular and cortical bone microarchitecture, and serum calcium levels were measured. There were no significant differences in BMD or BMC in either study in mice infused with either dosage, nor were there significant differences in femoral cortical bone microarchitecture. Trabecular bone in the distal femur as well as the L5 vertebrae was also largely preserved. This data indicate that short term infusion of PTH in normal mice does not mimic clinical characteristics and therefore may not be an appropriate model of secondary hyperparathyroidism and the catabolic effects of PTH.
Thesis Supervisor: Myron Spector
Title: Senior Lecturer of Harvard-MIT Division of Health Sciences and Technology
Contents
INTRODUCTION ... 7 BACKGROUND ... 9 Parathyroid Hormone... 9 Primary Hyperparathyroidism ... ... 10 Secondary Hyperparathyroidism... ... ... ... 10 Related Work ... 11MATERIALS AND METHODS ... 13
Anim als
...
... ...
13
M a te ria ls ...
The Mini Osmotic Pump ...
... 1313
The Mini Osmotic Pump
...
... 13
Experim ental D esign...
...
... 14
Procedureup
Assignment... 15
Group Assignment...
...
15
P TH Preparation... ... 15
Pum p
Im
plantation...
... 16
P ost S urgery...
.. ... 17
Blood Collection by Submandicular Bleeding
... 18
Total Body BMD and BMC by DXA
... ...
18
Bone Architecture by
pCT ...
19
Blood Serum Calcium Measurement...
20
Data Analysis...
...
2 1
RESULTS ... 23Total Body BMD and BMC by DXA
...
23
Trabecular Bone Microarchitecture by
p CT ...
27
Femoral Cortical Bone Microarchitecture by pCT...
32
Serum Calcium .
... 33
DISCUSSION ... 35
CONCLUSION ... ... 39
Introduction
Bone is a highly active tissue which is continually degrading and regenerating itself. The coupling of the bone formation and resorption processes help maintain strong bones by simultaneously removing old bone and replacing it with new bone. However, as people age their bones tend to become more fragile due to bone loss. This phenomenon, especially in women, is best known as
osteoporosis.
The effects of bone loss can be devastating to patients and significantly alter their quality of life and the activities in which they can participate. As bone loss occurs, bone density decreases causing the mechanical properties of the bone, such as its Young's modulus and yield stress, to also decrease. The decrease in these mechanical properties is responsible for the higher incident rate of
fractures seen in patients suffering from osteoporosis. Estrogen and calcium deficiencies play roles in bone loss. While the mechanisms through which estrogen effects bone mineral density and microarcitecture are well
characterized, the mechanisms through which hyperparathyroidism induces skeletal fragility is less developed.
There are three basic ways to develop bone fragility. The first is simply failing to produce strong bones during ones growth, while the second two ways involve the bone remodeling process, in other words, bone resorption and formation. As mentioned previously, bone resorption and formation are coupled processes and therefore either excessive bone resorption and/or an inadequate bone formation
response constitute the other two ways through which one can develop skeletal fragility and associated elevated risk of fracture.'
Bone remodeling can occur in both the trabecular and cortical bone. The process begins with when precursor stem cells become osteoclasts, bone resorbing cells, through interaction with cells of osteoblastic, bone building, roots. Once formed, the osteoclasts digest the bone quickly. Subsequently, formation begins, but is a
much longer process during which waves of new osteoblasts continue the matrix building process while old cells are incorporated into the bone.2 The difference in the time required for each cell type to do its respective job suggests that any increase in the rate of bone resorption will yield a net decrease in bone mass. Similarly, if osteoblasts fail to respond to the bone resorption process, this too can result in net bone loss. Both aforementioned means of bone loss are present in osteoporotic patients.3
' Raisz LG 2005 Pathogenesis of osteoporosis: concepts, conflicts, and prospects. Journal of
Clinical Investigation 115:3318-3325.
2 Raisz LG 2005.
Both estrogen and calcium deficiencies are considered to be the primary forces resulting in osteoporosis. Studies have shown that post-menopausal women, deficient in estrogen, have higher rates of both bone resorption and bone formation.4 However, the increase in resorption rate is greater and therefore bone loss is induced. Similarly, calcium deficiencies and vitamin D deficiencies can result in secondary hyperparathyroidism by decreasing serum calcium, which in turn leads to bone loss.
As a contributor to osteoporosis, it is important to better understand the
mechanism through which secondary hyperparathyroidism induces bone loss. The defining characteristic of hyperparathyroidism is a continuously elevated level of parathyroid hormone (PTH). While the continuous elevation of PTH in the blood is believed to be associated with the induced bone loss that occurs in patients with hyperparathyroidism, the association has yet to be fully understood or quantified. Therefore, this thesis research sought to develop an animal model to study the effects of hyperparathyroidism on bone to develop a better
understanding of the relationship between continuous high levels of PTH and bone resorption.
4 Ebeling PR, Atley LM, Guthrie JR, Burger HG, Dennerstein L, Hopper JL, Wark JD 1996 Bone
turnover markers and bone density across the menopausal transition. Journal of Clinical
Endocrinology and Metabolism 81:3366-3371.
Background
Parathyroid Hormone
Parathyroid hormone (PTH) regulates blood serum calcium levels. It does so by stimulating calcium re-absorption in the kidney and inducing bone resorption. For example, low serum calcium levels cause an increase in the secretion of PTH from the parathyroid. The elevated levels of PTH then induce more bone
resoprtion as well as increase the calcium re-absorption in the kidney and intestine. The re-absorption of the calcium as well as calcium liberated by bone resorption cause the blood serum calcium concentration to increase. As the serum calcium level returns to normal, negative feedback is sent to the
parathyroid gland and it secretes less PTH.6 This cycle allows the parathyroid, through the secretion of PTH, to maintain a balanced level of calcium in the
blood.
Although PTH causes bone resoption in order to maintain a balanced blood serum calcium level, PTH is known to have a dual effect on bone; it stimulates both bone resorption and bone formation. PTH's anabolic effect has been well studied and occurs when administered intermittently at low doses, modeling short term fluctuations. 7 The bone forming effect of intermittent administration has
been shown to increase total body bone mineral density (BMD), improve
trabecular bone microarchitecture and reduce risk of fracture8- . This is partially attributable to the effect that PTH has on cells of osteoblast roots and the coupling of the bone formation and resoprtion processes, however many other cellular processes involving PTH receptors and precursor osteoblasts are also responsible for the anabolic effect.10
In contrast, PTH's catabolic effect is associated with continuously elevated levels of PTH which are seen in patients with hyperparathyroidism. When improperly regulated, PTH in turn is unable to successfully regulate blood serum calcium, and therefore continuously high levels of PTH are also associated with
6 Partridge NC, Li X, Qin L. 2006 Understanding Parathyroid Hormone Action. New York Academy of Sciences 1068: 187-193
7 Partridge NC, Li X, Qin L. 2006.
8 Neer RM, Arnaud CD, Zanchetta JR, Price R, Gaich GA, Reginster JY, Hodsman AB, Eriksen EF, Ish-Shalom S, Genant HK, Wang O, Mitlak BH 2001 Effect of parathyroid hormone (1-34) on fractures and bone mineral density in post-menopausal women. New England Journal of
Medicine 344:1434-1441.
9 Dempster DW, Cosman F, Kurland ES, Zhou H, Nieves J, Woelfert L, Shane E, Plavetic K, Muller, Bilezikian J, Lindsay R 2001 Effects of daily treatment with parathyroid hormone on bone microarchitecture and turnover in patients with osteoporosis: A paired biopsy study. Journal of Bone and Mineral Research 16:1846-1853.
10 Robert A Nissenson, "Parathyroid Hormone and Parathyroid-Related Protein," in Osteoporosis, Two Volume Set, Volume 1-2, ed. R Marcus, D Feldman, D Nelson, CJ Rosen (Elsevier
hypercalcemia, elevated blood serum calcium, which is indicative of PTH's
catabolic effect to bone in humans." These effects are seen in patients with both types of hyperparathyroidism, primary and secondary.
Primary Hyperparathyroidism
Primary hyperparathyroidism is the result of overproduction of PTH, typically caused by an adenoma on the parathyroid gland, and is characterized by severe hypercalcemia, nephrolithiasis, and osteoporosis. It is associated with a
decrease in bone mineral density, especially in post-menopausal women without estrogen supplementation, and bone loss at cortical sites. Trabecular bone microarchitecture is generally preserved, although some studies have shown a sight decrease there as well.12
In the 1970s, detection of hyperparathyroidism became easy due to the creation of the autoanalyser which was able to diagnose hypercalcemia, an indicator of hyperparathyroidism. Therefore most cases now are asymptomatic at the time of diagnosis.13
Currently, diagnosis is done using PTH assays and checking the level of 25-hydroxyvitamin D. Although most cases are asymptomatic, it is still believed that parathyroidectomy is the best course of treatment. Studies have demonstrated that surgery halts bone loss, and actually increases BMD.14 Although surgery has positive effects, it is not always recommended. Patients must meet certain requirements including serum calcium levels > 1 mg/dL above the upper limits of normal, reductions in bone mineral density particularly in peri-or postmenopausal women and men, peri-or being under 50 years of age. When these requirements are not met, it has been determined that a patient's condition can be safely monitored.15
Secondary Hyperparathyroidism
Unlike primary hyperparathyroidism, secondary hyperparathyroidism is not caused by adenoma on the parathyroid gland, but is generally the result of renal failure and/or deficiency in calcium intake and vitamin D levels.16 General
characteristics are high fracture rate and low bone mineral density, particularly in
11 Bilezikian JP, Silverberg SJ 2004 Clinical Practice. Asymptomatic primary hyperparathyroidism. New England Journal of Medicine 350:1746-1751.
Khan A, Bilezikian J 2000 Primary hyperparathyroidism: pathophysiology and impact on bone. Canadian Medical Association Journal 163(2):184-7.
13 Khan A, Bilezikian J 2000.
14 Bilezikian JP, Khan AA, Potts JT et al. 2009 Guidelines for the Management of Asymptomatic
Primary Hyperparathyroidism: Summary Statement from the Third International Workshop. Journal of Clinical Endocrinology and Metabolism 94(2):335-339.
15 Bilezikian JP, Khan AA, Potts JT et
al. 2009.
the femoral neck. Regardless of the cause, bone turnover still increases in response to the elevated PTH level and is associated with cortical bone loss while preserving trabecular architecture.17
Diagnosis is typically done by radiograph or bone density measurement, since the primary effect is skeletal. However, patients also generally have slightly lower than normal serum calcium levels and elevated levels of PTH. In patients
suffering from secondary hyperparathyroidism due to vitamin D deficiency, the prescribed treatment is vitamin D supplementation in doses of 30 ng/ml or
higher.18
Related Work
Various studies have tried to understand the dual actions PTH has on bone. While many have been successful in creating animal models that exhibit PTH's anabolic effects when administered intermittently, few have been able to produce the catabolic effect produced by continuously high levels of PTH, an effect
clinically encountered in hyperparathyroidism.
lida-Klein et al. (2005) delivered continuous hPTH(1-34) of 40 pg/kg/day to 10 week old, non-Ovx, C57BL/J6 female mice via Alzet 2002 miniosmotic pumps for
14 days. Their BMD measurements by DXA showed no difference between the control and the hPTH(1-34) infused mice at any site of scanning (femur, tibia, lumbar vertebrae 4-5). However, assessment of the bone micro-archictecture by
pCT showed a significantly lower trabecular connectivity density in the PTH infused mice versus the controls. Though only the difference in connectivity density was statistically significant, other pCT measured parameters, such as trabecular number, and thickness also tended to be lower in the PTH infused mice. In addition to showing differences in bone micro-architecture between PTH
infused mice and control mice, many measured biochemical markers, such as serum calcium and bone resoprtion marker (mTRAP), also supported the
hypothesis that continuous administration of PTH has a catabolic effect on bone. The total serum calcium in the PTH infused mice was 35% higher than in the control mice, showing induced hypercalcemia.19
V. Shen et al. (2000) studied the effects of continuously elevated levels of PTH in female, estrogen deficient and estrogen satiated, 7 month old Sprague-Dawley
rats. They continuously delivered a 30 pg/kg/day dose of PTH to Ovx mice either
17 Lips P 2001 Vitamin D Deficiency and Secondary Hyperparathyroidism in the Elderly:
Consequences for Bone Loss and Fractures and Therapeutic Implications. Endocrine Review 22(4):477-501.
18 Raisz LG 2005.
19 lida-Klein A, Lu SS, Kapadia R, Burkhart M, Moreno A, Dempster DW, Lindsay R 2005 Short-term continuous infusion of human parathyroid hormone 1-34 fragment is catabolic with
decreased trabecular connectivity accompanied by hypercalcemia in C57BL/J6 mice. Journal of Endocrinology 186:549-557.
in combination with or without estrogen for 4 weeks. This study demonstrated the catabolic effect of continuously elevated PTH level in Ovx, estrogen deficient mice, and the ability of estrogen to protect the bone from this effect. Bone loss, as measured by BMD, in PTH treated rats became statistically significant compared to the control at all sites of measurement (distal, midshaft, and proximal femur) after 4 weeks of treatment only, though serum calcium levels were significantly higher by 2 weeks of treatment. Additionally, through bending tests, they showed a significant decrease in femoral neck strength of the PTH treated mice after 4 weeks of treatment, further substantiating the evidence that continuous elevation of PTH in estrogen deficient rats is deleterious to bone, such as increased cortical porosity, preserved trabecular bone microarchitecture, and increased osteoclast recruitment .20
In the same study as Shen et al., H. Zhou et al. studied the effects of continuous PTH administration on vertebral trabecular and cortical bone (same 7 month old, Ovx, female, estrogen deficient and replete, Sprague-Dawley rats).
Histomorphometry showed that PTH treatment alone partially in Ovx rats partially restored the trabecular bone in the vertebrae, however they also saw that it
induced an increase in cortical porosity. In estrogen replete, PTH treated rats, they showed that trabecular bone architecture was fully restored to that of the control. Overall, they found that Ovx rats treated with 30 pg/kg/day of PTH exhibited the same bone weakening characteristics as postmenopausal women with primary hyperparathyroidism.2
Based on these studies, we designed our study to take into account both the 2 and 4 week time points and to test the continuous administration of two different PTH doses, 40 and 80 pg/kg/day. Based on lida-Klein et al.'s 2 week results, many of which almost reached significant differences, as well as Shen et al.'s and Zhou et aL's significant results at 4 weeks, we hoped that after treating mice with PTH for 4 weeks significant differences between PTH infused and control groups would be reached. Additionally, we wanted to explore the effects of higher doses of PTH in mice after only two weeks of treatment. Our study setup allowed us to see both the time and dose dependence of continuous PTH administration in mice.
20 Shen V, Birchman R, Wu DD, Lindsay R 2000 Skeletal Effects of Parathyroid Hormone Infusion
in Ovariectomized Rats With or Without Estrogen Repletion. Journal of Bone and Mineral Research 15:740-746.
21 Zhou H, Shen V, Dempster DW, Lindsay R 2001 Continuous Parathyroid Hormone and
Estrogen Administration Increases Vertebral Cancellous Bone Volume and Cortical Width in the Estrogen-Deficient Rat. Journal of Bone and Mineral Research 16:1300-1307.
Materials and Methods
Animals
Ten to eleven week old female C57BL/J6 mice were purchased from Jackson
Laboratory (Bar Harbor, ME, USA). The animals arrived in the laboratory one
week prior to the implantation of the Alzet pumps, and were handled daily prior to
surgery. They were housed 4 animals per cage and were maintained on a
12:12-h lig12:12-ht-dark cycle wit12:12-h free access to mouse c12:12-how (7964 Harlan Teklad F6
Rodent Diet, 1.35% Ca, Harlan Teklad, Indianapolis, IN, USA) and water. The
animal protocol was approved by the ethical committee on animal care and use
at Beth Israel Deaconess Medical Center, Boston, MA.
Materials
hPTH(1-34) was purchased from Bachem (Torrence, CA, USA).
Alzet miniosmotic pumps, 2002 and 2004 pump models purchased from Durect
Corporation (Cupertino, CA, USA).
QuantiChrom Calcium Assay kit was purchased from BioAssay Systems
(Hayward, CA, USA).
The Mini Osmotic Pump
ALZET osmotic pumps allow the continuous
delivery of a substance to a subject. The
pump has five main components: the
mirmeai,,,blsemipermeable membrane, the osmotic layer, Flow mbr
the impermeable layer, the flexible agent
Moderotorreservoir, and the flow moderator (Figure 1).
The high osmolality of the osmotic layer
allows water to flow into the pump through
smoticthe semipermeable membrane. As water
a r
enters the osmotic layer, also called the salt
sleeve, it compresses the flexible reservoir
mpermtoblowhich contains the test solution causing the ayor
solution to be released form the pump as its
Tst
predetermined rate. The delivery rate is
Rg.ntdetermined only by the water permeability of
Figure 1. ALZET mini-osmotic pump schematic.
the semipermeable membrane, and is independent of the test solution.22
The only difference between the two pump models used in these experiments, the 2002 and 2004 models, is the duration of time for which they can be used. Though the two pumps are exactly the same size and have the same size reservoir (200 pL), the 2002 model works for only two weeks, while the 2004 model can be used for up to four weeks. This functional difference is
accomplished by the different delivery rates of each pump; while the 2 week pump's delivery rate is 0.5 pL/hr, the 4 week pump delivers at half that rate, 0.25 pL/hr. The delivery rate is determined by the water permeability of the
semipermeable membrane of each pump model.
Experimental Design
We performed two separate experiments. The first was a four week experiment in which 24 mice were implanted with 2004 Alzet miniosmotic pumps containing either a vehicle solution, 40 pg/kg/day of human PTH(1-34), or 80 pg/kg/day of human PTH(1-34). There were 8 mice in each experimental group, and all mice were sacrificed at the end of their 2 8th day of treatment.
Table 1. Experimental Design
Time (weeks) 0 2 4 VEH (n = 8) Experiment 1 PTH-40 (n = 8) Sacrifice PTH-80 (n = 8) VEH (n = 6) Experiment 2a PTH-40 (n = 6) Sacrifice PTH-80 (n = 6) PTH-40 (n = 3)
Experiment 2b PTH-80 (n = 3*) Re-surgery Sacrifice
* One PTH-80 infused mouse died 3 weeks into treatment after bleeding on day 21. Her data is included in 2 week BMD and BMC data, but excluded all other data.
The second experiment was primarily a two week experiment in which 24 mice were implanted with 2002 Alzet miniosmotic pumps. Again, the pumps contained either a Vehicle solution, 40 pg/kg/day of human PTH(1-34), or 80 pg/kg/day of
human PTH(1-34). There were 6 mice in the vehicle group, and 9 in each of the PTH groups. 18 of the mice, all 6 controls and 6 mice from each PTH group, were sacrificed at the end of their 14th day of treatment. The 6 remaining mice
were re-implanted with new 2002 Alzet pumps, containing their respective PTH
22 Alzet Osmotic Pumps "How does it work" 4 May 2009,
solutions, on the
15thday of the experiment. These mice continued treatment for
another 13 days at which point they were sacrificed, with total treatment duration
of 28 days.
Procedure
Group Assignment
For both experiments, one day prior to pump implantation, baseline DXA scans
were performed (PIXlmus2; GE Lunar Madison, WI, USA). To ensure that no
experimental group started the treatment period with significantly different
baseline bone parameters, the mice were assigned to their experimental group
only after the baseline scans were analyzed. Total body bone mineral density
(BMD,
g/cm
2)
was
used as the determining parameter.
PTH Preparation
The procedures for pump filling, and implantation were the same for both of the
experiments.
Two days prior to implantation, the mice were weighed, and their average weight
was used to determine the PTH concentrations of the administered solutions:
1
concentration = weight * dose * - eq. (1) r
where weight represents the average weight of all the animals in grams, dose is
the desired dosage of PTH in pg/kg/day, and r represents the dispensation rate
of the pump in pL/day.
Using the determined concentration, the volume of solution required to produce
the desired dosages of PTH was determined.
hPTH(1- 34)
V = hPTH(- 34) eq. (2)
concentration
where Vis the total volume in mL, h34) is the amount of human
PTH(1-34) in mg, and concentration is the previously determined concentration needed
to produce the desired dosage in mg/mL. The composition of the solution was
1% HCI, 2% mouse serum, and 97% saline solution.
The 80 pg/kg/day dosage solution was mixed first. The PTH was dissolved in
90% of the saline required for the solution, and then the required amounts of
mouse serum and HCI were added. The pH of the solution was read by a pH
meter (Corning Model 430 pH meter) and slowly decreased to a pH of 4.0 by adding HCI in 2-5 pL increments. Once the pH was brought to 4.0, the remaining 10% of saline was added. Finally, the solution was sterilized through a filter and deposited into a sterile vial. Pumps were filled according to the manufacturer's guidelines with the 80 pg/kg/day dosage solution and submerged in a vial containing sterile saline.
The amount of remaining 80 pg/kg/day solution was then calculated and diluted to make the 40 pg/kg/day solution. Going from an 80 pg/kg/day solution to a 40 pg/kg/day solution, requires a doubling of the total amount of solution and the addition of no more PTH. Therefore, the amount of HCI, mouse serum, and saline added to the solution was 1%, 2%, and 97% of the remaining solution respectively. The pumps were filled according to the manufacturer's guidelines with the 40 pg/kg/day solution and placed in a vial containing sterile saline.
Finally, the pumps for the control animals were filled with the vehicle solution and placed in a vial containing sterile saline.
The 4 week pumps were filled 48 hours prior to pump implantation, while the 2 week pumps were filled only 24 hours prior to pump implantation, per the
manufacturer's guidelines. Once filled, they were left to prime in a water bath at 370C until implantation.
Pump implantation
All surgical equipment was sterilized, and a sterile surgical field was created. Partial aseptic techniques were used during surgery.
Animals were anesthetized using Isoflurane, and Buprenex (0.1 mg/kg) was administered. The dorsal region of the mouse was shaved to remove fur and hair. The area was cleaned with 70% isopropyl alcohol followed by iodine and then again cleansed with 70% isopropyl alcohol. While pulling the skin away from the body with forceps, a single 5-7 mm transverse incision was made above the scapula. Using homeostats and blunt dissection techniques, a pocket was
created between the subcutaneous skin and outer muscle fascia. The pump was implanted into the created pocket delivery end first. The incision was then
approximated and closed with wound skin clips.
Once surgery was complete, the animals were placed on gauze under a heating lamp where they were allowed to recover. Once consciousness was regained, they were placed back in their cages (4 animals per cage).
There were 6 mice in the second experiment, with two week duration pumps that were treated for a total of 28 days. For these mice, on the 15th day of treatment
the pump was removed, a DXA scan was performed, and subsequently a new pump with the same dose of PTH was implanted. The surgical procedure for the
re-surgery was essentially the same as before, the only difference being the
removal of the original pump. To do this, an incision was made approximately
where the original incision had been made. The pumps were pushed out through
this incision and then, after being scanned, the new pumps were inserted through
this same incision.
Post-Surgery
Post surgical observations were made twice in the first 24 hours. Buprenex (0.1
mg/kg) was administered twice more, approximately 8 hours and 20 hours after
surgery. Post surgical observations continued to be made at least once daily for
5 days post surgery, monitoring the mice for any signs of stress, pain, or
abnormal behavior. Their wound clips were removed after 10 days, and the mice
were monitored for the duration of the experiment.
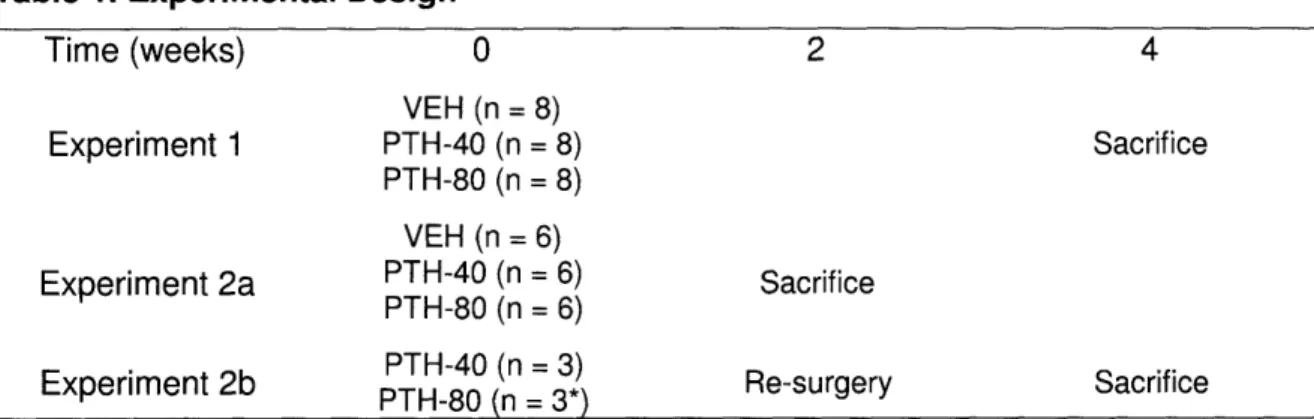
Figure 2. A mouse 7 days after pump implantation. See the shaved area and the wound clips as well as the outline of the pump down the
mouse's left side.
Most animals showed no signs of pain or discomfort, continuing to move around
the cage and eat normally. However, two animals showed signs of distress, one
in the 4 week experiment and one in the two week experiment. They both
excessively scratched the area around the incision and wound clips. One
developed bald patches around both the incision and on her right hind leg. After
consulting the in-house veterinarian, the bald patches were treated daily with
Betadine and a topical antibiotic to keep the area from becoming infected.
The other distressed mouse tore through her skin around the incision, and her
pump became partially exposed. The pump was re-inserted, and the area was
closed with wound clips. Both mice showed signs of improvement and lasted the
full duration of the experiment.
Blood collection by submandicular bleeding
Blood samples of 100-200 pL were collected from all mice at baseline (one day before pump implantation), and after 4, 7, and 14 days. For mice that went to 28 days, blood was also collected at 21 and 28 days. All but terminal blood samples were collected by submandicular bleeding techniques. The mice were
anesthetized using Isoflurane and then bled. At the 4 and 7 day time points, the mice were administered subcutaneous injections of saline (20 ml). Terminal blood samples were collected by cardiac puncture. The serum was separated from whole blood and stored at -800C for the use in biochemical assays.
Total body BMD and BMC by DXA
Total body bone mineral density (BMD, g/cm2) and bone mineral content (BMC, g) were measured using dual-energy x-ray absorptiometry (DXA) at baseline and end of the study (PIXImus2, GE Lunar Cop., Madison, WI, USA).23 24 Terminal scans were performed after sacrifice and pump removal. Additionally, as
previously mentioned, the 6 mice that had new pumps put in at 2 weeks also had a DXA scan performed between the removal of the old pump and the insertion of the new pump. In order to perform the scans, the mice were briefly anesthetized using Isoflorene and placed on the platform of the PIXImus2. Due to the metal in the implanted pump, obtaining midpoint DXA scans for the other animals was impossible. The machine was calibrated with the manufacturer's phantom prior to scanning the mice.
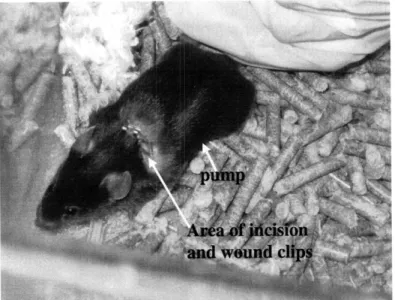
Figure 3. Image of PIXImus2 evaluation. Can see the outline of the skeleton. Skeleton inside the
rectangle and outside the oval is included in the evaluation of BMD and BMC.
23 Nagy TR, Clair AL 2000 Precision and accuracy of dual-energy X-ray absorptiometry for
determining in vivo body composition of mice. Obesity Reseach 8:392-398.
24 lida-Klein A, Lu SS, Yokayama K, Dempster DW, Nieves J, Lindsay R 2003 Precision,
accuracy, and reproducibility of dual X-ray absorptiometry measurements in mice in vivo. Journal of Clinical Densitometry 6:25-33.
The scans from the PlXlmus2 were used to measure bone mineral density (BMD, g/cm2) and bone mineral content (BMC, g). They were analyzed using the GE Lunar PlXlmus2 software. The whole body, except for the head, was included in the manually defined area of interest (Figure 3).
Bone architecture by pCT
After terminal DXA scans were performed, the fifth lumbar vertebral body (L5), right femur, and left femur were dissected and cleaned of soft tissue. The right femurs were placed in 70% ethanol to preserve them for histology, while both the L5 vertebrae and left femur were wrapped in saline soaked gauze and frozen in order to preserve them for pCT scanning and future mechanical testing.
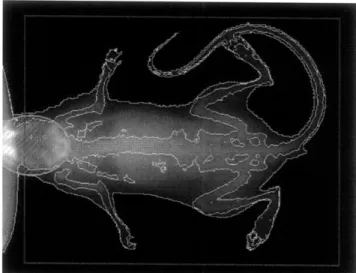
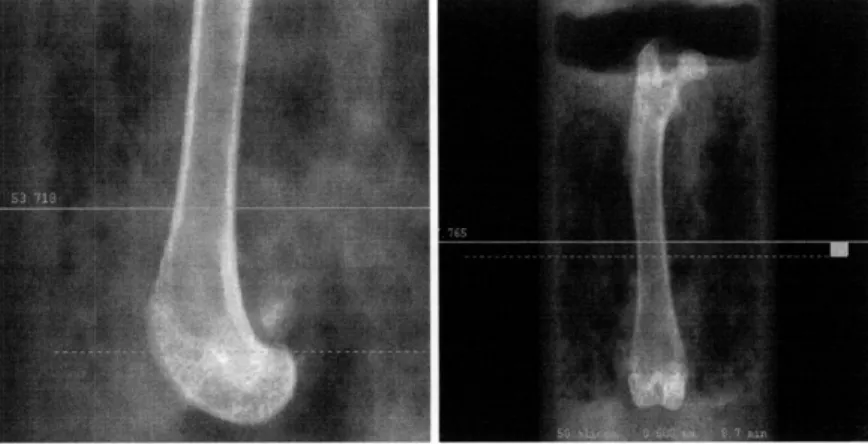
Figure 4. 2D
pCT
images showing the regions of the femur that were scanned and subsequently evaluated. Distal femur shown on the left, femoral midshaft shown on the right.Trabecular and cortical bone architecture was assessed using a high resolution desktop tomographic imaging system (pCT40, Scanco Medical AG, Basserdorf Switzerland). Trabecular bone architecture was assessed for the L5vertebrae as well as the distal femur, and the cortical bone morphology was evaluated at the femoral midshaft. CT images were reconstructed in 1024 x 1024 -pixel matricies
and stored in 3-D arrays. The resulting grayscale images were segmented using a constrained Guassian filter (sigma = 0.8, support = 1) to remove noise, and an image specific threshold determined by an adaptive-iterative algorithm,25,2 6,27 was used to extract the structure of the mineralized tissue.
25 Ridler T, Calard S 1978 Picture thresholding using an iterative selection method. IEEE
Transactions on System, Man and Cybernetics. SMC-8:630-632.
26 Meinel L, Fajardo R, Hofmann S, Langer R, Chen J, Snyder B, Vunjak-Novakovic G, Kaplan D 2005 Silk implants for the healing of critical size bone defects. Bone 37:688-698.
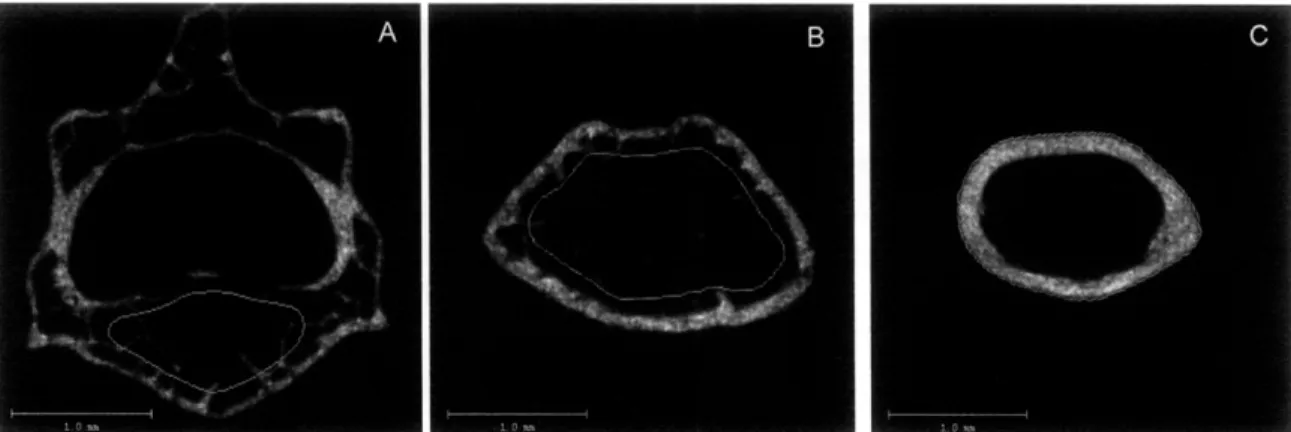
For the vertebrae, transverse CT slices (12 pm isotropic voxel size) were acquired for the entire vertebral body. The trabecular bone region within the vertebral body, excluding the superior and inferior endplates, was manually identified (Figure 5A). For the distal femur, 204 transverse CT slices were
acquired starting at the tip of the growth plate and extending 2500 pm proximally (Figure 4). The region of evaluated slices began at the tip of the growth plate and extended to ~ 1800 pm above the growth plate. The region of interest, trabecular bone excluding the primary spongiosa, was manually identified and outlined on each CT slice (Figure 5B). Parameters including bone volume fraction (BV/TV, %), trabecular thickness (Tb.Th, pm), trabecular number (Tb.N, mm-1), trabecular separation (Tb.Sp, pm), structural model index (SMI), and connectivity density (ConnDens, mm-3) were computed.
The cortical bone architecture was determined from the femoral midshaft, at which 50 transverse CT slices were obtained (Figure 4). Again, the region of interest was manually identified on each CT slice (Figure 5C). Measured
parameters included total cross-sectional area (TA, mm2), cortical bone area (BA,
mm2), medullary area (MA, mm2), cortical thickness (CortTh, pm), and bone area fraction (BA/TA, %).
Figure 5. 2D pCT images showing the regions of trabecular bone evaluation in the L5 vertebrae (A) and the distal femur (B), and the region of cortical bone evaluation in the femoral midshaft (C).
Blood serum calcium measurement
Total serum calcium was determined in duplicate by the QuantiChromTM Calcium Assay Kit (DICA-500). The kit uses a phenolsulphonephthalein dye which turns a very stable blue color when binds specifically with free calcium. When read at 612 nm, the optical density is directly proportional to the calcium concentration of the sample.
27 Rajagopalan S, Lu L, Yaszemski MJ, Robb RA 2005 Optimal segmentation of microcomputed
tomographic images of porous tissue-engineering scaffolds. Journal of Biomedical Materials Research Part A 75:877-887.
Mice were chosen at random from each of the 6 groups (VEH, PTH-40, and
PTH-80 from both the 2 week and 4 week studies). Serum from days 4, 7, 14 and
28 (n = 2, 4, 4, 6 from each group respectively) were included in the evaluation.
The optical densities of the samples were read at
610
nm (VMax Kinetic
Microplate Reader, Molecular Devices, Sunnyvale, CA, USA). Calculation of the
serum calcium levels was done according to manufacturer instructions. After
determining that there was no statistically significant difference between the
serum calcium levels at any single time point between mice with the same PTH
dosage from the 2 and 4 week studies, the groups of the same time point and
dosage were combined.
Data
analysis
Standard descriptive statistics were computed. ANOVA was used to assess the
effect of PTH dose on skeletal composition. Posthoc testing was performed using
Fisher's protected least squares difference (PLSD). All tests were two-tailed, with
differences considered significant at p < 0.05. Data are presented as mean ± SE,
unless otherwise noted.
Results
Total body BMD and BMC by DXA
At baseline (10 or 11 weeks of age) there were no significant differences in either
total body BMD or BMC between PTH infused groups and the control groups in
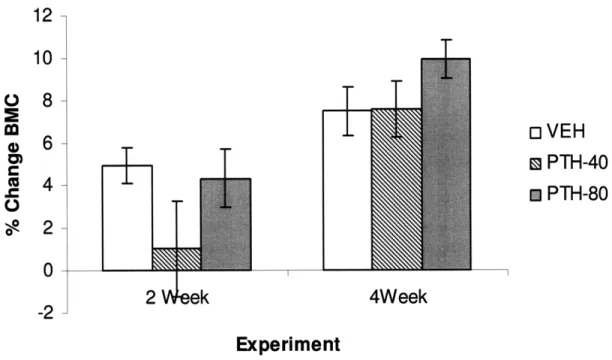
the two or four week duration studies. After two weeks of infusion, BMC tended
to increase less in PTH-40 mice than in VEH and PTH-80 mice, although this
difference did not become significant (p = 0.15 versus control, Table 2, Figure 6).
After four weeks of PTH infusion, BMC tended to increase more in PTH-80 mice
than in either VEH or PTH-40 mice, but also did not reach significance (p = 0.14
versus control, Table 2, Figure 6). Changes in BMD after two and four weeks
exposure to continuous PTH were also similar in all groups, any apparent
increases occurring due to growth of the animals and their normal corresponding
gain of cortical bone (Table 2).
m c 2 Veek
±
oVEH
m
PTH-40
m
PTH-80
4WeekExperiment
Figure 6. Percent change in total body BMC after 2 and 4 weeks of exposure to continuous PTH.
Table 2. Effects of continuous infusions of hPTH(1-34) on Total Body BMC and BMD assessed by DXA VEH (n = 6) 2 Week* PTH-40 (n = 9) PTH-80 (n = 9) VEH (n = 8) 4 Week* PTH-40 (n = 8) Baseline 0.339 ± 0.005 0.336 ± 0.011 0.332 + 0.009 0.336 + 0.010 0.336 + 0.009 0.335 ± 0.008
BMC Terminal 0.356 ± 0.006a 0.339 ± 0.012 0.346 + 0.010a 0.362 + 0.01 la 0.361 ± 0.008a
0.368 + 0.008a %Change** 4.931 ± 0.834 1.045 ± 2.256 4.330 + 1.355 7.472 ± 1.159 7.560 + 1.303 9.914 ± 0.878
Baseline 0.045 + 0.001 0.045 ± 0.001 0.045 ± 0.001 0.045 ± 0.001 0.044 + 0.0005 0.045 + 0.001
BMD
(g/cm2) Terminal 0.0470 ± 0.001a 0.046 ± 0.001 0.047 ± 0.001 0.046 ± 0.001 a 0.046 ± 0.001 a 0.045 ± .0005a
%Change** 3.504 ± 1.239 1.345 ± 1.456 2.602 ± 1.501 2.169 ± 0.633 2.623 ± 0.978 3.402 ± 1.107 PTH-80
(n = 8)
uata are reported as mean ± SE.
* 2 week data is from the 2 week time point
only. for all animals in the 2002 pump, 2 week study. 4 week data is from the 2004 pump, 4 week study,
** %Change = (Terminal - Baseline)/Baseline x 100.
ap < 0.05 between baseline and terminal value of a particular group as determined by an unpaired t-test.
No significant differences between experimental groups as determined by ANOVA. Differences considered significant at p < 0.05. BMC, bone mineral content; BMD, bone mineral density.
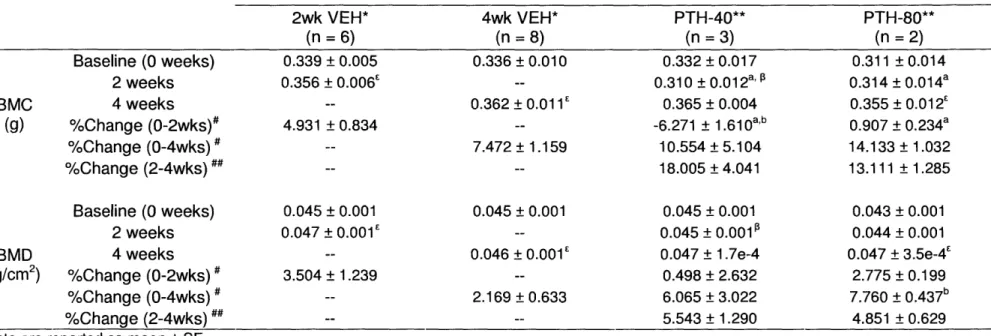
infusions of hPTH(1-34) on Total Body BMC and BMD assessed by DXA for re-surgery mice BMC (g) Baseline (0 weeks) 2 weeks 4 weeks %Change (0-2wks)# %Change (0-4wks) %Change (2-4wks) ## Baseline (0 weeks) 2 weeks BMD 4 weeks (g/cm2) %Change (0-2wks) %Change (0-4wks) %Change (2-4wks) ##
Data are reported as mean ± SE.
* VEH data at the 2 week time point is
4 week, 2004 pump, experiment.
2wk VEH* (n =6) 0.339 + 0.005 0.356 + 0.006E 4.931 + 0.834 0.045 + 0.001 0.047 + 0.001E 3.504 + 1.239 4wk VEH* (n =8) 0.336 + 0.010 0.362 + 0.011' 7.472 ± 1.159 0.045 ± 0.001 0.046 + 0.001E 2.169 + 0.633 PTH-40** (n =3) 0.332 + 0.017 0.310 + 0.012a,' P 0.365 + 0.004 -6.271 + 1.610 a b 10.554 ± 5.104 18.005 ± 4.041 0.045 + 0.001 0.045 ± 0.001 0.047 ± 1.7e-4 0.498 + 2.632 6.065 + 3.022 5.543 ± 1.290 PTH-80** (n =2) 0.311 + 0.014 0.314 ± 0.014a 0.355 + 0.012' 0.907 + 0.234a 14.133 ± 1.032 13.111 ± 1.285 0.043 ± 0.001 0.044 ± 0.001 0.047 + 3.5e-4' 2.775 ± 0.199 7.760 + 0.437b 4.851 ± 0.629 taken from the 2 week, 2002 pump, experiment; n = 6. VEH data at the 4 week time point is taken from the ** Mice in these groups were had a second surgery after two weeks of treatment to implant a new 2002 model pump.
# %Change = (Terminal - Baseline)/Baseline x 100. ## %Change = (4 weeks - 2 weeks)/(2 weeks) x 100.
a p < 0.05 for PTH vs. VEH, determined by ANOVA bp < 0.05 for PTH-40 vs. PTH-80, determined by ANOVA.
Ep < 0.05 between baseline and time-point values of a particular group as determined by an unpaired t-test. p < 0.05 between 2wk and 4wk values of a particular group as determined by an unpaired t-test.
BMC, bone mineral content; BMD, bone mineral density.
0.39 0.37 0.35 - -" 3 ,---- VEH (2wk) 0.33 03 -- m-- VEH (4wk) - - - - PTH-40 0.29 0.27 0.25 0 1 2 3 4 5
Time of Measurement (weeks)
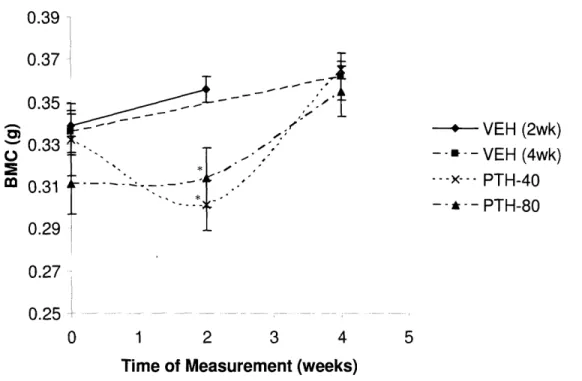
Figure 7. BMC (g) of the re-surgery group at the 0, 2, and 4 week time points. VEH (2wk) data from the 2 week, 2002 pump, VEH group. VEH (4wk) data from the 4 week, 2004 pump, group.
* p < 0.05 as compared to VEH, determined from ANOVA.
At two weeks, the re-surgery PTH-40 and PTH-80 mice had lower than usual BMCs as compared with the rest of their groups at two weeks, and thus their BMCs were significantly lower than the VEH-treated group at this time point (p =
.005 and .02 respectively as compared to VEH, Table 3, Figure 7). Not only did the PTH-40 group's BMC increase less than that of the VEH mice, but their BMC actually decreased after the first two weeks of treatment (Figure 7). After four weeks of PTH infusion, both PTH groups' BMC had recovered to that of the VEH, the PTH-40 and PTH-80 mice increasing their BMC by 18.055 ± 4.041 % and
13.111 ± 1.285 % respectively (Table 3, Figure 7).
As with their BMC measurements, the BMD response in the PTH re-surgery groups was also very different after two and four weeks of treatment. Most of the
PTH groups' BMD change occurred over the second two weeks of treatment; PTH-40 mice BMD increased approximately 10 times as much during the second two weeks of treatment while the PTH-80 mice gained 2 times as much during the latter part of the experiment (Table 3). BMD values never reached significant
Trabecular bone microarchitecture by
pCT
After two weeks of treatment, the trabecular bone microarchitecture in both the L5 vertebrae and the distal femur of the PTH groups did not differ from the vehicle group (Table 4, Figure 8A-B). Similarly, there were no significant differences between the PTH-40 and PTH-80 groups after two weeks, nor were there any trends towards significance in any of the other measured parameters (Table 4).
121 B OVEH * PTH-40 a PTH-80 2 Week 4 Week Experiment o VEH * PTH-40 * PTH-80 2 Week 4 Week Experiment Figure 8. Trabecular BV/TV (%) for L5 (A) and distal femur
durations of 2 and 4 weeks (mean ± SE). (B) in VEH and PTH treated mice for
Figure 9. 3D images showing the trabecular microarchitecture of the L5 vertebrae by pCT
analysis. A, B and C are VEH, PTH-40, and PTH-80 vertebrae, respectively, from the 2 week study. D, E, and F are VEH, PTH-40, and PTH-80 vertebrae, respectively, from the 4 week
duration study.
After four weeks of treatment, trabecular number was about 7% lower and trabecular separation was about 8% higher in the L5vertebrae of the PTH-80
25.5-25 24.5 S24 23.5 23 22.5 22
infused mice versus both VEH and PTH-40 treated (p = .03 and 0.03 respectively versus VEH, p = 0.02 and 0.02 versus PTH-40, Table 5, Figure 9D-F). In the distal femur trabecular BV/TV did not differ among the groups. However, trabecular thickness tended to be higher in both PTH infused groups as
compared to VEH treated mice, although this did not reach significance ( +4.3%, p = 0.087 and 0.064 for PTH-40 and PTH-80 versus VEH respectively, Figure
10E-F). As after two weeks of treatment, the BV/TVs of the three groups were relatively the same (Table 4, Figure 8A-B).
A B C
D E F
Figure 10. 3D images showing the trabecular microarchitecture of the distal femur by CT
analysis. A, B and C are VEH, PTH-40, and PTH-80 femurs, respectively, from the 2 week study. D, E, and F are VEH, PTH-40, and PTH-80 femurs, respectively, from the 4 week duration study.
In the pilot, re-surgery experiment (measurements taken after four weeks) trabecular bone volume and architecture tended to be worse in PTH-40 infused
mice than in either PTH-80 or vehicle infused mice. In the L5 vertebrae, the
BV/TV of the PTH-40 group was significantly lower than the PTH-80 group but only tended to be lower than the control group (p = 0.031 and 0.15 respectively, Table 5). Conversely, the BV/TV in the L5 of the PTH-80 mice tended to be higher than that of the control mice (p = 0.15, Table 5). Additionally, the SMI of the PTH-40 mice was significantly higher than those of the control and PTH-80 groups, indicating a more rod-like structure of the trabeculi (+26.4%, p = 0.023 and +37.2%, p = 0.019 respectively, Table 5) Trabecular number and
connectivity density in the L5 also tended to be lower for PTH-40 compared to both vehicle and PTH-80 (Table 5).
The trabecular microarcitecture differences were less apparent in the distal femur of the re-surgery group. There tended to be fewer trabeculi and consequently a
higher trabecular separation in the PTH-40 mice compared with the control (p = 0.14 and 0.15 respectively, Table 5). SMI and BV/TV did not differ among groups.
Table 4. Bone microarchitecture at the L5 lumbar spine, distal femur, and midfemur assessed by pCT 2 Week* 4 Week* VEH PTH-40 PTH-80 VEH PTH-40 PTH-80 (n =6) (n =6) (n =6) (n =8) (n = 8) (n =8) L5 vertebrae: trabecular BV/TV (%) 24.36 + 0.66 24.31 + 0.28 24.35 + 0.30 24.07 + 0.49 23.85 ± 0.60 23.70 + 0.63 Tb.N (mm -1) 4.562 + 0.09 4.519 + 0.09 4.519 + 0.035 4.515 + 0.08 4.532 + 0.09# 4.223 ± 0.09 ** Tb.Th (pm) 55.10 ± 0.7 54.97 ± 0.4 55.02 ± 0.3 55.45 ± 0.7 55.04 ± 0.3 56.00 ± 0.3 Tb.Sp (pm) 215.68 ± 5.2 215.73 ± 3.5 214.48 ± 1.7 216.80 ± 4.6 215.34 ± 5.9# 235.11 ± 6.3** ConnD (1/mm 3) 146.59 ± 4.6 146.53 ± 7.4 150.492 ± 4.5 141.89 ± 5.1 145.94 ± 4.7 147.75 ± 8.5 SMI 0.839 ± 0.08 0.911 ± 0.05 0.881 ± 0.05 0.869 ± 0.07 0.914 ± 0.08 0.887 ± 0.05 Distal femur: trabecular
BV/TV (%) 9.097 ± 0.48 9.145 ± 0.63 8.923 ± 0.31 7.550 ± 0.36 7.603 ± 0.40 7.128 ± 0.29 Tb.N (mm -') 3.759 ± 0.10 3.840 ± 0.10 3.805 ± 0.03 3.435 ± 0.08 3.347 ± 0.11 3.312 ± 0.09 Tb.Th (pm) 52.93 + 1.4 51.28 ± 1.3 51.52 + 0.6 51.64 ± 0.7 53.37 ± 0.69 53.52 ± 0.6 Tb.Sp (pm) 266.10 ± 8.5 259.18 ± 6.9 259.90 ± 2.2 292.07 ± 7.3 301.68 ± 10.9 303.16 + 8.5 ConnD (1/mm 3) 48.55 + 5.2 53.12 + 5.9 44.23 ± 1.8 32.31 ± 3.8 34.52 ± 1.8 32.42 ± 3.5 SMI 3.100 ± 0.07 3.065 ± 0.09 3.135 ± 0.06 3.290 ± 0.07 3.253 ± 0.06 3.299 ± 0.07 Midfemoral: cortical TA(mm2) 1.615 ± 0.03 1.527 ± 0.07 1.612 ± 0.01 1.570 ± 0.03 1.591 ± 0.03 1.611 ± 0.03 BA (mm 2) 0.638 ± 0.01 0.591 ± 0.03 0.635 ± 0.01 0.628 ± 0.01 0.632 ± 0.02 0.638 ± 0.01 MA (mm 2) 0.997 ± 0.03 0.936 ± 0.04 0.977 ± 0.01 0.943 ± 0.02 0.960 ± 0.03 0.973 ± 0.02 BA/TA (%) 39.56 ± 0.50 38.66 ± 0.79 39.39 ± 0.55 40.01 ± 0.65 39.74 ± 0.84 39.63 ± 0.43 Cort.Th (pm) 155.00 ± 1.1 148.67 ± 4.5 155.50 ± 2.2 156.37 ± 2.9 156.25 ± 3.3 156.50 ± 1.3
Data are reported as mean ± SE.
*Showing data from the 2002 pump, 2 week, group and the 2004 pump, 4 week group; no re-surgery group data is reported here.
**p < 0.05 for PTH vs. VEH within experiment (2 or 4 week), determined by ANOVA. Sp < 0.05 for PTH-40 vs. PTH-80 within experiment (2 or 4 week), determined by ANOVA.
BV/TV, bone volume/tissue volume; Tb.N, trabecular number; Tb.Th, trabecular thickness; Tb.Sp, trabecular separation; ConnD, connectivity
Table 5. Bone microarchitecture at the L5 lumbar spine, distal femur, and midfemur assessed by pCT for mice who had
pump replaced at 2 weeks.
4 Week * 4 Week, Re-surgery*
VEH PTH-40 PTH-80 (n =8) (n =3) (n =2) L5 vertebrae: trabecular BV/TV (%) 24.07 + 0.49 22.43 ± 0.71# 25.95 ± 1.91 Tb.N (mm1) 4.515 + 0.08 4.248 ± 0.183 4.662 ± 0.317 Tb.Th (pm) 55.45 ± 0.7 55.93 + 0.90 56.10 + 0.10 Tb.Sp (pm) 216.80 ± 4.6 229.87 + 13.43 210.80 + 13.80 ConnD (1/mm 3) 141.89 ± 5.1 131.50 + 7.38 159.93 + 32.01 SMI 0.869 ± 0.07 1.181 ± 0.035**# 0.742 ± 0.096
Distal femur: trabecular
BV/TV (%) 7.550 ± 0.36 6.370 + 0.011 7.100 ± 0.010 Tb.N (mm-1) 3.435 ± 0.08 3.2000 + 0.094 3.411 ± 0.140 Tb.Th (pm) 51.64 ± 0.7 52.57 ± 1.42 51.30 ± 1.70 Tb.Sp (pm) 292.07 ± 7.3 312.87 + 9.12 295.20 ± 12.00 ConnD (1/mm 3) 32.31 + 3.8 26.02 ± 3.58 33.88 ± 1.21 SMI 3.290 ± 0.07 3.409 ± 0.075 3.329 ± 0.113 Midfemoral: cortical TA(mm2) 1.570 ± 0.03 1.566 ± 0.019 1.564 ± 0.053 BA (mm2) 0.628 ± 0.01 0.627 ± 0.003 0.654 ± 0.030 MA (mm2) 0.943 ± 0.02 0.939 ± 0.021 0.910 ± 0.022 BA/TA (%) 40.01 ± 0.65 40.05 ± 0.62 41.80 ± 0.53 Cort.Th (pm) 156.37 ± 2.9 156.67 ± 1.9 163.50 ± 3.5
Data are reported as mean ± SE.
* VEH data from the 2004 pump, 4 week group. PTH data from the 2002 pump, 4 week, re-surgery group.
**p < 0.05 for PTH vs. VEH, determined by ANOVA.
*p < 0.05 for PTH-40 vs. PTH-80, determined by ANOVA.
BV/TV, bone volume/tissue volume; Tb.N, trabecular number; Tb.Th, trabecular thickness; Tb.Sp, trabecular separation; ConnD, connectivity density; SMI, structure model index; TA, total area; BA, bone area; MA, medullary area; Cort.Th, cortical thickness.
Femoral cortical bone microarchitecture by
pCT
In the two week experiment, cortical bone affects were observed only in the PTH-80 group. Although parameters did not reach significant differences, mid-femoral total cross sectional-area (p = 0.14, p = 0.15 versus VEH and PTH-80
respectively), cortical bone area (p = 0.06, p = 0.08 versus VEH and PTH-80 respectively) tended to be smaller in the PTH-40 infused mice as compared to both the vehicle and PTH-80 groups (Table 4). Additionally, the cortical thickness generally lower than vehicle and PTH-80 mice (p = 0.13, p = 0.10 versus VEH
and PTH-80 respectively, Table 4, Figure 11A-C, Figure 12).
165
--'7
oVEHB PTH-40
* PTH-80
Figure 11. Mean values for
midfemoral cortical
thickness (pm) in VEH and PTH treated mice after treatment durations of 2 and 4 weeks.
2 Week 4Week
Experiment
Figure 12. 2D images showing the midfemoral cortical bone microarchitecture by pCT analysis. A, B and C are VEH, PTH-40, and PTH-80 femurs respectively from the 2 week study. D, E, and
F areVEH, PTH-40, and PTH-80 femurs respectively from the 4 week duration study. E 160-S155 E . 150 - I-"R 145-S 140-135 1 ----I
In contrast, by four weeks of treatment, any trends that had been seen at two
weeks were no longer apparent. All measured cortical bone parameters were
similar across all experimental groups (Table 4).
As with the previous four week experiment, the re-surgery, 4 week experiment
also showed no dose dependent PTH response in the cortical bone. Likewise, all
Serum calcium
At baseline, there were no significant differences among group in serum Ca. Serum Ca remained relatively constant within each experimental group over the duration of the experiment (Table 6, Figure 13). After 2 weeks of infusion,
PTH-40 mice had significantly lower serum calcium levels as compared with PTH-80 (-14%, p = 0.038). However, there were no other significant changes over time (Table 6, Figure 13).
Table 6. Blood serum calcium measurements (mg/dL)
Day VEH PTH-40 PTH-80 Measured 4 (n = 4) 11.727 ± 0.350 12.270 ± 0.833 11.651 ± 0.711 7 (n = 8) 10.331 ± 0.336 10.442 ± 0.534 10.999 ± 0.132 14 (n = 8) 11.918 + 0.414 10.504 + 0.622* 12.230 ± 0.594 28 (n = 6) 13.229 ± 0.251 12.904 + 0.397 13.297 ± 0.403
Data is reported as mean ± SE.
n = 4, 8, 8, 6 for days 4, 7, 14 ,and 28 respectively. Mice were randomly chosen from each of the 2 experiments (2 weeks and 4 weeks). After determining that there was no significant difference between the blood at the same time point from the different experiments, the mice from each time point were combined into a single group yielding these n values.
*p < 0.05 for PTH-40 vs. PTH-80, determined by ANOVA.
16 14 -12 -10 8- 6-o VEH Es PTH-40 * PTH-80 4 7 14 28 Day
Figure 13. Blood serum calcium levels at 4 time points. Mice were randomly selected from each of the 2 (re-surgery mice included) and 4 week experiments. After showing no significant differences between experimental groups across the different experiments at a given time point, data from all experiments were combined to yield this data (n = 4, 8, 8, 6 for day 4, 7, 14 and 28 respectively) * p < 0.05 versus PTH-80. Represented as mean ± SE.
Discussion
This experiment sought to develop a model of secondary hyperparathyroidism in mice and subsequently examine the skeletal consequences of continuous, high dose PTH. In PTH-treated mice we expected to see a catabolic effect in the cortical bone, relatively preserved trabecular bone microarchitecture, and an overall decrease in total body BMC and BMD. However, whereas we observed
relative preservation of trabecular bone, there were no deleterious effects in cortical bone at either 2 or 4 weeks of treatment. Similarly, there seemed to be
little dose dependency, as neither PTH group, 40 pg/kg/day nor 80 pg/kg/day, induced the expected catabolic response to PTH in cortical bone.
Both BMC and BMD showed no significant response to PTH infusion of either dose after 2 or 4 weeks of treatment (Table 2). Although BMC did tend to
increase less during two weeks of treatment in the PTH-40 infused mice as compared with both VEH and PTH-80, it was clearly very variable across the entire group with a standard error twice that of the average change (PTH-40 %Change BMC = 1.045 ± 2.256 % at 2 weeks). Additionally, one would expect that after four weeks of treatment, any catabolic response apparent after two weeks of treatment would have increased. However, after four weeks of
treatment, and trend supporting a catabolic response in PTH infused mice had disappeared.
The lack of PTH effect on cortical bone is further supported by the evaluation of its microarcitecture. Although PTH-40 treated mice showed smaller midfemoral cross-sectional area and bone area, as well as thinner cortical thickness as compared to both the VEH and PTH-80 treated mice at two weeks, the
differences were not significant, nor did they reach significance after four weeks of treatment (Table 3). Rather, by four weeks of treatment, these parameters were indicating that there was little cortical bone degradation as a product of PTH
infusion.
Longitudinal BMC and BMD data were only available for the re-surgery PTH infused groups. While the data seems to support the notion that there is a
difference in response during the first two weeks of treatment as compared to the second two weeks of treatment, it must be considered that the sample sizes for
each group were very small (n = 3 and 2 for PTH-40 and PTH-80 respectively). Additionally, although the re-surgery mice's data happened to be significant at two weeks, there were no significant differences in the BMC, BMD and their
respective %changes of the PTH-groups in the two week experiment as a whole, in which the re-surgery mice were included. Therefore, although BMC
measurements of the re-surgery group suggest that a two week duration PTH-40 infusion better supports a model of secondary hyperparathyroidism than a 4 week duration infusion, one cannot conclude anything due to the sample size.
and four weeks of infusion by conduction a re-surgery experiment with larger sample sizes.
Unlike cortical bone parameters which tended towards significance after two weeks, trabecular bone microarchitecture exhibited trends towards significance
after four weeks of treatment. Additionally, as opposed to seeing effects in the PTH-40 infused group, the effect was more clearly established in the PTH-80 infused group, with a significant decrease in trabecular number and
corresponding increase in trabecular separation in the vertebrae as compared to both VEH and PTH-40 treated mice. As expected, trabecular microarchitecture in the distal femur was preserved.
Not only do patients suffering from secondary hyperparathyroidism experience cortical bone loss, as indicated by their lower than normal BMC and BMD, which we did not observe in this study, they also typically experience high levels of blood serum calcium. Due to the fact that PTH is secreted in response to a low serum calcium level in order to restore it to normal, we expected that continuous elevated PTH would cause a corresponding elevated serum calcium level. Therefore, high serum calcium would be an indication that PTH levels were successfully increased in the mice. However, blood serum is generally well regulated, and there are reported cases of hyperparathyroidism in which calcium levels remain normal.28 In order to better ascertain that the mice did in fact exhibit elevated levels of PTH, serum phosphorus measurements should be taken. A decrease in serum phosphorus would be a good biochemical indication that the mice were responding to an elevated PTH level. (These assays are currently being conducted).
Although lida-Klein et al. also showed no effect of PTH infusion on cortical bone, our results differ from theirs in that they demonstrated a catabolic effect on trabecular architecture in mouse bone after infusion of a 40 pg/kg/day PTH dosage for two weeks through a significant decrease in trabecular connectivity density. Additionally, they shared that PTH infusion induced hypercalcemia after two weeks with a 35% increase in serum calcium, whereas this study saw no
effect on serum calcium at any measured time-point. Typical cause for concern in serum calcium levels is designated at 1 mg/dL above the upper limits of normal,29 about 10.3 mg/dL,30 constituting only a 10% increase. An increase of 35% in serum calcium would put it at a non-physiologic level. This difference could be accounted for in the fact that they measured serum total calcium, whereas we measured free (ionized) calcium. It is believed that ionized calcium
measurements are more meaningful than total calcium measurements because
28 Bilezikian JP, Khan AA, Potts JT et
al. 2009.
29 Bilezikian JP, Khan AA, Potts JT et al. 2009.
30 Ladenson JH, Bowers GN Jr 1973 Free Calcium in Serum. II. Rigor of Homeostatic Control,
Correlations with Total Serum Calcium, and Review of Data on Patients with Disturbed Calcium
the ionized calcium is the portion of serum calcium free to interact with its
surroundings.3 1
One explanation as to why no clear catabolic effect was seen in PTH infused mice is because the skeletal response to PTH infusion is sensitive to estrogen levels in both rats and mice.3 2 33 These studies strongly suggest that when delivered to estrogen replete animals, continuous infusion of PTH was reported to be anabolic to bone, as evidenced by restoration of both BMD and femoral
neck loading strength. Since our mice were not ovariectomized, it is possible that their endogenous estrogen levels shielded the bone from PTH's catabolic effects.
It would be interesting to repeat the experiment with ovariectomized, thus
estrogen deficient, mice to see if the results then show a viable model in mice for secondary hyperparathyroidism. Similarly, vitamin D deficiency is also known to
be a cause of secondary hyperparathyroidism and induce bone loss.34 Therefore,
the relationship that vitamin D plays should also be further investigated to determine if this might have limited the catabolic action of continuous PTH
infusion.
Another reason as to why no catabolic effect was seen in the bone of the PTH infused mice could be that the catabolic action was not occurring at the distal and midfemoral portions of the bone. Rather, it was occurring in regions of the bone that we were unable to measure by pCT or DXA. Effects in other sections of the
bone could be identified through histomorphometry.
Clearly, there is more work to be done to develop an animal model for secondary hyperparathyroidism. Although we showed a preservation of trabecular bone microachitecture, there was no evidence of the expected catabolic effect on cortical bone. The data presented supports the notion that catabolic effects seen clinically are not caused only by elevated levels of PTH, but by many other endogenous factors as well such as estrogen and vitamin D. In the future these factors and their relationship to PTH and bone loss will need to be further
assessed. Additionally, other models of secondary hyperparathyroidism that may be more reproducible include low calcium diet, which has been shown to
increase PTH and induce both trabecular and cortical bone loss,3 5 and
parathyroid targeted overexpression of the cyclin D1 oncogene, which has been
31 Forman DT, Lorenzo L 1991 Ionized calcium: its significance and clinical usefulness. Annals of
Clinical and Laboratory Science 21(5): 297-304.
32 Shen V, Birchman R, Wu DD, Lindsay R 2000.
33 Masiukiewicz US, Mitnick M, Grey AB, Insogna KL 2000 Estrogen modulates parathyroid
hormone-induced interleukin-6 production in vivo and in vitro. Endocrinology 141(7):2526-2531.
34 Raisz LG 2005.
35 Pierroz DD, Rufo A, Bianchi EN, Glatt V, Capulli M, Rucci N, Cavat F, Rizzoli R, Teti A,
Bouxsein ML, Ferrari SL 2009 Beta-Arrestin2 regulates RANKL and ephrins gene expression in response to bone remodeling in mice. Journal of Bone and Mineral Research. 24(5):775-784.
shown to exhibit biochemical hyperparathyroidism and bone abnormalities,36
should also be further investigated.
36 Imanishi Y, Hosokawa Y, Yoshimoto K, Schipani E, Mallya S, Papanikolaou A, Kifor O, Tokura
T, Sablosky M, Ledgard F, Gronowicz G, Wang TC, Schmidt EV, Hall C, Brown EM, Bronson R, Arnold A 2001 Primary hyperparathyroidism caused by parathyroid-targeted overexpression of