HAL Id: insu-01808648
https://hal-insu.archives-ouvertes.fr/insu-01808648
Submitted on 5 Jun 2018
HAL is a multi-disciplinary open access
archive for the deposit and dissemination of
sci-entific research documents, whether they are
pub-lished or not. The documents may come from
teaching and research institutions in France or
abroad, or from public or private research centers.
L’archive ouverte pluridisciplinaire HAL, est
destinée au dépôt et à la diffusion de documents
scientifiques de niveau recherche, publiés ou non,
émanant des établissements d’enseignement et de
recherche français ou étrangers, des laboratoires
publics ou privés.
Organic Aerosols in the Presence of CO2 in the Early
Earth and Exoplanets: UV–Vis Refractive Indices of
Oxidized Tholins
Lisseth Gavilan, Laurent Broch, Nathalie Carrasco, Benjamin Fleury, Ludovic
Vettier
To cite this version:
Lisseth Gavilan, Laurent Broch, Nathalie Carrasco, Benjamin Fleury, Ludovic Vettier.
Organic
Aerosols in the Presence of CO2 in the Early Earth and Exoplanets: UV–Vis Refractive Indices
of Oxidized Tholins. The Astrophysical journal letters, Bristol : IOP Publishing, 2017, 848 (1), pp.L5.
�10.3847/2041-8213/aa8cc4�. �insu-01808648�
ORGANIC AEROSOLS IN THE PRESENCE OF CO2IN THE EARLY EARTH AND EXOPLANETS:
UV-VIS-NIR REFRACTIVE INDICES OF OXIDIZED THOLINS
Lisseth Gavilan,1 Laurent Broch,2Nathalie Carrasco,1 Benjamin Fleury,3 and Ludovic Vettier1
1LATMOS, Universit´e Versailles St Quentin, UPMC Universit´e Paris 06, CNRS, 11 blvd d’Alembert, 78280 Guyancourt, France 2LCP-A2MC, Institut Jean Barriol, Universit´e de Lorraine, Metz, France
3Jet Propulsion Laboratory, California Institute of Technology, Pasadena, CA 91109, USA
ABSTRACT
The goal of this experimental study is to investigate how the presence of atmospheric CO2 affects
the optical properties of organic photochemical aerosols. To this end, we add CO2 to a N2:CH4 gas
mixture used in a plasma typically used for Titan studies. We produce organic thin films (tholins) in plasmas where the CO2 / CH4 ratio is increased from 0 to 4. We measure these films via spectrometric
ellipsometry in the ultraviolet, visible and near-infrared (270 nm to 2 µm). The ellipsometry parameters are fitted with a Tauc-Lorentz model used for optically transparent materials, to obtain the thickness of the thin film, its optical band gap, and the refractive indices. According to this optical mode, oxidized organic aerosols are transparent in the visible up to the near ultraviolet (k = 0 from 900 - 400 nm), while the fully reduced organic aerosol absorbs in the visible as well as in the near UV (k = 0 from 900 - 500 nm). As the CO2/CH4ratio is quadrupled, the position of the UV absorption resonance is shifted
from ∼177 nm to 264 nm, and its strength is also quadrupled: oxidized tholins absorb more efficiently in the middle UV with respect to the far UV for reduced tholins. Our laboratory wavelength-tabulated refractive indices provide further constraints to atmospheric models of the early Earth and Earth-like exoplanets including photochemical hazes formed under increasingly oxidizing conditions.
Keywords: Planets and satellites: atmospheres, fundamental parameters - Methods: laboratory: solid state - Techniques: spectroscopic
Corresponding author: Lisseth Gavilan
2 Gavilan et al.
1. INTRODUCTION
The presence of CO2 in planetary atmospheres can
modify the production of photochemical aerosols. In the solar system, CO2is the dominant component in the
atmospheres of Mars (95.97 %) and Venus (96.5 %). On Earth, substantial evidence points that life came into existence either near the end of the Hadean Eon (4.6 - 4 Myr) or early in the Archean Eon (4 - 2.5 Myr) releasing oxygen into the atmosphere (Kasting 1993). The atmosphere of the early Earth was N2 dominated
and models show that it could have included up to 3 - 10 % of CO2as well as CH4(Feulner 2012;von Paris et al.
2008). CO2is considered to be the dominant greenhouse
gas offsetting the early Sun that could have kept the early Earth unfrozen, but it could also be removed from the atmosphere by the flow of carbon into the mantle (Sleep & Zahnle 2001).
It has been hypothesized that photochemistry in the early Earth’s atmosphere could lead to formation of or-ganic hazes (Haqq-Misra et al. 2008;Wolf & Toon 2010). Depending on their optical properties, hazes could im-pact planetary habitability via UV shielding and surface cooling (Pavlov et al. 2001). Paleoclimate models that include organic hazes (e.g. Charnay et al. 2013; Arney et al. 2016) usually incorporate laboratory optical stants of tholins produced under Titan’s reducing con-ditions. Such models typically refer to the seminal work byKhare et al.(1984). Laboratory optical properties of oxidized organic aerosols are needed to refine models of the Archean Earth but also of exoplanet atmospheres. Although CO2 is considered a minor carrier of carbon
in exoplanetary atmospheres (Heng & Lyons 2016), its presence could greatly affect the formation and optical properties of photochemical hazes in Earth-like exoplan-ets (Arney et al. 2017).
The aim of this work is to experimentally simulate the composition of increasingly oxidizing atmospheres to understand the impact of CO2 in the optical
proper-ties of the generated organic aerosols. Although previ-ous works have investigated the impact of CO2 on the
aerosol yield and chemical composition (Trainer et al. 2006;Fleury et al. 2014) we investigate the effect of an increasing CO2 concentration on the optical properties
of the plasma-produced solids.
2. METHODS
Tholins, complex nitrogenated organic solids, were produced using the PAMPRE setup, a low pressure (0.95 mbar) radiofrequency (RF) plasma reactor (Szopa et al. 2006). This setup allows the simulation of the com-plex organic chemistry initiated by VUV solar photons in the ionosphere of the early Earth and Titan (Fleury
et al. 2014). A 13.56 MHz RF power source tuned at 30 W generates a capacitively coupled plasma (CCP) fed by a gas mixture. We start by producing a plasma with a gas mixture simulating the reducing composition of Titan’s atmosphere, i.e. N2:CH4 at 95:5 ratios (e.g.
Sciamma-O’Brien et al. 2012). We then prepare tholins at increasingly oxidizing conditions by adding CO2 to
this gas mixture. A first mixture of N2:CO2:CH4 at
90:5:5 ratios keeps the same CH4 concentration as the
reference tholin and a ratio of CO2/CH4 of 1. A
sec-ond csec-ondition of 95:2.5:2.5 keeps the same CO2/CH4of
1 while increasing the concentration of N2. A third gas
mixture of 90:2:8 ratios allows us to test a most oxidizing scenario where CO2/CH4 = 4.
The plasma is produced within a vertical cylindrical cage. Bare silicon (10×10 mm) and MgF2 windows (20
mm diameter) are placed on the bottom electrode, but we only report here the results obtained on the films de-posited on the Si substrates. Spectroscopy of the films deposited on the MgF2 windows will be the main
sub-ject of a forthcoming study. The plasma is turned on until a thin film is deposited for the durations listed in Table 1. We note from these values that the thin film yield is drastically quenched as the CO2/CH4 ratio
in-creases, consistent with previous studies (Trainer et al. 2006; Fleury et al. 2014). Hicks et al. (2016) recently showed that in such gas mixtures CH4 contributes
70-100% of carbon in the aerosol, while CO2 contributes
approximately 10% of oxygen in the aerosol.
3. ANALYSIS 3.1. UV-Visible ellipsometry
Ellipsometric measurements are performed on the tholin films prepared in plasmas with and without CO2.
In spectroscopic ellipsometry (SE) light is elliptically polarized upon reflection from a sample. The ratio of the incident to the reflected light amplitude tan(Ψ) and the relative phase change for the p- and s- polarized light components (∆) result from the interaction between the light with both the organic film and the Si substrate. SE is a robust method for the optical characterization of thin films because it measures two physical magnitudes at each wavelength.
These measurements are done with an UVISEL ellip-someter (Horiba) located at the LCP-A2MC laboratory of the Institut Jean Barriol (Universit´e de Lorraine). This instrument allows us to measure our samples from the ultraviolet to the near-infrared (270 nm - 2030 nm) thanks to a 150 W Xenon light source. Two inci-dence angles are used in these measurements: 70◦ illu-minating an ellipsoidal spot of 2 mm × 4.85 mm on the film, and 60◦illuminating an ellipsoidal spot of 2 mm ×
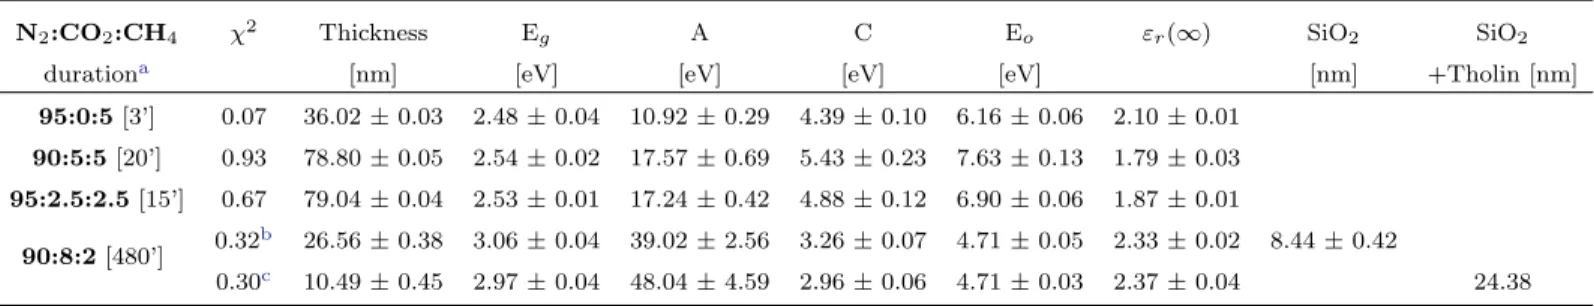
Table 1. Fitted parameters for a Tauc-Lorentz oscillator describing tholins thin films.
N2:CO2:CH4 χ2 Thickness Eg A C Eo εr(∞) SiO2 SiO2
durationa [nm] [eV] [eV] [eV] [eV] [nm] +Tholin [nm]
95:0:5 [3’] 0.07 36.02 ± 0.03 2.48 ± 0.04 10.92 ± 0.29 4.39 ± 0.10 6.16 ± 0.06 2.10 ± 0.01 90:5:5 [20’] 0.93 78.80 ± 0.05 2.54 ± 0.02 17.57 ± 0.69 5.43 ± 0.23 7.63 ± 0.13 1.79 ± 0.03 95:2.5:2.5 [15’] 0.67 79.04 ± 0.04 2.53 ± 0.01 17.24 ± 0.42 4.88 ± 0.12 6.90 ± 0.06 1.87 ± 0.01 90:8:2 [480’] 0.32 b 26.56 ± 0.38 3.06 ± 0.04 39.02 ± 2.56 3.26 ± 0.07 4.71 ± 0.05 2.33 ± 0.02 8.44 ± 0.42 0.30c 10.49 ± 0.45 2.97 ± 0.04 48.04 ± 4.59 2.96 ± 0.06 4.71 ± 0.03 2.37 ± 0.04 24.38
aThe duration refers to the time the plasma was kept on at 30 W bmodel 2: Si+SiO
2+Tholin cmodel 3: Si+(44.2 % SiO
2+Tholin, 55.8 % Tholin)+Tholin
4 mm. The reflected light is integrated over at least half the film area. For the near infrared range (880 - 2100 nm) an InGaAs detector is used.
3.1.1. Tauc-Lorentz model
A dispersion model is required to fit the ellipsometric parameters Ψ and ∆ for each wavelength. This is done via the DeltaPsi2 software platform. For all samples the organic layer is fitted by a Tauc-Lorentz oscillator, shown to effectively describe the optical properties of tholins in the UV-visible (Mahjoub et al. 2012). Jel-lison & Modine (1996) developed this model based on the Tauc joint density of states and the Lorentz oscilla-tor. This oscillator is typically used to model absorbing materials, and an optically (visible) transparent mate-rial can be described as a sum of Lorentz oscillators in the UV. The Tauc-Lorentz model is a further refinement to the Lorentz oscillator and adapts well to amorphous materials with an absorption in the visible and/or ultra-violet such as dielectrics, semiconductors and polymers. In this model, the imaginary part of the dielectric function is given by the product of the imaginary part of Tauc’s dielectric function (Tauc et al. 1966) with a Lorentzian oscillator, εi,T L(E) = AEoC(E − Eg)2 E(E2− E2 o)2+ C2E2 , for E > Eg 0, for E ≤ Eg (1)
where Eg(in eV) is the optical band gap energy, which
specifies at which energy the material becomes absorb-ing. Eo (in eV) is the energy position of the major
absorption peak in the UV (Eg < Eo). A (in eV) is
re-lated to the strength of this absorption peak while C (in eV) is related to its broadening or damping. The fitted parameters are listed in Table1.
The real part εr,T L (E) of the dielectric function is
derived from the expression of εi using the
Kramers-Figure 1. Refractive indices in the UV-Visible (270 nm - 2000 nm) for tholins prepared with different mixtures of N2:CO2:CH4. As the CO2/CH4ratio increases, the strength
of the major UV absorption is significantly increased.
Kronig closure relations, so that, εr(E) = εr(∞) + 2 πP Z ∞ Eg ξ · εi(ξ) ξ2− E2dξ, (2)
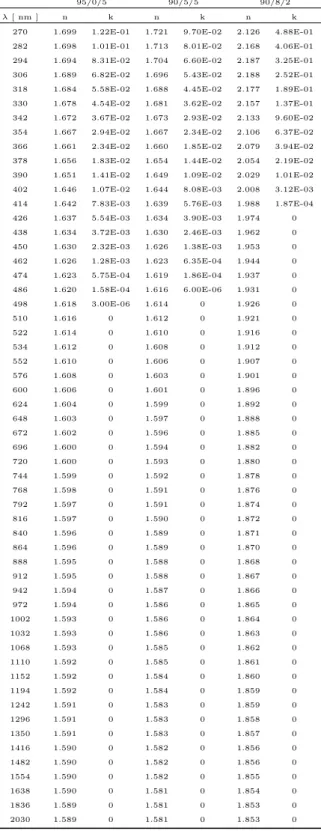
4 Gavilan et al.
Table 2. UV-Visible-NIR refractive indices of tholins: 1) 95:0:5 (no CO2, model 1), 2) 90:5:5 (CO2/CH4 = 1, model
1), 3) 90:8:2 (CO2/CH4 = 4, model 3).
95/0/5 90/5/5 90/8/2
λ [ nm ] n k n k n k
270 1.699 1.22E-01 1.721 9.70E-02 2.126 4.88E-01 282 1.698 1.01E-01 1.713 8.01E-02 2.168 4.06E-01 294 1.694 8.31E-02 1.704 6.60E-02 2.187 3.25E-01 306 1.689 6.82E-02 1.696 5.43E-02 2.188 2.52E-01 318 1.684 5.58E-02 1.688 4.45E-02 2.177 1.89E-01 330 1.678 4.54E-02 1.681 3.62E-02 2.157 1.37E-01 342 1.672 3.67E-02 1.673 2.93E-02 2.133 9.60E-02 354 1.667 2.94E-02 1.667 2.34E-02 2.106 6.37E-02 366 1.661 2.34E-02 1.660 1.85E-02 2.079 3.94E-02 378 1.656 1.83E-02 1.654 1.44E-02 2.054 2.19E-02 390 1.651 1.41E-02 1.649 1.09E-02 2.029 1.01E-02 402 1.646 1.07E-02 1.644 8.08E-03 2.008 3.12E-03 414 1.642 7.83E-03 1.639 5.76E-03 1.988 1.87E-04 426 1.637 5.54E-03 1.634 3.90E-03 1.974 0 438 1.634 3.72E-03 1.630 2.46E-03 1.962 0 450 1.630 2.32E-03 1.626 1.38E-03 1.953 0 462 1.626 1.28E-03 1.623 6.35E-04 1.944 0 474 1.623 5.75E-04 1.619 1.86E-04 1.937 0 486 1.620 1.58E-04 1.616 6.00E-06 1.931 0 498 1.618 3.00E-06 1.614 0 1.926 0 510 1.616 0 1.612 0 1.921 0 522 1.614 0 1.610 0 1.916 0 534 1.612 0 1.608 0 1.912 0 552 1.610 0 1.606 0 1.907 0 576 1.608 0 1.603 0 1.901 0 600 1.606 0 1.601 0 1.896 0 624 1.604 0 1.599 0 1.892 0 648 1.603 0 1.597 0 1.888 0 672 1.602 0 1.596 0 1.885 0 696 1.600 0 1.594 0 1.882 0 720 1.600 0 1.593 0 1.880 0 744 1.599 0 1.592 0 1.878 0 768 1.598 0 1.591 0 1.876 0 792 1.597 0 1.591 0 1.874 0 816 1.597 0 1.590 0 1.872 0 840 1.596 0 1.589 0 1.871 0 864 1.596 0 1.589 0 1.870 0 888 1.595 0 1.588 0 1.868 0 912 1.595 0 1.588 0 1.867 0 942 1.594 0 1.587 0 1.866 0 972 1.594 0 1.586 0 1.865 0 1002 1.593 0 1.586 0 1.864 0 1032 1.593 0 1.586 0 1.863 0 1068 1.593 0 1.585 0 1.862 0 1110 1.592 0 1.585 0 1.861 0 1152 1.592 0 1.584 0 1.860 0 1194 1.592 0 1.584 0 1.859 0 1242 1.591 0 1.583 0 1.859 0 1296 1.591 0 1.583 0 1.858 0 1350 1.591 0 1.583 0 1.857 0 1416 1.590 0 1.582 0 1.856 0 1482 1.590 0 1.582 0 1.856 0 1554 1.590 0 1.582 0 1.855 0 1638 1.590 0 1.581 0 1.854 0 1836 1.589 0 1.581 0 1.853 0 2030 1.589 0 1.581 0 1.853 0
where εr(∞) is the high frequency real dielectric
con-stant, and P is the Cauchy principal value containing the residues of the integral at the poles on the lower half of the complex plane and along the real axis.
Because the ellipsometric parameters only slightly vary from 870 to 2000 nm, fitting is first done in the 270 - 870 nm region, optimizing the χ2 in this range, and later used to calculate the optical constants over the entire range. To model the thin films described in Table1, we use three models to optimize the ellipsomet-ric fit for each type of sample. Model 1 (m1) consists of an Si substrate, covered by an organic thin film, and best describes the Titan tholin (95:0:5) and the low-oxidation tholin (90:5:5). To describe the most oxidized tholin we try a second model (m2), consisting of an Si substrate, covered by an SiO2 thin layer, itself covered
by an organic thin film. A CO2/CH4= 4 plasma is able
to oxidize the surface of the Si substrate generating sili-con dioxide. A third model (m3) further refines this by generating a mixed layer of SiO2with the tholin. It
con-sists of an Si substrate, a mixed layer consisting of the refractived indices of SiO2 and the tholin, and a pure
tholin layer. The m3 model was found to best fit the ellipsometric parameters of the most oxidized tholin.
Optimizing the number of layers and their mix-ing is necessary to best adjust the ellipsometric data. This is the case for the most oxidized tholin (90:8:2), for which the oxidizing plasma reacted with the Si substrate producing SiO2. Such
re-actions could form a single SiO2 layer but the
improved fit with model (m3) seems to indicate that an intermediate material, a mixture of the tholin with SiO2, best accounts for this surface
reactivity. Since this reaction happens close to the surface, the top layer in this sample is fitted by a pure tholin. The choice of an Si substrate is justified since this single-side polished material is reflective (ideal for ellipsometry) and it sim-plifies the number of parameters used to model the organic and substrate layers. The modeled real and imaginary refractive indices obtained by the best χ2 models are presented in Fig. 1. Their
wavelength-dependent refractive indices are listed in Table2. As the CO2/CH4 ratio increases from 0 to 1, the
op-tical gap Eg shifts from 500 nm to 488 nm (2.48
to 2.54 eV), and for CO2/CH4 = 4, the optical
gap Eg value shifts to even shorter wavelengths,
400 nm (3 eV). This means that an oxidized or-ganic aerosol is transparent in the visible up to the near ultraviolet (k = 0 from 900 - 400 nm), while a reduced organic aerosol absorbs in the visible as well as in the near UV (k = 0 from 900
- 500 nm). As the CO2/CH4 ratio is quadrupled,
the position of the UV absorption resonance is shifted from ∼177 nm to 264 nm and its strength is also quadrupled: oxidized tholins absorb more efficiently in the middle UV with respect to the far UV for reduced tholins.
In Fig. 1, we compared the refractive in-dices for oxidized and reduced tholins in this study to the optical constants from Khare et al. (1984) and Hasenkopf et al. (2010). In this lat-ter work, Titan and early Earth organic haze aerosols analogs are measured using cavity ring-down aerosol extinction spectroscopy on freely-floating particles. Their Titan analog has a much smaller real refractive index, n, compared to our measurements for the fully reduced tholin (95:0:5) and to values in (Khare et al. 1984). In contrast, the real index value of their early Earth analog at 532 nm is close to ours. For the imag-inary index, k, the 532 nm values in Hasenkopf et al.(2010) are larger than our modeled values, and are more similar to those found in Khare et al. (1984). McKay et al. (2001) pointed out that the sharp drop (k dropping as the power of 4) in absorption from 300 nm to 900 nm in a tholin spectra is essential for reproducing the shape of Titan’s geometric albedo. Neither our fully reduced tholin, nor the poly-HCN tholins used in (Khare et al. 1984) present this sharp drop. Although our reduced tholin is not an ideal Titan analog, it has allowed us to perform a comparative study (increasing the CO2/CH4
ratio) with the same instrumental setup, and to compare the optical properties of similar organic solids by leaving oxidation as the single free pa-rameter.
4. ASTROPHYSICAL IMPLICATIONS Our experiments show that a varying atmospheric CO2/CH4 ratio can significantly modify the optical
properties of organic aerosols. Tholins produced un-der an oxidizing plasma present a larger band gap than tholins produced in a reduced plasma, i.e. their ab-sorption begins in the UV rather than the visible range. Furthermore, oxidized tholins are much better absorbers in the UV than reduced tholins (as much as four times more absorbing, at least up to the measured energy of 4.59 eV).
The strong UV absorption of oxidized tholins is par-ticularly relevant to the early Earth when we consider the blue-shifted spectrum of a young Sun (Cnossen et al. 2007). Solar far-ultraviolet (FUV) emission was about
twice the present value 2.5 Gyr ago and about 4 times the present value 3.5 Gyr ago (Guinan et al. 2003). Ox-idized aerosols could have contributed to UV shielding from the young Sun prior to the onset of much more ox-idizing conditions (CO2/CH4> 4), which mitigates the
formation of photochemical hazes.
This study provides, for the first time, laboratory wavelength-dependent refractive indices of oxidized or-ganic aerosols in the UV-Visible-NIR range at increasing degrees of oxidation. Such indices can be used to refine radiative transfer models of increasingly oxidizing plane-tary atmospheres including photochemical hazes. These can be further incorporated to atmospheric models of the early Earth but also of Earth-like exoplanets (e.g. Forget & Leconte 2014).
5. ACKNOWLEDGEMENTS
We thank Dr. Pavel Bulkin (LPICM, Ecole Polytech-nique) for his help with the preliminary measurements. N.C. and L.G. thank the European Research Council for funding via the ERC PrimChem project (grant agree-ment No. 636829.)
6 Gavilan et al. REFERENCES
Arney, G., Domagal-Goldman, S. D., Meadows, V. S., et al. 2016, Astrobiology, 16, 873
Arney, G. N., Meadows, V. S., Domagal-Goldman, S. D., et al. 2017, ApJ, 836, 49
Charnay, B., Forget, F., Wordsworth, R., et al. 2013, Journal of Geophysical Research (Atmospheres), 118, 10 Cnossen, I., Sanz-Forcada, J., Favata, F., et al. 2007,
Journal of Geophysical Research (Planets), 112, E02008 Feulner, G. 2012, Reviews of Geophysics, 50, RG2006 Fleury, B., Carrasco, N., Gautier, T., et al. 2014, Icarus,
238, 221
Forget, F., & Leconte, J. 2014, Philosophical Transactions of the Royal Society of London Series A, 372, 20130084 Guinan, E. F., Ribas, I., & Harper, G. M. 2003, ApJ, 594,
561
Haqq-Misra, J. D., Domagal-Goldman, S. D., Kasting, P. J., & Kasting, J. F. 2008, Astrobiology, 8, 1127 Hasenkopf, C. A., Beaver, M. R., Trainer, M. G., et al.
2010, Icarus, 207, 903
Heng, K., & Lyons, J. R. 2016, ApJ, 817, 149
Hicks, R. K., Day, D. A., Jimenez, J. L., & Tolbert, M. A. 2016, Astrobiology, 16, 822
Jellison, Jr., G. E., & Modine, F. A. 1996, Applied Physics Letters, 69, 371
Kasting, J. F. 1993, Science, 259, 920
Khare, B. N., Sagan, C., Arakawa, E. T., et al. 1984, Icarus, 60, 127
Mahjoub, A., Carrasco, N., Dahoo, P.-R., et al. 2012, Icarus, 221, 670
McKay, C. P., Coustenis, A., Samuelson, R. E., et al. 2001, Planet. Space Sci., 49, 79
Pavlov, A. A., Brown, L. L., & Kasting, J. F. 2001, J. Geophys. Res., 106, 23267
Sciamma-O’Brien, E., Dahoo, P.-R., Hadamcik, E., et al. 2012, Icarus, 218, 356
Sleep, N. H., & Zahnle, K. 2001, Journal of Geophysical Research, 106, 1373
Szopa, C., Cernogora, G., Boufendi, L., Correia, J. J., & Coll, P. 2006, Planetary and Space Science, 54, 394 Tauc, J., Grigorovici, R., & Vancu, A. 1966, Physica Status
Solidi B-basic Solid State Physics, 15, 627
Trainer, M. G., Pavlov, A. A., Dewitt, H. L., et al. 2006, Proceedings of the National Academy of Science, 103, 18035
von Paris, P., Rauer, H., Lee Grenfell, J., et al. 2008, Planetary and Space Science, 56, 1244