HAL Id: hal-00472857
https://hal.archives-ouvertes.fr/hal-00472857
Submitted on 4 Sep 2015
HAL is a multi-disciplinary open access
archive for the deposit and dissemination of
sci-entific research documents, whether they are
pub-lished or not. The documents may come from
teaching and research institutions in France or
abroad, or from public or private research centers.
L’archive ouverte pluridisciplinaire HAL, est
destinée au dépôt et à la diffusion de documents
scientifiques de niveau recherche, publiés ou non,
émanant des établissements d’enseignement et de
recherche français ou étrangers, des laboratoires
publics ou privés.
Response of tropical stratospheric O3, NO2 and NO3 to
the equatorial Quasi-Biennial Oscillation and to
temperature as seen from GOMOS/ENVISAT
Alain Hauchecorne, Jean-Loup Bertaux, Francis Dalaudier, Philippe Keckhut,
Perrine Lemennais, Slimane Bekki, Marion Marchand, Jean-Claude Lebrun,
Erkki Kyrölä, Johanna Tamminen, et al.
To cite this version:
Alain Hauchecorne, Jean-Loup Bertaux, Francis Dalaudier, Philippe Keckhut, Perrine Lemennais, et
al.. Response of tropical stratospheric O3, NO2 and NO3 to the equatorial Quasi-Biennial Oscillation
and to temperature as seen from GOMOS/ENVISAT. Atmospheric Chemistry and Physics, European
Geosciences Union, 2010, 10 (18), pp.8873-8879. �10.5194/acp-10-8873-2010�. �hal-00472857�
www.atmos-chem-phys.net/10/8873/2010/ doi:10.5194/acp-10-8873-2010
© Author(s) 2010. CC Attribution 3.0 License.
Chemistry
and Physics
Response of tropical stratospheric O
3
, NO
2
and NO
3
to the
equatorial Quasi-Biennial Oscillation and to temperature as seen
from GOMOS/ENVISAT
A. Hauchecorne1, J. L. Bertaux1, F. Dalaudier1, P. Keckhut1, P. Lemennais1, S. Bekki1, M. Marchand1, J. C. Lebrun1, E. Kyr¨ol¨a2, J. Tamminen2, V. Sofieva2, D. Fussen3, F. Vanhellemont3, O. Fanton d’Andon4, G. Barrot4, L. Blanot4, T. Fehr5, and L. Saavedra de Miguel6
1LATMOS/IPSL, UVSQ, CNRS-INSU, Guyancourt, France
2Finnish Meteorological Institute, Earth Observation, Helsinki, Finland 3Institut d’A´eronomie Spatiale de Belgique, Brussels, Belgium 4ACRI-ST, Sophia-Antopolis, France
5ESA, Frascati, Italy 6Serco, Frascati, Italy
Received: 29 January 2010 – Published in Atmos. Chem. Phys. Discuss.: 9 April 2010 Revised: 23 July 2010 – Accepted: 29 July 2010 – Published: 20 September 2010
Abstract. The stellar occultation spectrometer GOMOS (Global Ozone Monitoring by Occultation of Stars) on ESA’s Envisat satellite measures vertical profiles O3, NO2and NO3 with a high long-term stability due to the self-calibrating na-ture of the technique. More than 6 years of GOMOS data from August 2002 to end 2008 have been analysed to study the inter-annual variation of O3, NO2and NO3 in the trop-ics. It is shown that the QBO of the equatorial wind induces variations in the local concentration larger than 10% for O3 and larger than 25% for NO2.
Quasi-Biennial Oscillation signals can be found in the evo-lution of the three constituents up to at least 40 km. We found that NO3 is positively correlated with temperature up to 45 km in the region where it is in chemical equilib-rium with O3. Our results confirm the existence of a tran-sition from a dynamical control of O3 below 28 km with O3correlated with temperature and a chemical/temperature control between 28 and 38 km with O3 anti-correlated with NO2and temperature. Above 38 km and up to 50 km a dif-ferent regime is found with O3 and NO2 correlated with each other and anti-correlated with temperature. For the NO2/temperature anti-correlation in the upper stratosphere, our proposed explanation is the modulation of the N2O as-cent by the QBO up to 45 km. The oxidation of N2O is the
Correspondence to: A. Hauchecorne
main source of NOyin this altitude region. An enhancement of the ascending motion will cool adiabatically the atmo-sphere and will increase the amount of N2O concentration available for NOyformation.
1 Introduction
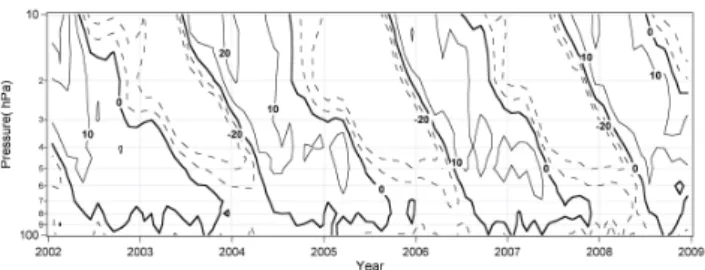
The Quasi-Biennial Oscillation (QBO) of the equatorial wind is a main feature of the dynamics of the tropical stratosphere (see the review by Baldwin et al., 2001). Equatorial winds are blowing alternately from east and from west with a mean period of about 28 months (Fig. 1) and with a downward propagation of regions of westerly and easterly winds. Reed (1964) was the first to propose an empirical model for the QBO, explaining the relation observed between zonal wind and temperature. The region with negative vertical gradient of equatorial zonal wind (region situated between westerly winds below and easterly winds above) is associated with an upwelling at the equator inducing an adiabatic cooling. The opposite is found when the vertical gradient of zonal wind is positive. This feature is limited to the 15◦S to 15◦N latitude band. The subtropical region (15◦ to 30◦latitude) exhibits wind and temperature variations in opposite phase with the equatorial region as a result of the residual cell circulation induced by QBO with upwelling (downwelling) at the Equa-tor and downwelling (upwelling) in the sub-tropics. Lindzen
8874 A. Hauchecorne et al.: Response of tropical stratospheric O3, NO2and NO3
Fig. 1. Time-height section of the equatorial QBO wind updated from Naujokat (1986). Easterly wind contours (negative values) are plotted with dashed lines.
and Holton (1968) showed in a 2-D model that the downward propagating QBO structure could be driven by a spectrum of vertically propagating gravity waves with phase speeds in both eastward and westward directions, each wave accelerat-ing the wind in the direction of its phase propagation at the altitude where its momentum flux is transferred to the zonal flow. The QBO induces variations in the vertical and merid-ional transport of constituents and in the rate of temperature dependent chemical reactions, leading to changes in the at-mospheric composition. A few studies were made to detect a QBO signal in observations of the concentration of ozone and other constituents in the tropical stratosphere. Logan et al. (2003) showed a QBO signature in tropical ozone sonde data. QBO signals in Stratospheric Aerosol and Gas Experi-ment (SAGE) O3and NO2data and their phase relationship were analysed by Zawodny and McCormick (1991), Hasebe (1994) and Chipperfield et al. (1994). Randel and Wu (1996) showed a ±4% modulation in the ozone equatorial column from Solar Backscatter Ultraviolet (SBUV) data. Schoeberl et al. (2008) looked at the QBO and annual cycle variations in trace gases from HALOE and Aura MLS observations. Fad-navis and Beig (2009) analysed temperature and ozone QBO using UARS MLS data. Gray and Pyle (1989) performed the first coupled 2-D QBO simulation of the O3QBO. Chip-perfield et al. (1994) studied the link between QBO signals on O3and NO2using a 2-D model. Tian et al. (2006) used a fully coupled chemistry-climate model that generates its own QBO in wind and temperature to examine the QBO signals in stratospheric trace gases.
The goal of this study is to evaluate, using Global Ozone Monitoring by Occultation of Stars (GOMOS) data from Au-gust 2002 to December 2008, the QBO impact on O3, NO2 and NO3 vertical profiles in the Tropics and their cross-correlation with temperature derived from European Centre for Medium-Range Weather Forecasts (ECMWF) meteoro-logical analyses. The GOMOS instrument is described in Sect. 2. The data selection and processing strategy are pre-sented in Sect. 3. The inter-annual variability of both O3and NO2 is shown in Sect. 4 and their relationship with QBO, NO3and temperature in Sect. 5. The results are discussed in Sect. 6 and we conclude in Sect. 7.
2 The GOMOS instrument
GOMOS, one of ten instruments on ESA’s ENVISAT mis-sion, is a stellar occultation spectrometer aimed at building a global climatology of ozone and related species in the mid-dle atmosphere (15 to 100 km) with a very high accuracy us-ing the technique of stellar occultation (Bertaux et al., 2004). Bertaux et al. (2010) give an overview of the scientific re-sults. Each constituent can be identified by its absorption spectrum. The atmospheric transmission spectrum is equal to the ratio between the stellar spectrum absorbed and scat-tered by the atmosphere and the reference stellar spectrum measured outside the atmosphere. As the reference spec-trum is measured at the beginning of each occultation, we can consider that GOMOS is a self-calibrated instrument, in-dependent of any radiometric calibration. Furthermore the stellar occultation technique gives an excellent knowledge of the tangent altitude, depending only on the geometry of the light path between the star and the satellite. The 250–680 nm spectral domain is used for the determination of O3, NO2, NO3 and aerosols from the upper troposphere to the meso-sphere. In addition, two high spectral resolution channels centred at 760 and 940 nm allow the measurement of O2and H2O and two fast photometers (1 kHz sampling rate) are used to correct stellar scintillation perturbations and to determine high vertical resolution temperature profiles. Global latitude coverage is obtained with up to 40 stellar occultations per or-bit from South Pole to North Pole. The data quality depends on illumination conditions and on stellar brightness and tem-perature. Data acquired on dark limb (night-time) are of bet-ter quality than for the bright limb (day-time) because of a smaller perturbation by background light. Hot stars have a strong UV emission and allow obtaining ozone profiles to be obtained up to the lower thermosphere using UV absorp-tion bands. Cool-star ozone profiles are limited to the strato-sphere using the visible Chappuis band. NO2profiles extend from 20 to 50 km in typical non-polar conditions and up to 70 km during polar winter when a strong NO2enhancement occurs. The typical accuracy is 5% for O3 (Kyr¨ol¨a et al., 2006) and 15–20% for NO2(Hauchecorne at al., 2005).
3 Data selection and processing
One difficulty with the stellar occultation technique is the sensitivity of the data quality to stellar characteristics (bright-ness, temperature) and to viewing geometry (sun azimuth and elevation, occultation obliquity). Furthermore, for a given star, the latitude of the tangent point depends on the day of the year and the latitude coverage changes with time. In order to build 3-D NO2and NO3fields as homogeneous as possible, a 3-step selection and averaging procedure is ap-plied:
1) As explained in Hauchecorne et al. (2005) we use only the 70 brightest stars and we discard daylight observations
Fig. 2. Evolution of the equatorial QBO wind at 10 and 30 hPa updated from Naujokat (1986).
(illumination flag “bright limb”) to eliminate noisy O3, NO2 and NO3 profiles. Concentration profiles are con-verted to mixing ratio profiles using a combined atmo-spheric density profile from ECMWF analyses below 1 hPa (about 48 km) and from the climatological MSIS-2000 model (Hedin, 1991) above 1 hPa.
2) For a given star and during one day, the latitude of the tangent point is almost constant and the star is occulted 14 or 15 times (once per orbit) with a 25◦westward longi-tude shift per orbit. A daily mean profile is computed as the weighted average of all available profiles selected from the 14–15 available. Weights are inversely proportional to the squared error estimates. Each daily mean profile can be con-sidered as a zonal average at the mean latitude of the tangent point.
3) All daily mean profiles of ozone mixing ratio for one month and within the tropical region (15◦S to 15◦N latitude
band) are averaged. The evolution of tropical ozone for the period August 2002 to December 2008 is thus obtained. A similar processing is applied to NO2and NO3data.
Finally, for each altitude the correlation coefficient be-tween each pair of parameters for O3, NO2, NO3, ECMWF temperature and QBO winds at 30 hPa and at 10 hPa is com-puted. Deviations from their mean value for the full period at the given altitude are used to compute the correlation co-efficient. QBO winds are Singapore (1◦N) zonal wind ra-diosonde data compiled by the Berlin Free University up-dated from Naujokat (1986). Data are downloaded from the web site:
http://www.geo.fu-berlin.de/en/met/ag/strat/produkte/qbo. QBO winds at 30 hPa and 10 hPa are chosen because they are almost orthogonal (correlation coefficient 0.10) and the wind evo-lution at 30 hPa follows that at 10 hPa with a delay of about a quarter of the QBO period as seen in Fig. 2.
4 Interannual variability
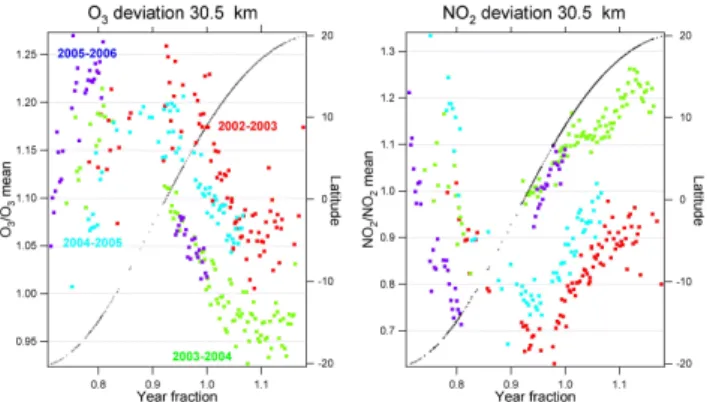
For a given star, it is possible to obtain one profile per orbit with the latitude of the tangent point varying slowly in time and the lon-gitude shifted by 25◦ westward from one orbit to the next. It is then possible to obtain 14 to 15 profiles during one day at constant
Fig. 3. Evolution of NO2and O3mixing ratios at 30.5 km obtained from star S029 (Beta Carinae) occultations as a function of the frac-tion of the year (numbers greater than 1 indicates dates after 1st January). Concentrations have been divided by the mean value at 30.5 km for the full period.
latitude around the globe and to derive a daily zonal mean verti-cal profile for each constituent. Furthermore, the evolution of the latitude of the tangent point is very reproducible from one year to another and it is possible to compare profiles obtained at the same date for consecutive years. It should be noted that, due to limita-tions in possible star pointing azimuths since 2005, we are not able to follow all stars between 2002 and 2008 in a periodic manner. The star S029 in the GOMOS catalogue (Beta Carinae) has been chosen because it is always occulted in the tropical region. Figure 3 shows the evolution of NO2and O3at 30 km during 4 consecutive years. The day-to-day variation is quite low and probably within the in-strumental noise but the year-to-year variation is quite large, up to 25% for NO2and up to 10% for O3with an apparent 2 year period. Furthermore, it is clear that the variations of O3and NO2are in op-posite directions. This seems to indicate that the concentration of these 2 species are anti-correlated and most likely linked with the QBO phase. This QBO link will be investigated in detail in the next section. Our analysis concentrates on the response of stratospheric constituents to the QBO that appears to be the dominant contributor to our results. We are aware that there may be some influence of other inter-annual variability, in particular ENSO (El Nino-Sothern Oscillation) but also solar variability and the increase of greenhouse gases. However it is not the goal of this paper to study these other terms due to the limited length of the data series (6 years and 5 months).
5 Relationship with QBO and temperature
Figure 4 presents the evolution of monthly averaged NO2and O3 mixing ratios normalized by their mean seasonal value. The evolu-tion of the 2 constituents is clearly correlated with the QBO signal in equatorial wind at 10 hPa (∼31 km). We consider the QBO wind at 10 hPa as a good proxy because this altitude corresponds to a peak of the ozone QBO (Fadnavis and Beig, 2009). The sign of the correlation with the 10 hPa wind is changing with altitude. For NO2, there is a negative correlation between 22 and 27 km and a positive correlation above at least up to 40 km. For O3the corre-lation is positive between 22 and 28 km, negative between 28 and
8876 A. Hauchecorne et al.: Response of tropical stratospheric O3, NO2and NO3
Fig. 4. Top) Evolution of O3and NO2mixing ratios in the latitude band 15◦S–15◦N divided by their mean value at the given altitude for the full period; Bottom) Equatorial zonal wind at 10 hPa updated from Naujokat (1986).
Fig. 5. Correlation between the deviations of NO2 and O3from their mean value for the full period at the given altitude (blue curve, values larger than ±1 standard deviation uncertainty are represented with a thick line) and relative deviation of O3per unit of relative deviation of NO2(red curve, the 1-sigma uncertainty is plotted).
36 km and positive again between 36 and 45 km. Below 22 km the signal is less clear, probably due to the increase of measurement un-certainties. Fig. 4 shows clearly that the variation of O3and NO2 are correlated or anti-correlated depending on the altitude. This O3 - NO2correlation (Fig. 5) is found to be positive between 20 and 24 km, not significant between 24 and 27 km, strongly negative be-tween 27 and 38 km with a maximum of anti-correlation up to -0.85 at 30 km and positive again between 38 and 55 km. The relative variation of O3is between −40% to +40% of that of NO2. These phase relationships will be discussed in Sect.6.
The NO3concentration is known to be very sensitive to temper-ature (Marchand et al., 2007). It is then not surprising to observe that the evolution of monthly averaged NO3mixing ratios is well correlated with the evolution of ECMWF temperature interpolated to the location of observations (Fig. 6) between 25 and 45 km. The
Fig. 6. Top) Evolution of NO3mixing ratio and ECMWF tempera-ture in the latitude band 15◦S–15◦N their mean value at the given altitude for the full period. The plot is limited to altitude range 27– 48 km to exclude regions where the signal to noise ratio in NO3 mixing ratio is to poor; Bottom) Equatorial zonal wind at 10 hPa updated from Naujokat (1986).
limitation of the good correlation to this altitude range is not due to physical or chemical processes but to the increase of NO3 con-centration uncertainty outside this range preventing the detection of any significant correlation (Hauchecorne et al., 2005). The NO3 -temperature correlation is due to the strongly positive -temperature dependence of the chemical reaction forming NO3:
NO2+O3→NO3+O2 (R1) Marchand et al. (2007) showed that the temperature can be de-rived from O3and NO3GOMOS measurements between 30 and 40 km where NO3is in chemical equilibrium during night.
The evolution of O3, NO2, NO3and temperature seems to be dominated by the QBO up to about 40 km and the downward prop-agation of the QBO signal can be followed from 40 km down to 27 km for NO3and to 22 km for O3and NO2. Above 40 km the QBO signature is less clear and the interpretation of the observed correlations has to be made with caution. However we consider it interesting to look at the sign of the correlation with temperature even if the causes of these temperature changes are not fully under-stood.
In order to identify all phase relationships between variables, Fig. 7 presents the correlation coefficient of O3, NO2and NO3, with the other constituents, with temperature (T ) and with the 2 QBO proxies, the equatorial wind at 10 hPa (U10) and at 30 hPa (U30). For O3/NO2we found again the succession of positive and nega-tive correlation altitude domains shown in Fig. 5. As expected T is alternately correlated and anti-correlated with U10and with U30 between 20 and 45 km with a downward shift in altitude from U10 to U30. This feature is consistent with the fact that the maximum of warming occurs where the vertical gradient of zonal wind is max-imum, a few km below the altitude of wind maxmax-imum, at 26 and 21 km for the correlation with U respectively at 10 hPa (∼31 km) and 30 hPa (∼24 km). For O3/T , the correlation is positive between 20 and 28 km and negative between 30 and 50 km related to the change between the ozone dynamically controlled region below 28– 30 km and ozone chemically controlled region above 30 km (Chip-perfield et al., 1994). O3/U10and O3/U30 present a succession of
Fig. 7. Correlation coefficients between the deviation from their mean value for the full period at the given altitude of; Top left) Temperature (T ) and equatorial wind at wind at 10 hPa and 30 hPa (U10 and U30); Top right) O3, NO2 and NO3 mixing ratios (top left); Middle left) O3and T , U10and U30; Middle right) NO2 and
T, U10and U30; Bottom) NO3and T , U10and U30. Values larger than ±1 standard deviation uncertainty are represented with thick lines.
positive and negative regions with a downward shift in altitude be-tween U10to U30corresponding to the altitude difference between the levels as for the correlation with temperature. For NO2/T the correlation is negative between 23 and 26 km, positive between 28 and 38 km and negative again around 40 km and at 48–50 km. NO2 is positively correlated with U10from 28 to 45 km, with U30from 25 to 32 km, showing again the altitude shift between the two wind levels and with T from 32 to 38 km.
6 Discussion
There are only a few studies concerning the relation between tropi-cal NO2, O3and the QBO signal. Chipperfield et al. (1994) studied the QBO signal in SAGE II O3and NO2between 1984 and 1991 with the help of a 2D radiative-dynamical-chemistry model. They observed a change of sign in SAGE II O3signal at 28 km, in agree-ment with our results. The change of sign was explained by the transition from dynamical control below to chemical control above this altitude and was reproduced by the model. The anti-correlation between O3and temperature is due to the strong temperature
de-pendence of the ozone loss reaction in the Chapman cycle (Brasseur and Solomon, 2005):
O3+O → 2O2 (R2)
Chipperfield et al. (1994) explained the anti-correlation between O3and NO2in the chemical region by the catalytic destruction of O3by NOx. However this interpretation is still in discussion and Butchart et al. (2003) were able to reproduce the O3 QBO sig-nal in their 3-D chemistry-transport model without QBO induced variations in NOy. Tian et al. (2006) also showed the change near 28 km from dynamical to chemical control of O3by using a fully coupled chemistry-climate model. The phase change for NOywas near 25 km, 3 km lower than for O3. Our results confirm the anti-correlation between QBO signals in O3and NO2up to 38 km and the transition around 28 km between the dynamical control of O3 below and its photochemical control above.
Above 38 km we observe a second transition with O3and NO2 correlated with each other and anti-correlated with temperature. Most observational studies are limited to altitudes below 40 km and are not able to capture this feature. We investigate two possible explanations for this observed O3-NO2correlation:
1) The first hypothesis is the temperature dependence of chemi-cal reactions involved in O3and NOyphotochemistry in the upper stratosphere. The mechanism involved for the O3anti-correlation with temperature is the same between 28 and 36 km. The trans-formation of NO2into the reservoir species, N2O5and HNO3, in-creases with decreasing temperature (Brasseur and Solomon, 2005) due to the temperature dependence of the chemical reactions: NO2+O3→NO3+O2 (R3) NO2+NO3+M →N2O5+M (R4) for the formation of N2O5and:
NO2+OH + M → HNO3+M (R5) for the formation of HNO3. This hypothesis is in agreement with the model results of Tian et al. (2006), presented in their Fig. 9, showing an anti-correlation in the QBO response of NOyand NOx at 45 km. However, more than 90% of NOy is in the form of NOx(NO2during night) at altitudes higher than 40 km according to Brasseur and Solomon (2005) and this mechanism is probably not very efficient.
2) The second hypothesis is the modulation of N2O ascent in the upper stratosphere due to a modulation the QBO at least up to 45 km and by any other dynamical process, for instance the modulation of the Brewer-Dobson circulation. In the equatorial region there is still a significant amount of N2O up to at 45–50 km. Jin et al. (2009) reported a 35 ppbv N2O mixing ratio at 2 hPa (about 45 km) us-ing Atmospheric Chemistry Experiment Fourier Transform Spec-trometer (ACE-FTS) data in agreement with the Canadian Middle Atmosphere Model (CMAM) simulations. An increase of the as-cending motion will cause an adiabatic cooling and will bring more N2O in the upper stratosphere, providing an increase of the source of NOxfrom N2O oxidation by atomic oxygen. This mechanism would explain the observed anti-correlation between NO2and tem-perature in the upper stratosphere. Further observational and model studies are needed to test our hypothesis and to better understand the mechanisms involved in the O3/NO2/temperature relationship above 38 km.
8878 A. Hauchecorne et al.: Response of tropical stratospheric O3, NO2and NO3
7 Conclusion
We analysed more than 6 years of night-time GOMOS O3, NO2and NO3 observations in the tropical region to study the inter-annual variability and extract the QBO signal. For a given altitude, latitude and date, the year to year variations in the local concentration can be larger than 10% for O3 and larger than 25% for NO2. These variations are mainly due the modulation of the vertical transport and the temperature by the QBO induced circulation.
QBO signals can be found in the evolution of the three con-stituents up to at least 40 km. We found that NO3 is positively correlated with temperature up to 45 km in the region where it is in chemical equilibrium with O3.
For O3, our results confirm the existence of a transition from a dynamical control of O3below 28 km, with O3correlated temper-ature, and a chemical/temperature control of O3between 28 and 38 km, with O3anti-correlated with NO2and temperature. Above 38 km and up to 50 km a different regime is found with O3and NO2 correlated with each other and anti-correlated with temperature. For the NO2/temperature anti-correlation, our proposed explanation is the modulation of the N2O ascent in the upper stratosphere by the QBO at least up to 45 km and by any other dynamical process above 45 km, for instance the modulation of the Brewer-Dobson circula-tion. The oxidation of N2O is the main source of NOyin this al-titude region. An enhancement of the ascending motion will cool adiabatically the atmosphere and will increase the amount of N2O available for NOyformation.
Finally, due to the limitation of the length of the GOMOS data series (6 years and 5 months), our analysis concentrates on the QBO that appears to be the dominant contributor to ozone and nitrogen oxide inter-annual variability in the equatorial stratosphere. How-ever it is not excluded that other phenomena (ENSO, solar variabil-ity, increase of greenhouse gases) may be have some influence on this variability. We plan to examine this point in further studies. Acknowledgements. This study was supported by the Euro-pean Commission within the SCOUT-O3 project (contract 505390-GOCECT-2004) and GEOMON project (contract number GOCE-CT-2007-036677) and by the European Space Agency and by the French funding agencies: CNRS-INSU and CNES. We thank the two anonymous reviewers for their very constructive comments and suggestions helping to improve the quality of the manuscript.
Edited by: P. Bernath
The publication of this article is financed by CNRS-INSU.
References
Baldwin, M. P., Gray, L. J., Dunkerton, T. J., Hamilton, K., Haynes, P. H., Randel, W. J., Holton, J. R., Alexander, M. J., Hirota, I., Horinouchi, T., Jones, D. B. A., Kinnersley, J. S., Marquardt, C., Sato, K., and Takahashi, M.: The Quasi-Biennial Oscillation, Rev. Geophys., 39, 179–229, 2001.
Bertaux J.-L., Hauchecorne, A., Dalaudier, F., Cot, C., Kyr¨ol¨a, E., Fussen, D., Tamminen, J., Leppelmeier, G.-W., Sofieva, V., Has-sinen, S.,Fanton d’Andon, O., Barrot, G., Mangin, A., Th´eodore, B., Guirlet, M., Korablev, O., Snoeij, P., R. Koopman, R., and Fraisse, R.: First results on GOMOS/ENVISAT, Adv. Space Res., 33(7), 1029–1035, 2004.
Bertaux, J.-L., Kyr¨ol¨a, E., Fussen, D., Hauchecorne, A., Dalaudier, F., Sofieva, V., Tamminen, J., Vanhellemont, F., Fanton d’Andon, O., Barrot, G., Mangin, A., Blanot, L., Lebrun, J.-C., Fehr, T., Saavedra, L., and Fraisse, R. : Global Ozone Monitoring By Oc-cultation Of Stars: An Overview Of Gomos Measurements On Envisat, Atmos. Chem. Phys. Discuss., 10, 9917–10076, 2010, http://www.atmos-chem-phys-discuss.net/10/9917/2010/. Brasseur, G. P. and Solomon, S.: Aeronomy of the middle
atmo-sphere: chemistry and physics of the stratosphere and meso-sphere, third edition, Springer, Dordrecht, The Netherlands, 271–358, 2005.
Butchart, N., Scaife, A. A., Austin, J., Hare, S. H. E., and Knight, J. R.: Quasi-biennial oscillation in ozone in a cou-pled chemistry-climate model, J. Geophys. Res., 108, 4486, doi:10.1029/2002JD003004, 2003.
Chipperfield, M. P., Gray, L. J., Kinnersley, J. S., and Zawodny, J.: A two-dimensional model study of the QBO signal in SAGE II NO2and O3, Geophys. Res. Lett., 21, 589–592, 1994.
Dunkerton, T. J.: Quasi-biennial and sub-biennial variations of stratospheric trace constituents derived from HALOE observa-tions, J. Atmos. Sci., 58, 7–25, 2001.
Fadnavis, S. and Beig, J.: Quasibiennial Oscillation in Ozone and Temperature over Tropics, J. Atmos. Sol. Terr. Phys., 71, 1450– 1455, doi:10.1016/j.jastp.2008.11.012, 2009.
Gray, L. J. and Pyle J. A.: A two dimensional model of the quasi-biennial oscillation of ozone, J. Atmos. Sci., 46, 203–220, 1989. Hasebe, F.: Quasi-biennial oscillations of ozone and diabatic circu-lation in the equatorial stratosphere, J. Atmos. Sci., 51, 729–754, 1994.
Hauchecorne, A., Bertaux, L., Dalaudier, F., Cot, C., Lebrun J.-C., Bekki, S., Marchand, M., Kyr¨ol¨a, E., Tamminen, J., Sofieva, V., Fussen, D., Vanhellemont, F., Fanton d’Andon, O., Barrot, G., Mangin, A., Th´eodore, B., Guirlet, M., Snoeij, P., Koop-man, R., Saavedra de Miguel, L., Fraisse, R., and Renard, J.-B.: GOMOS NO2 NO3: First simultaneous global clima-tologies of night-time stratospheric NO2and NO3observed by GOMOS/ENVISAT in 2003, J. Geophys. Res., 110, D18301, doi:10.1029/2004JD005711, 2005.
Hedin, A. E.: Extension of the MSIS thermosphere model into the middle and lower atmosphere, J. Geophys. Res., 96, 1159–1162, 1991.
Hollandsworth, S. M., Bowman, K. P., and McPeters, R. D.: Obser-vational study of the quasi-biennial oscillation in ozone, J. Geo-phys. Res., 100, 7347–7361, 1995.
Jin, J. J., Semeniuk, K., Beagley, S. R., Fomichev, V. I., Jonsson, A. I., McConnell, J. C., Urban, J. , Murtagh, D., Manney, G. L., Boone, C. D., Bernath, P. F., Walker, K. A., Barret, B., Ricaud,
P., and Dupuy, E.: Comparison of CMAM simulations of carbon monoxide (CO), nitrous oxide (N2O), and methane (CH4) with observations from Odin/SMR, ACE-FTS, and Aura/MLS, At-mos. Chem. Phys., 9, 3233–3252, doi:10.5194/acp-9-3233-2009, 2009.
Kyr¨ol¨a, E., Tamminen, J., Leppelmeier, G. W., Sofieva, V., Hassinen, S., Sepp¨al¨a, A., Verronen, P. T., Bertaux, J.-L., Hauchecorne, A., Dalaudier, F., Fussen, D., Vanhellemont, F. Fanton d’Andon, O., Barrot, G., Mangin, A., Theodore, B., Guir-let, M., Koopman, R., Saavedra, L., Snoeij, P., and Fehr, T.: Nighttime ozone profiles in the stratosphere and mesosphere by the Global Ozone Monitoring by Occultation of Stars on Envisat, J. Geophys. Res., 111, D24306, doi:10.1029/2006JD007193, 2006.
Lindzen, R. S., and Holton, J. R.: A theory of the quasi-biennial oscillation, J. Atmos. Sci., 25, 1095-1107, 1968.
Logan, J. A., Jones, D. B. A., Megretskaia, I. A., Oltmans, S. J. Johnson, B. J., V¨omel, H., Randel, W. J., Kimani, W., and Schmidlin, F. J.: Quasi-biennial oscillation in tropical ozone as revealed by ozonesonde and satellite data, J. Geophys. Res., 108(D8), 4244, doi:10.1029/2002JD002170, 2003.
Marchand, M., Bekki, S., Lef`evre, F., and Hauchecorne, A.: Tem-perature retrieval from stratospheric O3and NO3GOMOS data, Geophys. Res. Lett., 34, L24809, doi:10.1029/2007GL030280, 2007.
Naujokat, B.: An update of the observed quasi-biennial oscillation of the stratospheric winds over the tropics, J. Atmos. Sci., 43, 1873–1877, 1986.
Randel, W. and F. Wu, F.: Isolation of the ozone QBO in SAGE II data by singular-value decomposition, J. Atmos. Sci., 53, 2546– 2559, 1996.
Reed, R. J.: A tentative model of the 26 month-oscillation in tropi-cal latitudes, Quart. J. Roy. Meteorol. Soc., 105, 441–466, 1964. Schoeberl, M. R., Douglass, A. R., Newman, P. A., Lait, L. R., Lary, D., Waters, J., Livesey, N., Froidevaux, L., Lambert, A., Read, W., Filipiak, M. J., and Pumphrey, H. C.: QBO and an-nual cycle variations in tropical lower stratosphere trace gases from HALOE and Aura MLS observations, J. Geophys. Res., 113, D05301, doi:10.1029/2007JD008678, 2008.
Tian, W., Chipperfield, M. P., Gray, L. J., and Zawodny, J. M.: Quasi-biennial oscillation and tracer distributions in a cou-pled chemistry-climate model, J. Geophys. Res., 111, D20301, doi:10.1029/2005JD006871, 2006.
Zawodny, J. M. and McCormick, M. P.: Stratospheric Aerosol and Gas Experiment II: Measurements of the quasi-biennial oscilla-tion in ozone and nitrogen dioxide, J. Geophys. Res., 96, 9371– 9377, 1991.