HAL Id: hal-00317038
https://hal.archives-ouvertes.fr/hal-00317038
Submitted on 1 Jan 2003
HAL is a multi-disciplinary open access
archive for the deposit and dissemination of
sci-entific research documents, whether they are
pub-lished or not. The documents may come from
teaching and research institutions in France or
abroad, or from public or private research centers.
L’archive ouverte pluridisciplinaire HAL, est
destinée au dépôt et à la diffusion de documents
scientifiques de niveau recherche, publiés ou non,
émanant des établissements d’enseignement et de
recherche français ou étrangers, des laboratoires
publics ou privés.
Reconstructing the long-term cosmic ray intensity:
linear relations do not work
K. Mursula, I. G. Usoskin, G. A. Kovaltsov
To cite this version:
K. Mursula, I. G. Usoskin, G. A. Kovaltsov. Reconstructing the long-term cosmic ray intensity: linear
relations do not work. Annales Geophysicae, European Geosciences Union, 2003, 21 (4), pp.863-867.
�hal-00317038�
Annales
Geophysicae
Reconstructing the long-term cosmic ray intensity: linear relations
do not work
K. Mursula1, I. G. Usoskin2, and G. A. Kovaltsov3
1Department of Physical Sciences, P.O.B. 3000, FIN-90014, University of Oulu, Finland
2Sodankyl¨a Geophysical Observatory (Oulu unit), P.O.B. 3000, FIN-90014, University of Oulu, Finland 3Ioffe Physical-Technical Institute, RU-194021, St. Petersburg, Russia
Received: 21 February 2002 – Revised: 3 October 2002 – Accepted: 18 October 2002
Abstract. It was recently suggested (Lockwood, 2001) that
the cosmic ray intensity in the neutron monitor energy range is linearly related to the coronal source flux, and can be re-constructed for the last 130 years using the long-term coronal flux estimated earlier. Moreover, Lockwood (2001) recon-structed the coronal flux for the last 500 years using a simi-lar linear relation between the flux and the concentration of cosmogenic10Beisotopes in polar ice. Here we show that the applied linear relations are oversimplified and lead to un-physical results on long time scales. In particular, the cos-mic ray intensity reconstructed by Lockwood (2001) for the last 130 years has a steep trend which is considerably larger than the trend estimated from observations during the last 65 years. Accordingly, the reconstructed cosmic ray intensity reaches or even exceeds the local interstellar cosmic ray flux around 1900. We argue that these unphysical results obtained when using linear relations are due to the oversimplified ap-proach which does not take into account the complex and essentially nonlinear nature of long-term cosmic ray mod-ulation in the heliosphere. We also compare the long-term cosmic ray intensity based on a linear treatment with the re-construction based on a recent physical model which predicts a considerably lower cosmic ray intensity around 1900.
Key words. Interplanetary physics (cosmic rays; heliopause
and solar wind termination) – Geomagnetism and paleomag-netism (time variations, secular and long-term)
1 Introduction
Recently, Lockwood et al. (1999) and Lockwood (2001) (to be called here L01) estimated the coronal source flux Fs for the time after 1868 using the geomagnetic aa index. L01 also reconstructed the intensity of cosmic rays (CR) during that period using a simple linear relation between Fsand cos-mic rays (as measured by the Climax neutron monitor with a geomagnetic cutoff rigidity of about 3 GV). First, they
calcu-Correspondence to: K. Mursula ([email protected])
lated the linear relation between Fs and CR intensity for the neutron monitor (NM) era after 1951. Then, this linear rela-tion was used to reconstruct the CR intensity for the longer period since 1868, using the coronal flux estimated earlier.
Lockwood (2001) also assumed a linear relation to exist between Fs and the concentration of cosmogenic10Be iso-topes in polar ice.10Beconcentration responds mainly to the flux of cosmic rays with an energy of several GeV (Masarik and Beer, 1999; McCracken and McDonald, 2001). Accord-ingly, it is a good proxy of cosmic rays of the NM energy range (Beer, 2000). Calculating the linear relation between
Fs and10Be data for the period 1868–1985, L01 then ex-trapolated this relation to the whole period covered by the
10Berecord, thus reconstructing the very long-term F
s pro-file since 1423. This reconstructed Fswas suggested in L01 to form a new index of solar activity for very early times. It is important to note that only linear relations between the different solar/heliospheric parameters were used in L01.
Recently, we have also reconstructed the CR intensity in the past as measured by NM and by 10Be(Usoskin et al., 2002a, to be called here U02). In that work we used a phys-ical model rather than empirphys-ical linear relations, leading to quite different results from L01. In this paper we discuss the two CR reconstructions and show that the linear relations that were assumed in L01 between Fs and cosmic rays (or their proxies) are oversimplified and lead to unreliable results. In Sect. 2 we discuss the reconstruction of cosmic ray intensity used in L01 and in U02 for the last 130 years. In Sect. 3 we re-analyse the results obtained in L01 from the10Beseries. Finally, in Sect. 4 we give our conclusions and final remarks.
2 Cosmic ray reconstruction
2.1 Linear reconstruction
L01 reconstructed the CR intensity in the past using a simple linear relation between the calculated coronal magnetic flux
864 K. Mursula et al.: Linear relations do not work for cosmic rays 2 3 4 5 1850 1900 1950 Fs (10 14 Wb)
Fig. 1. The coronal source flux Fs calculated by the method of
Lockwood et al. (1999) from the geomagnetic aa series (black curve) and reconstructed from the10Beseries (grey curve). The curves are 11-year running mean values.
then extrapolated it back in time. In order to repeat the recon-struction presented in L01, we have calculated the coronal source flux Fssince 1868 from the aa index using the recipe published by Lockwood et al. (1999). This Fs series is de-picted in Fig. 1. We note that it corresponds exactly to the coronal source flux calculated and shown in L01 (see Fig. 2a of L01). Similar to L01, we find the following linear regres-sion between the annual values of Climax NM data CR(NM) and the calculated Fsflux for the period of 1951–1999,
CR(N M) = (5.25 ± 0.11) − (0.28 ± 0.025) · Fs, (1) where CR(NM) is given in counts/h/105and Fsin 1014W b. This coincides with the regression obtained in L01. Using this linear regression, we have calculated the CR(NM) series since 1868 from the Fsseries, similar to L01. (Note also that the geomagnetic cutoff rigidity has been assumed to remain constant when Eq. (1) is extrapolated over long time scales.) The reconstructed CR(NM) series is shown as a dotted line in Fig. 2, together with the 1σ error. This series is also in a good agreement with the results presented in L01 (see, e.g. Fig. 10 of L01).
2.2 Physical modeling
In the recent CR reconstruction (U02) we used the following logical chain
SA−→(1) Fs (2)
−→8−→(3) S−→(4) CR(N M). (2) So first, using the model by Solanki et al. (2000, 2002), we calculate the coronal source magnetic flux Fs from sunspot activity SA (step 1 in Eq. 2). In step 2 we use the power-law relation between Fsand the modulation strength 8 (Gleeson and Axford, 1968) derived by Usoskin et al. (2002a). Next, using our stochastic simulation model of CR transport in the heliosphere (Usoskin et al., 2002b), we calculate the modu-lated CR spectra S at the Earth’s vicinity (step 3). Finally, we calculate the NM count rate as an integral of a product of
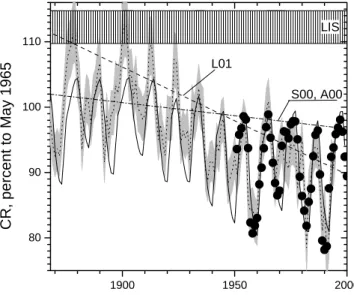
1900 1950 2000 80 90 100 110 S00, A00 L01 LIS CR, percent to May 1965
Fig. 2. Climax NM count rates (in percent to May 1965).
Dot-ted curve with grey shading denotes the count rate reconstrucDot-ted from the Fs series in L01. Solid curve denotes the reconstruction by Usoskin et al. (2002a). Solid circles correspond to the actual Climax NM count rates for 1951–2000. The hatched LIS area cor-responds to an estimate of the local interstellar CR spectrum with uncertainties. Dashed L01 and dash-dotted S00, A00 lines repre-sent the trend estimated for L01 reconstruction and the largest pos-sible negative trend according to Ahluwalia (2000); Stozhkov et al. (2000), respectively.
the modulated spectrum S and the specific yield function Y (step 4)
CR(N M) = Z ∞
Pc
S(P ) · Y (P ) · dP , (3) where Pcis the local rigidity cutoff and P the CR particle’s rigidity. Note that the integrand of Eq. (3) corresponds to the differential NM response function (Moraal et al., 2000). The CR intensity (in Climax NM count rates) so reconstructed is shown in Fig. 2 as the solid curve. In U02, we also recon-structed the10Becontent in polar ice, and our results are in good agreement with both measured10Bedata (Beer et al., 1990; Bard et al., 1997) and calculations by McCracken and McDonald (2001).
2.3 Comparison of the results
Let us now analyse the two long-term CR intensity recon-structions depicted in Fig. 2 in more detail. Both depict clearly higher CR intensities around 1900 than nowadays. L01 estimated that “...the average fluxes of CR above 3 GeV were approximately 15% higher in 1900 than they are now.” On the other hand, the U02 CR reconstruction yields only a 7–8% increase in the Climax NM count rate around 1900. The long-term CR trend has been approximated in differ-ent ways. Note that the CR intensity around solar minima corresponds to a residual modulation in a quiet heliosphere. Stozhkov et al. (2000) calculated the trend in the residual
modulation when trying to estimate the stability of CR in-tensity outside the heliosphere. They found that this trend is
−0.04 ± 0.04%/year for the Climax NM data after 1953 and attributed it to a possible supernova explosion in the vicin-ity of the solar system. This trend is depicted as a dash-dotted line in Fig. 2. The CR data recorded by ion chambers since 1937 imply (Ahluwalia, 2000; Stozhkov et al., 2001; McCracken, 2001) that the CR trend was not steeper than the above estimate. The trend calculated similarly from the CR(NM) series reconstructed by L01, depicted as the dashed line in Fig. 2, is much steeper, about −0.16 ± 0.07%/year. The ratio of this trend and the trend estimated by Stozhkov et al. (2000) is about 4 (ranging roughly from 2 to 6). On the other hand, the trend calculated from the U02 CR(NM) series is only −0.025 ± 0.03%/year, in agreement with the results by Ahluwalia (2000); Stozhkov et al. (2000). Accordingly, since this result is based on the observed changes in solar ac-tivity, there is no need to introduce an additional effect by a supernova explosion, as suggested by Stozhkov et al. (2000).
An absolute upper bound for CR(NM) can be found from the local interstellar spectrum (LIS) of cosmic rays outside the heliospheric boundary (termination shock). It corre-sponds to the NM count rate if the Earth were located out-side the heliosphere, i.e. the case of no heliospheric modula-tion, and can be calculated if the modulated CR spectrum in Eq. (3) is substituded by SLIS. This upper bound was
calculated by Usoskin et al. (2002b) with the LIS given by Burger et al. (2000) and the Climax NM specific yield func-tion according to Debrunner et al. (1982) and Nagashima et al. (1989). We note that other estimates of LIS (see, e.g. Seo et al., 1994; Strong et al., 2000; Webber and Lockwood, 2001) are quite close to that given by Burger et al. (2000) above a few GeV energy range while they differ at lower energies. Also, there are some uncertainties related to the NM specific yield function (Clem and Dorman, 2000). Al-together, these uncertainties can lead to a few percent un-certainty in the calculated LIS, depicted by the hatched area in Fig. 2. (Possible large systematic errors are prevented by the overall normalization of the calculated NM count rates to the observed rates.) The exceedingly steep L01 trend makes the reconstructed CR intensity to reach and even exceed this upper bound during a few time intervals in the early part of the data interval. It has been suggested recently that the CR level might exceed LIS during extremely quite periods like the Maunder minimum (McCracken and McDonald, 2001). While there may be some modulation beyond the termination shock (McDonald et al., 2000), we consider here only the modulation inside the termination shock. Moreover, various indirect proxy data imply that the CR intensity was well be-low the LIS limit around 1900 (O’Brien et al., 1991; Bonino et al., 2001; McCracken and McDonald, 2001; Scherer et al., 2001). All these results are contrary to the steep trend ob-tained in L01 but are in accordance with the results presented in U02. 1873-1980 1873-1903 1944-1980 1903-1944 2.0 3.0 4.0 5.0 0.5 1 10 1.5 Be (104 atom/g) Fs (10 14 Wb)
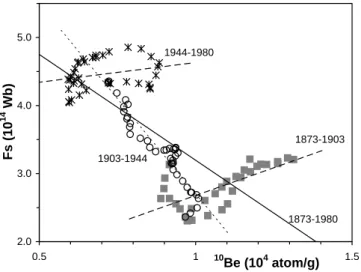
Fig. 3. Scatter plot of annual 11-year running mean values of Fsvs.
10Beconcentration for 1873–1980. Solid line represents the best
linear regression for the entire period while squares and dashed line, open circles and dotted line, and asterisks and dashed line depict points and the best linear regression for 1873–1903, 1903–1944 and 1944–1980, respectively.
3 Fsvs. cosmogenic10Beisotopes
The linear relation between Fs and CR(NM) was established in L01 during the last 50 years when the coronal source mag-netic flux was much stronger than 130 years ago (Lockwood et al., 1999; Solanki et al., 2000). Therefore, Lockwood (2001) used the cosmogenic10Beisotope (Beer, 2000) as a proxy for long-term CR intensity in the past with the follow-ing linear relation between the annual 11-year runnfollow-ing mean values of10Beand Fs for the time interval 1873–1980:
Fs =(6.3 ± 0.3) − (3.1 ± 0.4) · CBe, (4)
where CBeis given in 104atoms/g. We have used this linear relation to reconstruct Fs from10Bedata for the period of 1873–1980. The obtained Fs series is depicted in Fig. 1. We note that this reconstruction is in good agreement with the results presented in L01. (see, e.g. the latter part of Fig. 14 there.)
One can see in Fig. 1 that, despite some similarity in the in-creasing trend, the source flux reconstructed from CBe(grey curve) is in disagreement with the flux derived from the aa index (black curve). It is interesting to note that the relation between Fs and CBeis strongly inhomogeneous. Figure 3 studies this relation by depicting the scatter plot separately for three periods. During periods 1873–1903 and 1944– 1980, when Fswas roughly stable (see Fig. 1), the correlation between Fsand CBeis slightly positive. (The slope of regres-sion in Eq. (4) is 1.6±0.3 and 0.5±0.4, respectively.) This is also seen in Fig. 1 as a rough antiphase relation between the
Fs reconstructed from10Beand the “original” source flux. This may be related to an effect suggested by McCracken and McDonald (2001) that the10Belevel can grow slowly
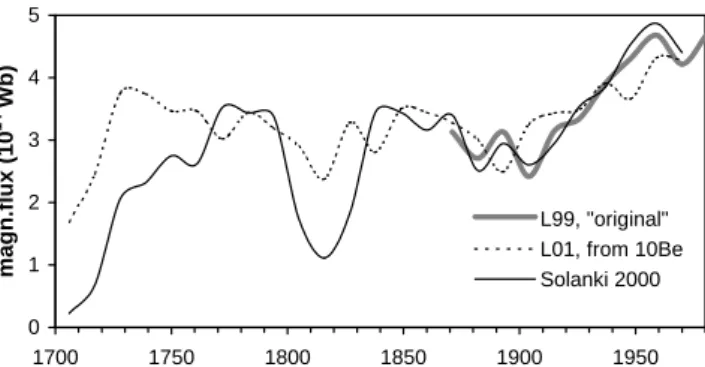
866 K. Mursula et al.: Linear relations do not work for cosmic rays 0 1 2 3 4 5 1700 1750 1800 1850 1900 1950 magn.flux (10 14 Wb) L99, "original" L01, from 10Be Solanki 2000
Fig. 4. 11-year running mean solar magnetic fluxes: the “original”
coronal source flux Fsby Lockwood et al. (1999), Fsreconstructed by L01 from10Beseries, and the open solar magnetic flux Fo re-constructed by Solanki et al. (2000).
during constant solar activity times due to a replenishment of the slowly reacting heliosheath.
The two stable periods were intervened by a period of a fast monotonous increase of Fs in 1903–1944. The corre-lation for that period is strongly negative, with a slope of
−5.5 ± 0.3. Accordingly, the relation between Fs and CBe is completely different for stable periods and for periods of a fast monotonous change. Thus, no overall linear relation between Fs and CR intensity exists, and the derived linear regression coefficients strongly depend on the chosen time interval. Therefore, the linear procedure of reconstructing Fs from the10Beseries, as suggested in L01, is questionable.
Recently, the open solar magnetic flux Fo, which is about twice Fs, was calculated by Solanki et al. (2000) for the pe-riod after Maunder minimum using sunspot number series (see Fig. 4). Although the (scaled) Fo series is close to the “original” Fs series by Lockwood et al. (1999) (correlation coefficient for 11-year averages is r = 0.98+−0.010.05 in 1868– 1986); it is quite different from the Fs series reconstructed from 10Be (r = 0.6+−0.10.2 since 1700). As seen in Fig. 4, the difference between the magnetic flux reconstructions by L01 and by Solanki et al. (2000) is particularly large soon af-ter Maunder minimum and during the Dalton minimum, i.e. when the solar activity has been exceptionally low. This is another demonstration of the problems which arise when lin-ear relations are extrapolated beyond the range of values for which they were established.
4 Concluding remarks
We have shown that the long-term reconstruction of cosmic ray intensity for the last 130 years using a linear relation with the estimated solar coronal magnetic flux Fs (Lockwood, 2001) leads to unphysical results. For example, the CR in-tensity in the Earth’s vicinity is restricted to remain below an upper bound corresponding to the local interstellar spectrum, which is not obeyed within the framework of linear relations. This situation can be understood from two points of view. From a mathematical point of view, extrapolating a
regres-sion far beyond the range where it has been established is not straightforward. In particular, the heliospheric CR modula-tion is very complicated and significantly nonlinear, and may be approximated by a linear regression only within a very limited interval. For example, the relation between Fs and CR was experimentally established only for the last 45 years when Fs was fairly stable and high. Then it was extended linearly by Lockwood (2001) for the last 130 years, over a time interval which includes periods of rapid changes of Fs and periods of stable but much lower Fsvalues than observed in recent times.
From a physical point of view, a linear influence of the coronal source flux (i.e. the intensity of the interplanetary magnetic field) on the cosmic ray intensity is oversimplified. While the interplanetary magnetic field is important for he-liospheric CR modulation (Cane et al., 1999; Belov, 2000), the expected effect on cosmic rays is via the diffusion coef-ficient and is expected to be quite nonlinear. Moreover, the transport of cosmic rays in the heliosphere is also affected by other, non-negligible mechanisms like the heliospheric neu-tral sheet, interaction/rarefaction regions, drifts, IMF polar-ity, etc. (see, e.g. Potgieter et al., 1998; Belov, 2000, and references therein). These factors further strengthen the es-sentially nonlinear dependence of the long-term cosmic ray intensity on its main drivers, in particular the coronal source flux. We have demonstrated in this paper that the nonlin-ear dependence is already essential during the last 130 ynonlin-ears, which invalidates the application of linear relations over this time interval. Therefore, the cosmic ray intensity as recon-structed by Lockwood (2001) after 1868 is not reliable. Since the nonlinear effects are even more important for still longer time intervals, the reconstruction of the very long-term coro-nal source flux after 1423 from the cosmogenic10Beisotopes is even more doubtful.
Acknowledgements. We thank the Academy of Finland for
finan-cial support. IGU acknowledges INTAS grant YSF 00-82. Chigaco University (NSF Grant ATM-9912341) and NOAA data center are acknowledged for Climax NM and aa index data, respectively.
Topical Editor E. Antonucci thanks a referee for their help in evaluating this paper.
References
Ahluwalia, H. S.: On galactic cosmic ray flux decrease near solar minima and IMF intensity, Geophys. Res. Lett., 27, 1603-1606, 2000.
Bard, E., Raisbek, G. M., Yiou, F., and Jouzel, J.: Solar modulation of cosmogenic nuclide production over the last millenium: com-parison between14C and10Berecords, Earth and Planet. Sci. Lett., 150, 453–462, 1997.
Beer, J., Blinov, A., Bonani, G., et al.: Use of10Bein polar ice to trace the 11-year cycle of solar activity, Nature, 347, 164–166, 1990.
Beer, J.: Neutron monitor records in broader historical context, Space Sci. Rev., 93, 107–119, 2000.
Belov, A. V.: Large scale modulation: View from the Earth, Space Sci. Rev., 93, 79–105, 2000.
Bonino, G., Cini Castagnoli, G., . Cane, D, Taricco, C., and Bhan-dari, N.: Solar modulation of the galactic cosmic ray spectra since the Maunder minimum, Proc. 27th Internat. Cosmic Ray Conf., Hamburg, 9, 3769–3762, 2001.
Burger, R. A., Potgieter, M. S., and Heber, B.: Rigidity depen-dence of cosmic ray proton latitudinal gradients measured by the Ulysses spacecraft: Implication for the diffusion tensor, J. Geo-phys. Res., 105, 27 447–27 455, 2000.
Cane, H. V., Wibberenz, G., Richardson, I. G., and von Rosenvinge, T. T.: Cosmic ray modulation and the solar magnetic field, Geo-phys. Res. Lett., 26, 565–568, 1999.
Clem, J. M. and Dorman, L. I.: Neutron monitor response functions, Space Sci. Rev., 93, 335–359, 2000.
Debrunner H., Flueckiger, E., and Lockwood, J. A.: Proc. 8th Eu-rop. Cosmic Ray Symp., Rome, 1982.
Gleeson L. J. and Axford, W. I.: Solar Modulation of Galactic Cos-mic Rays, Astrophys. J., 154, 1011–1026, 1968.
Lockwood, M.: Long-term variations in the magnetic field of the Sun and the heliosphere: the origin, effects and implications, J. Geophys. Res., 106 (A8), 16 021–16 038, 2001.
Lockwood M., Stamper, R., and Wild, M. N.: A doubling of the Sun’s coronal magnetic field during the past 100 years, Nature, 399, 437–439, 1999.
Masarik, J. and Beer, J.: Simulation of particle fluxes and cosmo-genic nuclide production in the Earth’s atmosphere, J. Geophys. Res. 104 (D10), 12 099–12 111, 1999.
McCracken, K. G.: Variations in the production of10Be due to the 11 year modulation of the cosmic radiation, and variations in the vector geomagnetic dipole, Proc. 27t hInternat. Cosmic Ray Conf., Hamburg, 10, 4129–4132, 2001.
McCracken, K. G. and McDonald, F. B.: The long term modulation of the galactic cosmic radiation, 1500–2000, Proc. 27th Internat. Cosmic Ray Conf., Hamburg, 9, 3753–3756, 2001.
McDonald, F. B., Heikkila, B., Lal, N., and Stone, E. C.: The rel-ative recovery of galactic and anomalous cosmic rays in the dis-tant heliosphere: Evidence for modulation in the heliosheath, J. Geophys. Res., 105 (A1), 1–8, 2000.
Moraal, H., Belov, A., and Clem, J. M.: Design and co-ordination of multi-stational international neutron monitor network, Space Sci. Rev., 93, 285–303, 2000.
Nagashima K., Sakakibara, S., Murakami, K., and Morishita, I.: Re-sponse and yield functions of neutron monitor, Galactic cosmic ray spectrum and its solar modulation, derived from all the avail-able world-wide surveys, Nuovo Cimento, 12 (C2), 173–209,
1989.
O’Brien, K., De La Zerda Lerner, A., Shea, M. A., and Smart, D. F.: The production of cosmogenic isotopes in the Earth’s atmo-sphere and their inventories, in: The Sun in time, (Eds) Sonnet, C. P., Giampapa, M. S., and Matthews, M. S., the University of Arizona, Tucson, p. 317–343, 1991.
Potgieter, M. S.: The Modulation of Galactic Cosmic Rays in the Heliosphere: Theory and Models, Space Sci. Rev., 83, 147–158, 1998.
Scherer, K., Fichtner, H., Stawicki, O., and Fahr, H. J.: Cosmogenic element production in meteorites – the influence of long-term variation in heliospheric structure, Proc. 27th Internat. Cosmic Ray Conf., Hamburg, 10, 4031–4034, 2001.
Seo, E. S., McDonald, F. B., Lal, N., and Webber, W. R.: Study of cosmic-ray H and He isotopes at 23 AU, Astrophys. J., 432, 656–664, 1994.
Solanki, S. K., Sch¨ussler, M., and Fligge, M.: Evolution of the Sun’s large-scale magnetic field since the Maunder minimum, Nature, 408, 445–447, 2000.
Solanki, S. K., Sch¨ussler, M., and Fligge, M.: Secular variation of the Sun’s magnetic flux, Astron. Astrophys., 383, 706–712, 2002.
Stozhkov, Y. I., Pokrevsky, P. E., and Okhlopkov, V. P.: Long-term negative trend in cosmic ray flux, J. Geophys. Res., 105, 9–17, 2000.
Stozhkov, Y. I., Svirzhevsky, N. S., Makhmutov, V. S., et al.: Long-term cosmic ray observations in the atmosphere, Proc. 27th In-ternat. Cosmic Ray Conf., Hamburg, 9, 3883–3886, 2001. Strong, A. W., Moskalenko, I. V., and Reimer, O.: Diffuse
Contin-uum Gamma Rays from the Galaxy, Astrophys. J., 537, 763–784, 2000.
Usoskin, I. G., Mursula, K., Solanki, S., Sch¨ussler, M., and Ko-valtsov, G. A.: A physical reconstruction of cosmic ray intencity since 1610, J. Geophys. Res., 107 (A11), SSH 13-1–13-6, doi: 10.1029/2002JA009343, 2002a.
Usoskin, I. G., Alanko, K., Mursula, K., and Kovaltsov, G. A.: He-liospheric modulation strength during the neutron monitor era, Solar Phys., 207, 389–399, 2002b.
Webber, W. R. and Lockwood, J. A.: Voyager and Pioneer space-craft measurements of cosmic ray intensities in the outer helio-sphere: Toward a new paradigm for understanding the global so-lar modulation process: 1. Minimum soso-lar modulation (1987 and 1997), J. Geophys. Res., 106 (A12), 29 323–29 332, 2001.