HAL Id: hal-02699042
https://hal.archives-ouvertes.fr/hal-02699042
Submitted on 1 Jun 2020
HAL is a multi-disciplinary open access
archive for the deposit and dissemination of sci-entific research documents, whether they are pub-lished or not. The documents may come from teaching and research institutions in France or abroad, or from public or private research centers.
L’archive ouverte pluridisciplinaire HAL, est destinée au dépôt et à la diffusion de documents scientifiques de niveau recherche, publiés ou non, émanant des établissements d’enseignement et de recherche français ou étrangers, des laboratoires publics ou privés.
radiative analysis of photoreactors: The case study of
CdS catalyzed hydrogen production from sacrificial
donors
G. Dahi, A. Eskandari, J. Dauchet, F. Gros, M. Roudet, Jean-François Cornet
To cite this version:
G. Dahi, A. Eskandari, J. Dauchet, F. Gros, M. Roudet, et al.. A novel experimental bench dedicated to the accurate radiative analysis of photoreactors: The case study of CdS catalyzed hydrogen produc-tion from sacrificial donors. Chemical Engineering and Processing: Process Intensificaproduc-tion, Elsevier, 2015, 98, pp.174-186. �10.1016/j.cep.2015.09.015�. �hal-02699042�
A novel experimental bench dedicated to the accurate
radiative analysis of photoreactors:
the case study of CdS catalyzed hydrogen production from sacrificial donors
G. Dahi(1,2) A. Eskandari(1,2), J. Dauchet(3,2), F. Gros(3,2), M. Roudet(3,2), J. F. Cornet(3,2) (1) Université Clermont Auvergne, Université Blaise Pascal, Institut Pascal, BP 10448, F-63000 CLERMONT-FERRAND, France
(2) CNRS, UMR 6602, IP, F-63178 AUBIERE, FRANCE
(3) Université Clermont Auvergne, ENSCCF, Institut Pascal, BP 10448, F-63000 CLERMONT-FERRAND, FRANCE
Tel : 00 33 4 73 40 53 17
Email : fabrice.gros@univ-bpclermont.fr Abstract
This article is dedicated to the presentation of a novel experimental bench designed to study the photoproduction of H2. It is composed of three main parts: a light source, a fully
equipped flat torus reactor and the related analytical system. The reactor hydrodynamic behaviour has been carefully examined and it can be considered as perfectly mixed. The photon flux density is accurately known thanks to reconciled quantum sensor and actinometry experiments. The incident photon direction is perpendicular to the reactor windows; in such a configuration the radiative transfer description may be properly approximated as a one dimensional problem in Cartesian geometry. Based on accurate pressure measurement in the gas tight photoreactor, the production rates of H2 (using CdS
particles in association with sulphide and sulfite ions as hole scavengers) are easily and trustingly obtained.
First estimations of apparent quantum yield have proven to be dependent on mean volumetric rate of radiant light energy absorbed hence demonstrating the need for the use of a radiative transfer approach to understand the observed phenomena and for the proper formulation of the thermo-kinetic coupling.
Keywords:
Experimental bench, photoreactor, H2, photocatalysis, overall quantum yield
Highlights:
A novel and accurate experimental bench for the study of photoreactions is presented. Complete characterization of the bench has been done: RTD, photon flux density… H2 production rates are accurately determined by pressure measurements.
1 Introduction
Given the scarcity of fossil resources and the constant augmentation of energy demand (between 25 and 30 TW predicted in 2050, [1]), Humanity will soon have to cope with an energetic issue together with a global warming problem due to CO2 emissions. Hence, use of
renewable resources to overcome these dramatic issues is compulsory. In particular resorting to solar energy is clearly evident as it is abundant. However this resource is fluctuating in nature (day/night alternation, season changing), it is thus necessary to convert it not only into electricity but also into storable chemical energy carriers synthesized from water and eventually CO2.
One of the most promising (and most studied) solar fuel is undoubtedly the hydrogen, H2,
(known to release high quantity of energy at combustion without CO2 generation [2]). Its
generation is often called “artificial photosynthesis” [3], expression also utilized for the synthesis of other fuels like CH4, CH3OH [4]…
Nevertheless, future H2 massive renewable production needs to eliminate a double
bottleneck. On the one hand, at a fundamental level, the synthesis of cheap and efficient photocatalysts (possibly designed with bio-inspired approach and mimicking natural photosynthesis) should be obtained, which is often called the Holy Grail of chemistry. On the other hand, considering the engineering science (our field of interest), one must succeed in developing large scale optimized and safe processes for the production of H2. Provided
breakthroughs are obtained at both levels unlocking those scientific barriers, thermodynamic efficiencies far higher than 10% could be reached. Such a value is considered as a minimum threshold of interest for the production of solar energy carriers due to competition for footprint.
Among the possibilities to produce H2 from solar energy, the implementation of a solid
photocatalyst suspended in slurry reactor would be a good technical solution. Hence numerous kinds of photoreactors are described in the literature, and used for catalyst efficiency characterisation or H2 production. They are mainly operating in batch mode [5]
presenting planar [6] or annular ([7], [8]) geometries. An external liquid circulation loop can also be used with planar photoreactor [9], [10], falling film [11] or flat plate [12]... Accurate description or modelling of photocatalytic processes requires addressing photonic phase balance (photon flux density, transmittance, radiant power absorbed …) or radiative transfer within the reactor. This crucial radiative aspect is gaining increasing interest in the community as can be seen in the work of Alfano and Cassano’s team ([13] for example) or De Lasa’s group [14]). We intend to place our approach and scientific work in this context to get preliminary information prior to establishing thermo-kinetic coupling relations between photoproduction rates and the radiation field in the photoreactor [15].
The aim of this article is therefore to present a novel experimental bench dedicated to accurate radiative analysis of photoreactor and its implementation in hydrogen production from sacrificial donors and CdS using a simple and well known photoreaction [16]. The first section will be devoted to the presentation and the characterisation of the bench and its three main components i.e. the photoreactor, its light source and the analytical devices for chemical reaction rate measurements. The second part will be focused on the model photoreaction. Experimental result analysis will be carried out according to an approach widespread in the literature but also by taking carefully into account energy balance on the photonic phase and radiative related aspects to gain insights into photochemical process.
2 Experimental devices and characterisations 2.1 Torus reactor
The photoreactor used in this study is a flat torus reactor intrapolated on the basis of a pilot plant used as photobioreactor [17] or as a chemical reactor with fully-controlled hydrodynamic conditions [18]. This geometry presents two translucent faces made of glass (or quartz for UV irradiation): the first in front of the lighting source, the second at the rear of the reactor enabling the measurement of photon flux densities (PFD) (cf. Fig.1). In such a design the radiative transfer modelling can be correctly approximated as a one-dimension problem.
(a) (b) ⑥ ⑦ ⑫ ⑧ ⑨ ⑪ ⑩ ⑬ (c) q∩∩∩∩ 2.5 cm Cylindrical stainless steel piece in the center Flow canal with square section Front window (d)
Fig. 1. (a) Scheme of the light sources LED panel or solar simulator
(b) Schematic diagram of the characterisation bench (① Flat torus reactor, ② light source, ③ thermostaVc bath, ④ gas chromatograph, ⑤ control unit)
(c) Focus on the reactor and its different parts (⑥ and ⑦ pneumaVc valves for gas phase handling, ⑧ quantum sensor for transmittance measurements, ⑨ entry of coolant, ⑩ pH probe, ⑪ temperature sensor, ⑫ stirring motor, ⑬ pressure sensor)
The torus geometry is obtained by the integration of cylindrical piece of metal in the centre of the reactor. Manufactured from a piece of 316L stainless steel, it can be seen in Fig. 1. The flow canal displays a 2.5 cm sided square section and the illuminated reactor surface, Slight, it
is equal to 59 cm².
Different lateral inlets/outlets permit the loading/draining of the reactor with liquid or gas in order to, for example, operate in continuous modes for the liquid or the gaseous phase. The insertion of probes is also possible.
A liquid circulation circuit is machined in the stainless steel piece, in parallel to the flow canal. It enables the flow of a coolant fluid (water for example) using thermostatic bath/circulator (Lauda eco RE 415); a custom built RTD Pt100 sensor (TCDirect) is laterally positioned in order to set the reactor temperature at 25.0 ± 0.1°C. A lid is located at the top of the reactor; it offers additional possibilities for inlets or outlets and a support for the mixing device. It is constituted of a micromotor 24V/DC (Minisprint Magnetic Stirrer made by Premex Reactor ag) using magnetic coupling technology that ensures gas tightness. The motor rotation speed is controlled with a digital speed display DZA-612Z. Connected to the motor by a shaft, an helical impeller makes the liquid rotate in the annular space, suspending the photocatalyst particles. Above all this torus configuration has been chosen as it is the only way to effectively obtain homogeneous catalyst suspensions in the whole reactor.
Located in the headspace of the reactor, a Keller PA 33 X pressure sensor linked to a K107 converter is used for the accurate detection of gas production via a pressure increase (relative accuracy ± 0.05%). This peculiar sensing method will be developed later in this article considering the interface between gas and liquid phases and transfer phenomenon (see also appendix). In standard operating conditions, the reactor contains a volume of
liquid, VL, equal to 155 mL (evaluated by mass measurement of the loaded liquid amount), a
headspace of volume VG equal to 35.2 mL (located at the top of the reactor and estimated by
difference between VL and the total volume of the reactor). Furthermore, the reactor
includes a small unlighted fraction at the top, fd, equal to 5%.
Two pneumatic valves (Carten CMDA250) at the inlet and outlet of the reactor allow closing and opening reactor for inerting or purging. For each experiment, leak tests have been performed with hydrogen, and measured leakage rates are proved negligible.
A micro gas chromatograph (Agilent 3000A Micro GC equipped with a 5 Å molecular sieve and argon as gas carrier) completes the system; it is positioned at the reactor gas outlet to analyse online the composition of the reactor gaseous phase.
2.2 Residence time distribution set up and results
A residence time distribution (RTD) study was carried out in order to determine the hydrodynamic behaviour of the flat torus reactor. The RTD measurements were performed by a conductimetric method (i.e. measurement of the liquid electrical conductivity after the injection of a concentrated conducting electrolyte), using a two-pole conductivity cell (CDC749, Radiometer Analytical) located in the reactor, a CDM210 conductimeter (Radiometer Analytical) linked to a data acquisition unit (34970A, Hewlett Packard) and a computer. In such a configuration, the maximal acquisition frequency is equal to 2 Hz. Experiments were done out in batch conditions, on the liquid phase, with a pulse of 0.5 mL NaCl solution (2 g.L-1) injected in the upper part of the reactor.
Once the ionic tracer pulse injected in the liquid, it is caused to circulate due to the pumping action of the impeller on the liquid. The conductivity signal measured by the probe corresponds to the superimposition of a periodic function (with a period corresponding to the circulation time, tc) on an exponential decrease due to the mixing [18] (see Fig. 2).
The relative height of peaks is due to local high concentration of tracer before its homogenization, and their number depend on axial dispersion (Dax) in the reactor. Better the
reactor is mixed during one circulation; stronger is the decay between the consecutive peaks and consequently their number decreases. At mixing time tm, the tracer is evenly distributed
throughout the reactor and its concentration is constant and equal to C∞. Fig. 2 presents
results of a typical RTD experiment.
In such experimental configuration, according to Benkhelifa et al. [18], an axial dispersed plug flow with total recirculation model can be chosen. In this model the circulation region is described by a tube wherein a certain amount of dispersion happens and complete recirculation of the flowing fluid occurs [19].
Voncken et al. [19] proposed a mathematical solution, later modified by Takao et al. [20] (Eq. 1) to this model for the dimensionless concentration evolution.
( )
∞(
)
= ∞ Θ Θ − + − Θ π = Θ 1 j 2 * 4 z j Pe exp Pe 2 1 C C (1)Hence after adimensionnalisation of experimental results, they were compared with theoretical evolution as can be seen in Fig.2 (using dimensionless variables Θ (for time) in abscissa and the ratio C(Θ)/C∞ in ordinate).
Peclet number, Pe, and circulation time, tc, were identified by comparison with experimental
results via a simplex method. The agreement between model and experiment is good, considering the limitation of our acquisition system. Thus for a 400 rpm rotation speed, a Peclet number equal to 8 was identified. For higher rotation speed, i.e. 1100 rpm, corresponding to our operating conditions in hydrogen production experiments, oscillations cannot be detected. In less than one second the tracer concentration is quasi homogeneous in the reactor.
So, the liquid phase in our flat torus reactor thus presents a high axial dispersion and a low circulation time (less than 1 s) under stirring. It can be considered to a certain extent as perfectly mixed. This crucial assumption will simplify the treatment in hydrogen production and radiative transfer analysis.
0 0.2 0.4 0.6 0.8 1 1.2 1.4 1.6 1.8 2 0 1 2 3 4 5 6 7 8 Θ (-) C (Θ )/ C∞ ( -) Experimental results Model
Fig. 2. Example of experimental results and model (Eq. 1) in RTD experiment (400 rpm)
2.3 Light source characterisation
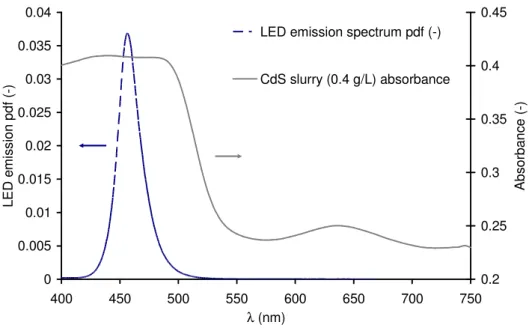
The LED panel is fabricated by Sybilux and is composed of 25 LED (Royal blue D42180, Seoul Semiconductor) equipped with lenses. It provides a blue light with an emission maximum at 457 nm wavelength (see Fig. 3.), on a 12.5×12.5 cm surface. Such a quasi-monochromatic light source has been adopted for ease of use and post treatment. Indeed the photon flux density can be easily and accurately controlled via an USB DMX controller and the Easy Stand Alone software (Nicolaudie), including 256 different setting positions to modify the electric power supplied to the LED and thus the photon flux density. For further work, we intend to use a 450 W solar simulator (model nr 91195, Oriel) with neutral filters (Oriel series).
0 0.005 0.01 0.015 0.02 0.025 0.03 0.035 0.04 400 450 500 550 600 650 700 750 λ (nm) L E D e m is s io n p d f (-) 0.2 0.25 0.3 0.35 0.4 0.45 A b s o rb a n c e ( -)
LED emission spectrum pdf (-)
CdS slurry (0.4 g/L) absorbance
Fig. 3. LED emission probability density function (left ordinate axis) and CdS slurry absorbance (right ordinate axis) spectra
In order to get reliable data on photochemical process, the hemispherical incident photon flux densities (PFD), q∩, in (expressed in μmol.m-2.s-1) was determined via two ways. Firstly it
was estimated by a physical method using a LiCOR quantum sensor (LI-190) connected to a LI-189 display. As a preliminary work, q∩ was measured on 56 points on a parallel planes at
different distances from the LED panel. The incident photon flux densities in the region of interest (circulation canal of liquid) were also evaluated using a 16 hole mask behind which the quantum sensor was positioned. This physical method permits the determination of the mean value and the geometric standard deviation of the photon flux densities in the region of interest for a given software settings.
The second method is the actinometry where a chemical actinometer undergoes a light-induced reaction (at a certain wavelength, λ) for which the quantum yield, Φλ, is accurately
photon flux density (instead of averaging measures obtained in several positions in the sensor method) or the calculation of the absorbed photon flux [21].
2.3.1. Physical method
A preliminary work has been carried out to set the optimal working distance between the LED panel and the reactor. We concluded from that study that a short distance (few centimetres) implies a non homogeneous photon flux density due to point source of the LED, and a too long gap (20-50 cm) enlarges needlessly the process. Hence the work distance was set to 15 cm. Besides, via this preliminary work, the light source could be assumed as quasi-collimated in the modelling procedure.
As previously explained, the mean photon flux densities and their standard deviations were estimated in the region of interest via 16 measurement points. In the same way as mean flux density, standard deviation increases with the Easy Stand Alone software settings, the relative uncertainty remains constant and equal to 11%, it may appear high but this finding is mainly due to edge effect, the LED panel having only 5 LEDs in height and width.
2.3.2. Chemical method
The Reinecke’s salt Cr(NH3)2(SCN)4- (supplied by Sigma Aldrich) has been chosen in this study
as the actinometer as proposed by Wegner and Adamson [22] and later modified by Cornet et al. [23]. Its decomposition Eq. (2), with a constant quantum yield (equal to 0.31 in the LED emission spectrum), generates thiocyanate ions whose concentration can be determined spectrophotometrically, according to the protocol presented in [23].
O H ) SCN ( ) NH ( Cr SCN ) SCN ( ) NH ( Cr 3 2 3 2 O H , h 4 2 3 2 → + − υ − (2)
In this work, the analytical developments used for q∩, in assessment were improved by
proportion of photons absorbed by the by-product as explained in [24]. The photon flux density, q∩, in, was identified by comparing experimental results and model, the standard
deviation on the identified value was estimated to 4%. A more detailed explanation of these new developments for Reinecke salt actinometry will be the object of another publication [25].
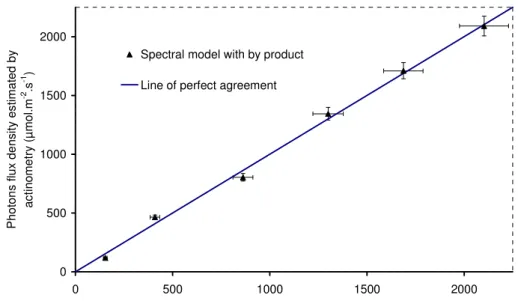
Fig. 4. represents the parity chart between the photon flux density estimated by the two methods (physical and chemical) in the whole operating range of the LED panel.
0 500 1000 1500 2000 0 500 1000 1500 2000
Photons flux density measured by quantum sensor (µmol.m-2.s-1)
P h o to n s f lu x d e n s it y e s ti m a te d b y a c ti n o m e tr y ( µ m o l. m -2 .s -1 )
Spectral model with by product Line of perfect agreement
Fig. 4. Parity chart of identified values of hemispherical photon flux density, q∩, in, obtained
in actinometry and mean values measured by quantum sensor
The results obtained by the two methods are in very good agreement. The photons flux densities being accurately known, this step allowed us to determine with confidence the boundary conditions of our system, i.e. the hemispherical photon flux density, q∩, in.
2.3.3. Estimation of exiting photon flux density and slurry transmittance
As already explained, the particular feature of our torus reactor is to include a rear glass window (see Fig. (1)). This enables the measurement (with the LiCOR quantum sensor) of the mean uncorrected photon flux density outgoing the reactor, q∩, out uncorrected, over the entire
window area with the same 16 hole mask as for q∩, in estimation. The correction of rear glass
absorptance has been taken into account, using laws of geometrical optics for the quasi-collimated case, to correctly estimate the mean photon flux density outgoing the slurry, q∩, out (q∩, out = q∩, out uncorrected/ Τglass). A mean slurry transmittance, τ, could be then estimated
(Eq. 3), from which energy balance on the photonic phase and absorptance calculation can be performed. in , out , q q ∩ ∩ = τ (3)
2.4. Reaction rate measurement
In this work, the estimations of reaction rates are performed by an accurate pressure measurement as already used by [10]. This method achieves an accuracy and a reliability far higher [26] than those obtained by gas balance using specific analyser or gas chromatography [5] and even more than those estimated with volumetric method, as often used in estimation of hydrogen production (see [27] for example). At a constant temperature, known gas and liquid volumes and considering that equilibrium is reached between gas and liquid phases (see appendix), the mean production rate for a given gas can be deduced from pressure variation inside the reactor associated with a mass balance on H2
component: dt dP ) T ( H 1 RT V V r gas L G gas + = > < (4)
At a constant temperature and at a steady photon flux density, pressure increases linearly with time during H2 evolution. In this case, it is easy to estimate
2
H
r from the slope of the recorded pressure straight line. Liquid/gas transfer phenomenon does not appear in (Eq. 4); however for sake of scientific rigour this process should be taken into consideration to properly establish the experimental procedure in estimating production rate. A more complete modelling of pressure evolution in our flat torus reactor is presented in the appendix section of this publication.
3. Dihydrogen production reactions 3.1. Model system
In this first study devoted to the presentation of our experimental bench, we intend to work with a simple and well-known photoreaction for ease of modelling and validation of a treatment procedure. Among all the possible systems for producing H2 that could be found
in the literature using a photocatalyst dispersed in a solution of reducing agents acting as hole scavengers, one can find the photoproduction reaction of dihydrogen from sulphite and sulphide solution (acting as hole scavengers) in the presence of a dispersed catalyst composed of CdS. This reaction has been selected because it is simple to implement and well known in literature ([16], [28] [29] and [30] for examples). The main photoreactions in these systems are: 2 2 4 CdS , h 2 2 3 HO SO H SO −+ ν→ −+ (5) 2 2 2 CdS , h 2 2 H OH 2 S O H 2 S 2 −+ ν→ −+ −+ (6)
Besides it should be noted that reaction (5) is part of a photo-thermochemical cycle developed in [31], where water is splitted in O2 and H2; reaction (6) can also be used in
Clauss cycle for flue gas treatment [32] creating other opportunities to these simple reactions. They were thus implemented in the photoreactor to precisely determine dihydrogen production rate, the apparent quantum yield, Φ, and their evolutions versus radiative quantities, q∩, in and <A> (see part 4.2).
3.2. Reaction and implementation in reactor
Suspensions are prepared using outgassed deionised water (Milli-Q water, Millipore), sodium sulphite (Sigma Aldrich) and sodium sulphide salts (Sigma Aldrich), sodium dodecylsulphate, SDS, (Acros Organics) as dispersant agent and cadmium sulphide (supplied by Acros Organics) with 99.999% purity. The mean diameter of CdS particles is estimated to be 2.5 µm after scanning electronic microscopy analysis.
In a typical suspension, the respective concentration of sulphite, sulphide ions are 0.5 and 0.25 M. The mass concentration of cadmium sulphide particles is ranging between 0.02 and 0.4 g.L-1, SDS is added in a mass ratio 5/1 compared to CdS concentration to ensure an homogeneous slurry with individual catalyst particle. An example of absorption spectrum for a suspension with a 0.4 g.L-1 CdS concentration can be seen in Fig. 3. The band gap could be estimated to a value of 2.4 eV in agreement with literature data ([33] for example). The CdS particles are thus able to absorb photons with a wavelength in the range [300-520 nm] like the ones emitted by the LED panel.
The slurry is magnetically stirred and sonicated in the dark with an IKA U50 Control sonicating needle (set at full amplitude and power) for one hour to disperse aggregates into singular particles and then introduced in the reactor. The thermostatic bath is then switched
on to control the inner reactor temperature at a 25 ± 0.1°C value during all the following steps.
The reactor windows are covered with protections to keep it in obscurity. In order to eliminate air from the reactor, it is inerted with a flow of argon (Messer, 99.999% purity) for one hour. Considering the characteristics of the system (kLa, VG, VL, argon flow rate…), this
duration is sufficient to remove any O2 or N2 remaining traces. Argon being the carrier gas
for chromatography too, the only detected gas would be the produced ones in the reactor. After the blanketing stage, the reactor is closed; covers are removed letting photons radiate the slurry.
3.3. Measurement of H2 mean production rate < >
2 H r The measurement of < > 2 H
r is performed by pressure measurement (see section 2.4, Eq. 4
and appendix). The Henry constant for dihydrogen in our solution is calculated to take into account the influence of ions on the solubility (salting out effect) [34] compared to pure water [35]. Its value is estimated to be equal to
2
H
H = 171033 m3.Pa.mol-1.
4. Results and discussions
4.1 Kinetic description of the H2 photo-production
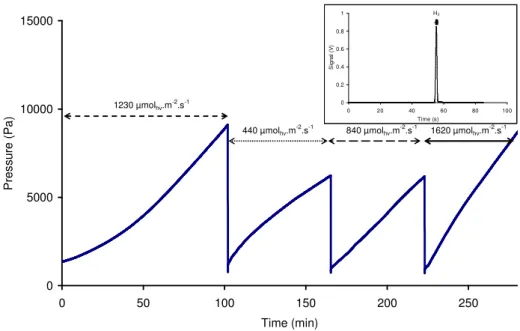
Once the reactor is illuminated, the inside pressure increases due to hydrogen production as can be seen in Fig. 5. This pressure rise starts with a transient state due to desorption of hydrogen generated, as explained and modelled in Appendix.
After the transient state is finished, the pressure increases linearly with time, a pseudo steady state phase is reached. According to Eq. 4, the volumetric rate of hydrogen production can then be considered as constant.
If pressure attains a high value (around 10000 Pa on Fig. 5), the outlet valve is opened to purge the reactor gas phase, the exiting gas are then directed to the chromatograph for analyses. This implies a sudden pressure drop in the reactor as can be seen in Fig. 5. (at 102 and 165 minutes for example). The outlet valve is closed right after that and the incident photon flux density is changed.
Immediately, the pressure increases quickly due to dissolved H2 desorption. Afterwards
another pseudo steady state can be observed. These closing and opening of the outlet valves are repeated as many times as necessary.
0 5000 10000 15000 0 50 100 150 200 250 Time (min) P re s s u re ( P a ) 1230 µmolhν.m-2.s-1 440 µmolhν.m -2 .s-1 840 µmolhν.m -2 .s-1 1620 µmolhν.m -2 .s-1 0 0.2 0.4 0.6 0.8 1 0 20 40 60 80 100 Time (s) S ig n a l (V ) H2
Fig. 5. Typical pressure evolution inside reactor for different photon flux densities (CdS concentration 0.1 g.L-1) with releases of produced H2; Inset hydrogen peak identified by gas
In Fig. 5, it is also possible to notice the influence of photon flux density on the pressure increases (and on the mean volumetric rate of H2 production). Indeed, the higher the
incident PFD, the higher the pressure rate. This confirms the photo-induced nature of the activation of the photocatalytic process of hydrogen generation by CdS particles, with the participation of photo-induced electrical charges (electrons and holes) to the reaction mechanism [36].
As a proof of hydrogen production, gas chromatography analyses have been carried out on the produced gas leaving the reactor. In Fig. 5, the inset indicates that the only detected gas is H2, traces of argon that could be present in the reactor isn’t detected as it is the gas
carrier. The area of the peak related to H2 also increases with time a sign that hydrogen
concentration in the headspace is augmenting.
To ensure the repeatability of the results between the beginning and the end of an experiment, the reactor was finally exposed to the same photon flux density as at the beginning. The measured pressure increases are the same, although the solution composition slightly changed (maximum 2% conversion rate, estimated on the total pressure rise).
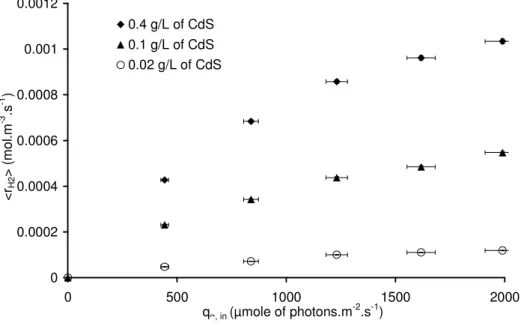
The influence of catalyst concentration has been studied too in the range 0.02 to 0.4 g.L-1. A standard mode of representation of the results would be to plot the mean production rate versus hemispherical photon flux densities, q∩, in, for concentration series as can be seen in
Fig.6a. The other type of graph, frequently seen in literature, is the plot of mean production rate versus concentrations for hemispherical photon flux density series (Fig. 6b)).
0 0.0002 0.0004 0.0006 0.0008 0.001 0.0012 0 500 1000 1500 2000 qᴖ, in (µmole of photons.m-2.s-1) < rH2 > ( m o l. m -3 .s -1 ) 0.4 g/L of CdS 0.1 g/L of CdS 0.02 g/L of CdS
Fig. 6a. Mean production rate of hydrogen versus q∩, in for different CdS concentrations
given as parameter
In Fig. 6a, it is worthwhile to note that, for a low catalyst concentration (0,02 g.L-1), the mean production rate increases linearly versus incident photon flux density q∩, in up to a 1700
µmol.m-2.s-1, for higher PFD the production rate increase is slower approaching the classically observed behaviour where reaction rate is proportional to q∩, in1/2 [36] [37].
At higher concentrations (0.1 and 0.4 g.L-1), the apparent linearity cannot be observed in the
studied range of photon flux densities, the reaction rates are respectively changing according to q∩, in0.48 and q∩, in0.53 i.e. also according to q∩, in1/2 considering standard
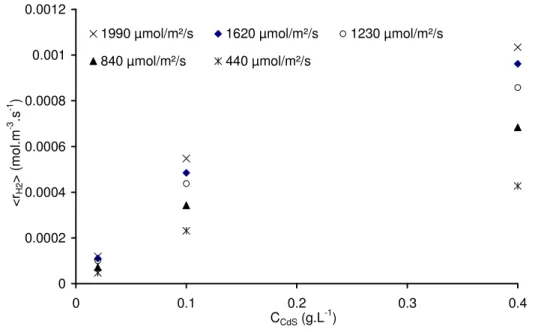
0 0.0002 0.0004 0.0006 0.0008 0.001 0.0012 0 0.1 0.2 0.3 0.4 CCdS (g.L-1) < rH2 > ( m o l. m -3 .s -1 )
1990 µmol/m²/s 1620 µmol/m²/s 1230 µmol/m²/s 840 µmol/m²/s 440 µmol/m²/s
Fig. 6b. Mean production rate of hydrogen versus CdS concentrations for different PFD given as parameter
As it can be seen on Fig. 6b, the production rate increases when catalyst concentration is augmented. Usually in the literature, the reaction rates are as well found to be directly proportional to the catalyst concentration or its mass. This is interpreted as a true heterogeneous catalytic regime [36]. At higher concentrations, the reaction rate levels off and becomes independent of the mass or the concentration [36] or could even decreases [29]. These observations are explained by a screening effect of particles, which masks part of the reactor making it inactive in terms of H2 production.
In the following we propose a radiative analysis of these results, which permits a better understanding of the process.
4.2 Radiative approach for the description of the results
Our analysis includes the mean slurry transmittance, τ (calculated using Eq. 3), that is a radiative quantity independent of the incident PFD q∩, in. Table 1 gathers our measurements
during all the implemented experiments (few hours) for the selected rotation speed of the impeller (at 1100 rpm, there is no evidence to suggest that attrition or sedimentation phenomena occur significantly). τ is the radiative quantity containing the information on the screening effect of particles (see 4.1). When the photocatalyst concentration increases, screening effect increases (light is more attenuated) and less photons reach the rear of the reactor: the mean transmittance decreases (see Table 1).
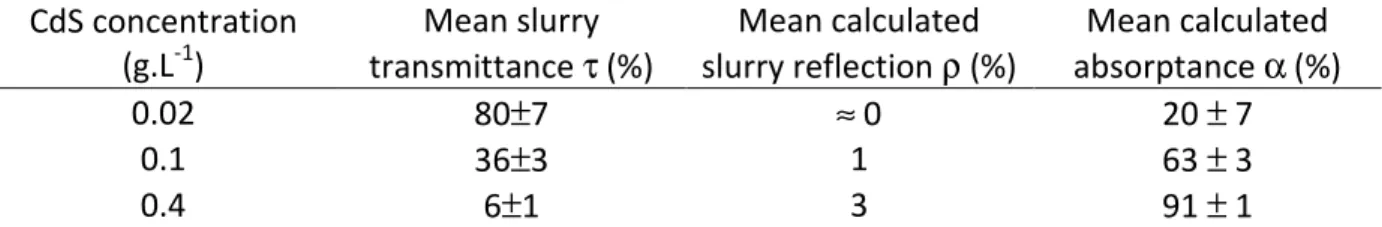
CdS concentration (g.L-1) Mean slurry transmittance τ (%) Mean calculated slurry reflection ρ (%) Mean calculated absorptance α (%) 0.02 80±7 ≈ 0 20 ± 7 0.1 36±3 1 63 ± 3 0.4 6±1 3 91 ± 1
Table 1: Mean measured transmittance during H2 photo-production experiments and
subsequent estimation of absorptance (see text for calculations of α and ρ)
It is possible to notice two operating conditions. For the concentrations of 0.02 and 0.1 g.L-1 of CdS, the transmissions measured behind reactor are respectively equal to 80% and 36%. It means that photon absorption is incomplete; a large amount is exiting and thus lost for the photoprocess. At a 0.4 g.L-1 catalyst concentration, the attenuation is much more important; the mean transmittance is around 6% only. Nevertheless more than 6% of the photons are lost for the photoprocess. Indeed photons are also lost at the front window due to backscattering within the slurry. The next paragraph focuses on the amount of photons absorbed within the reactor and therefore converted by the photoreaction.
The measurement of q∩, out is also useful for the estimation of the mean volumetric rate of
time and volume that can then be obtained from the energy balance on the photonic phase. This balance can be written as [38]:
− = ⋅ − = ⋅ ∇ − =
j j , out j , out in in S V q S q S V 1 d V 1 dV ) ( V 1 S S S S qqqq qqqq A (7)This relationship is particularly convenient to implement in a flat reactor illuminated on one side that can be considered, in a first approximation, as a one-dimensional infinite slab for photon transport. Moreover, there are only one entrance and one exiting surfaces, Sin and
Sout, that are equal in our reactor simplifying Eq. 7. as:
[
in out]
light(
in out)
L light q q a q q V S − = − = A (8)
Where qin is the net photon flux density at the front windows entering defined as:
(
)
,inin 1 q
q = −ρ ∩ (9)
With ρ is the mean slurry reflectance and alight the illuminated specific surface in the
rectangular reactor, defined as (Eq. 10):
(
)
(
d)
reactor d light light L light light 1 f L 1 f 1 V S V S a = = − = − (10)The maximum mean volumetric rate of radiant light energy, <A0>, corresponds to the case where no photon is lost neither by transmission nor by reflection in the process:
in , lightq a ∩ = 0 A (11)
Physical quantities introduced in Eq. 8 and 11 can be used to estimate the global absorptance,
0
A A
=
α [39]. Practically, it can be calculated using the transmittance, τ, and
reflectance, ρ, according to:
ρ − τ − = α = 1 0 A A (12)
In other words, ρ is the reflected part of the incoming photons by the medium only. Since this quantity can not be measured in our experimental set-up, we estimated ρ thanks to a two flux model [40] [41] (also refered as the Kubelka-Munk model) using the scattering properties of the CdS particle calculated by Lorenz-Mie theory [42]. ρ values according to CdS concentration are presented in Table 1.
As can be seen in Fig. 6b. the higher α is, the higher H2 production rate: the more photons
are absorbed and converted the more H2 is produced. But the maximum value of α is lower
than 1 due to slurry reflection [39]: it is not possible to absorb and convert all the photons entering the reactor. In this work the maximum value of α that is investigated corresponds to a 0.4 g.L-1 CdS concentration (see Table 1) and is nearly equal to 95% of the maximum possible absorptance 1-ρ. This approach, based on maximising the absorptance, is different of the analysis developed in [36], considering that the optimal light power utilization corresponds to the domain where the rate is proportional to the PFD, regardless to the presence of dark zones in the reactor or lost photons exiting from the reactor. Now that we analysed absorption within the reactor, we focus hereafter on the conversion of the absorbed photons, with special attention on the apparent quantum yield.
To get further in the analysis of our experimental results, we would like to suggest another approach that doesn’t try to relate mean hydrogen production rates < >
2
H
r to the incident
photon flux densities q∩, in, but to the mean volumetric rate of radiant energy absorbed <A>.
Such a presentation is more relevant to consider incomplete photon absorption in the reactor [13] [41]. Assuming first a linear kinetic coupling of the H2 production rate with
radiation field within the reactor (even to find out later that this is not the case), the photocatalytic rate of H2 production, < >
2
H
A Φ = > < 2 H r (13)
Where Φ is the overall apparent quantum yield (usually considered as independent of the wavelength) and <A> is the MVREA. This Eq. (14) is justified only if coupling is linear, that is to say, if Φ is independent of the radiative quantities (Φ is constant).
Quantum yield values are presented Fig. 7 and are constructed using Eq. 8. (neglecting the rear water-glass interface), 9. and 13. giving the following expression of the quantum yield ([38]):
(
)
[
,in ,out]
light H q q 1 a r 2 ∩ ∩ − ρ − > < = Φ (14) With < > 2 Hr being determined by pressure evolution, q∩, in and q∩,out estimated as explained
in section 3.
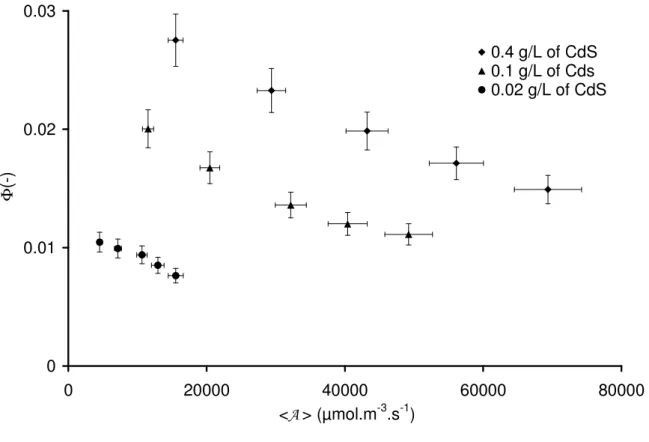
Nevertheless we record hereafter, in Fig. 7, values of Φ that vary as a function of the MVREA <A> and hence q∩, in. This reductio ad absurdum proves the non linearity of the coupling
0 0.01 0.02 0.03 0 20000 40000 60000 80000 <A > (µmol.m-3.s-1) Φ (-) 0.4 g/L of CdS 0.1 g/L of Cds 0.02 g/L of CdS
Fig. 7. Evolution of apparent quantum yield,Φ, versus MVREA, <A>, for different concentrations of the photocatalyst
Besides at first glance, the values of Φ are rather low, a symbol of poor conversion of photon flux into hydrogen without efficient catalyst for redox reactions involved. It should be considered that the immediate goal of this work is not maximizing the quantum yield value through all kinds of chemical activation (Pt [43] or Pd [44] depositions, nitrogen doping [45]…) but rather to develop an experimental bench and a rigorous methodology for accurate radiative analysis of photoreactors before formulating thermo-kinetic coupling in a future work.
Moreover, the “wide” error bars are mainly due to the standard deviation on the measurement of the PFD (about 4%) and not to the method of measuring the hydrogen production rate (standard deviations less than 1 %).
Contrary to our initial simplifying assumption, the apparent quantum yield Φ clearly decreases when the MVREA increases. This is indeed the direct proof that the coupling is non linear, demonstrating that Φ depends on the local volumetric rate of radiant energy absorbed, A(x), that is highly heterogeneous within the reactor operating at high absorptance α. This can be explained by a concentration of charge carriers generated in the CdS crystal structure, that increases with local rate of photon absorption A(x). Different models in the literature (e.g. [46]) indicate a first order rate recombination mechanism of these carriers. Increasing their concentrations in the particles is therefore prone to promote the recombination dissipative mechanism (see [47]): the quantum yield is a local quantity that is a function of A(x).
As can also be seen, the apparent quantum yield augments with catalyst concentration, indirectly confirming the effect of absorptance on the global reactor performances. Using the results presented in Fig. 6a and Eq. 11 and 13, the apparent quantum yield, Φ, could be to, a certain extent, a function of q∩, in-1/2 joining observation and data already published
[47].
To go further in the analysis of the results, subsequent studies will include the modelling of the local volumetric rate of radiant energy absorbed A(x), and the formulation of the local thermokinetic coupling, in order to grasp the variation of the quantum yield Φ as a function of the location within the reactor, along the line of [38] [41] in the field of photobioreactor engineering.
Conclusions and perspectives
In this article, a novel characterization bench for the photocatalytic production of H2 was
presented comprising three main components, a fully equipped flat torus reactor, a controlled light source (LED panel) and an analysis system. A complete and careful study of these components was carried out. In particular, a study of residence time distribution of the liquid phase in the reactor confirms a piston-like behavior with dispersion and recirculation that tends under certain conditions to a perfectly stirred reactor. Regarding the flux emitted by the LED panel, it has been characterized via two methods: actinometry and hemispherical cosine sensor mapping; the identified photon flux densities with both methods are consistent and accurate.
Both results (perfectly stirred liquid phase and exact knowledge of photon flux entering the reactor) were then used to analyze the process during hydrogen production. Hydrogen was then generated in our device (using CdS and sulphide/sulphite slurry) and its production rate was quantified with a high accuracy thanks to the pressure measurement method. Results were at first presented in a traditional way i.e. mean volumetric rates versus incident photon flux and were coherent with literature data.
Subsequently thanks to the estimated production rates combined with macroscopic mass and photonic phase balances, we were able to estimate an apparent quantum yield for radiation conversion into chemical energy. The obtained values were quite low (Φ of order 10-2), but as expected since no chemical system optimization was performed on the photocatalyst. Unlike our simplifying assumption about the linear kinetic coupling, Φ was found to be dependent on the MVREA <A> for all the tested conditions. Hence a non linear coupling occurs between gas production rate and volumetric rate of radiant energy absorbed.
A more relevant analysis would be to determine the LVREA A(x) by modeling radiative transfer, this can only be done after solving the radiative transfer equation (RTE) requiring the knowledge of the radiative properties (absorption and scattering coefficients and the phase function) of the catalyst particles. These two difficult points constitutes crucial scientific aspects in their own, or bolts to be unlocked. From these first experimental results presented here and our approach, it will be possible to develop a thermokinetic coupling law and to reify the knowledge models for the specific photocatalytic H2 production. Such
models will enable to simulate, design and optimize photoreactors for hydrogen production at further industrial scale demonstrator.
In addition, this installation now validated will also be used to test the effectiveness of new and innovative catalysts. For example, we intend to work with bio-inspired molecules, involved in artificial photosynthesis, either for water reduction (with diiron complexes, exhibiting much higher activity than CdS particles, to replace platinum for the effective reduction of protons, [48]) or organic substrate photo-oxidation [49].
Acknowledgment
This work has been sponsored by the French government research program "Investissements d'avenir" through the IMobS3 Laboratory of Excellence (ANR-10-LABX-16-01), by the European Union through the Regional Competitiveness and Employment program -2007-2013- (ERDF – Auvergne region) and by the Auvergne region.
This work was also supported by the National Research Agency through the Tech'Biophyp program (2011-2015). The authors also acknowledge the CNRS research federation FedESol where fruitful discussions and debates take place every year since 2012.
The authors also wish to thank Pascal Lafon and Frederic Joyard for fruitful discussions, CAD and technical assistance.
Appendix: Full mathematical model of pressure evolution in the gas-tight torus photoreactor for
2
H
r assessment
In this Appendix, we intend to develop a model based on H2 mass balances for the
estimation of production rates based on pressure evolution; the global dynamic model (including mean volumetric mass transfer coefficient, kLa) with its simplification (to obtain
Eq. 4 in the core of the article) will first be presented. The procedure for estimation of kLa
will subsequently be explained.
A.1 Global dynamic model for 2
H
r assessment
Following the work of Cogne et al. [26] on the estimation of gas production with pressure increase in a gastight reactor, a complete dynamic model was developed to estimate
2
H
r
taking into account H2 exchange between liquid and gas phases. For ease of simplification,
the contribution of argon (inerting gas used during the reactor preparation) will not be considered in the pressure increase (the experiment begins at equilibrium for inert gas and its partial pressure decreases strongly with time).
The hydrogen balance in the whole reactor (gas and liquid phases) can be described by the following equation (A.1):
(
CH,GVG CH,LVL)
rH VL dt d 2 2 2 = + (A.1)Regarding gas phase where pressure is monitored it is possible to write Eq. A.2, considering the mass transfer at the gas/liquid interface:
(
)
(
*)
L , H L , H L L G G , H2 V k aV C 2 C 2 C dt d − = (A.2)In equations A.1 and A.2, hydrogen concentrations in liquid and gas phases are appearing. They can be expressed in terms of partial pressures,
2
H
P , the measured parameter:
2 2 2 H H * L , H H P C = (A.3) ; RT P C 2 2 H G , H = (A.4)
In which we have used (Eq. A.3), the Henry’s law to relate H2 partial pressure
2
H
P to the
hydrogen equilibrium concentration in the liquid phase * L , H2
C . As a reminder, its value is
estimated to be 171033 m3.Pa.mol-1 (see text). Equations (A.1) and (A.2) can then be rewritten as:
L H L L , H G H V r V C V RT P dt d 2 2 2 = + (A.5) − = 2 2 2 2 H H L , H L L G H H P C aV k V RT P dt d (A.6)
Observing that the accumulation term of Eq. (A.5) is the total number of H2 moles on both
phases, it is possible to integrate this equation first to obtain a mathematical relation
) P , r , t ( f C 2 2 2,L H H
H = that can be used in Eq. (A.6) to give Eq. (A.7) (where C0 is, for simplicity,
defined as the initial hydrogen concentration in liquid phase):
+ + = + + L G 0 0 G L L H G L L H H L G G L L H V V RT P C V V aRT k t r V V aRT k P H 1 V V RT 1 V V aRT k dt dP 2 2 2 2 (A.7)
The solution of this linear ordinary differential equation with
(
)
0H t 0 P P 2 = = is:
(
)
t 0 t 0 H 0 G L L H G L L H P 1 e Pe r C V V RT a k t r V V aRT k P 2 2 2 χ − χ − + − + χ − χ + χ = (A.8)Where for ease of reading the χ parameter, having a constant value during experiment, has been introduced (Eq. A.9):
+ = χ 2 H L G G L L H 1 V V RT 1 V V aRT k (A.9)
As already explained, the estimation of 2
H
r is based on the measurement of pressure
evolution in the reactor as a function of time
dt dP
2
H . It is thus necessary to differentiate Eq.
(A.8) to obtain the useful relation (A.10):
t 0 t 0 H 0 G L L H G L L H e P e P r C V V RT a k r V V aRT k dt dP 2 2 2 −χ −χ −χ + χ − + χ = (A.10)
Eq. (A.10) is composed of two terms, a steady one and another time-dependent. For ‘sufficiently long times’ (see hereafter), Eq. (A.10) can be simplified as:
→ t→∞ χ = 2 2 H G L L H r V V aRT k dt dP (A.11) ⇔ dt dP V V aRT k r 2 2 H L G L H χ = (A.12)
Considering the expression of χ (Eq. (A.9)), mean volumetric rate of hydrogen production can then be determined without the need of considering gas/liquid mass transfer as proposed in the core of the article (Eq. 4).
dt dP H 1 V V RT 1 r 2 2 2 H H L G t H + = →∞ (A.13)
A.2 Determination of the time constant to neglect mass transfer in the assessment of 2
H
r
However, the expression ‘sufficiently long times’ should be stated. To respond to this requirement, Eq. A.10 must be considered and mean volumetric mass transfer coefficient,
a
For this purpose, the experimental procedure is as follows: after hours of hydrogen production, the incident photon flux density is set at a zero value by switching off the LEDs and covering the reactor. Hydrogen production would cease due to the absence of irradiation. Besides, pressure in the reactor is still monitored and increases as a function of time, as can be seen in Fig. A.1. This evolution is due to H2 transfer from the liquid phase to
the gas phase tending to the thermodynamic equilibrium.
First the value of C0 is determined by integral mass balance on H2 for the duration of the
experiment at dark according to Eq. A14:
(
H, H,0)
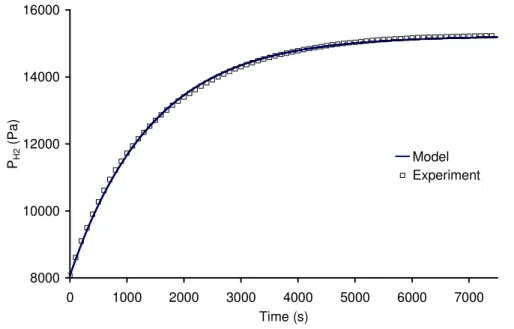
L G H , H 0 2 2 2 2 P P RTV V H P C = ∞ + ∞− (A.14)Secondly, the value of kLa is then identified by comparing model in Eq. (A.8) with
2
H
r = 0 and
experimental results as it can be seen for example in Fig. A.1.
8000 10000 12000 14000 16000 0 1000 2000 3000 4000 5000 6000 7000 Time (s) PH 2 ( P a ) Model Experiment
Fig. A.1. Typical pressure evolution at dark after reaction, comparison with model in eq. A.8 after kLa identification
Matching experimental results and model is very good as can be noticed in Fig. (A.1). The identified value of kLa, in this case, is equal to 2.4 h-1, in the same order of magnitude as
typical volumetric mass transfer coefficients in still surface.
To check the validity of using (Eq. A.13) to estimate the volumetric rate of hydrogen production, a comparison is made between the linear model (Eq. A.11) and the complete model (Eq. A.10) for pressure evolution based on the experimental bench parameters (including the identified value of kLa and a given
2
H
r ). The results are presented in Fig. A.2.
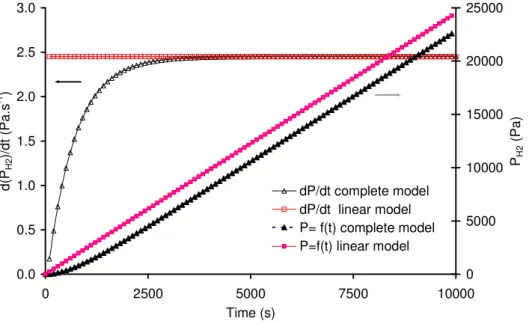
0.0 0.5 1.0 1.5 2.0 2.5 3.0 0 2500 5000 7500 10000 Time (s) d (P H 2 )/ d t (P a .s -1 ) 0 5000 10000 15000 20000 25000 PH 2 ( P a ) dP/dt complete model dP/dt linear model P= f(t) complete model P=f(t) linear model
Fig. A.2 Comparisons of pressure evolutions (P=f(t)) and pressure evolution rates (dP/dt=f(t)) respectively predicted by linear and complete models
Due to the existence of liquid/gas transfer phenomenon, pressure evolution predicted by the complete model is not fully linear in the first 3500 seconds. This duration should thus be waited to consider steady state being reached (less than 1% difference between estimated values in pressure evolution rates). Such a precaution was taken into account to make good use of the measured pressures. An example of pressure recording can be seen in Fig. A.3,
demonstrating a very good agreement with previous theoretical analysis of the time constant. The mean volumetric rates of hydrogen evolution are then estimated from the linear part. 0 3000 6000 9000 0 1000 2000 3000 4000 5000 6000 Time (s) P re s s u re ( P a ) Transient phase Linear phase
Nomenclature
A Local volumetric rate of radiant energy absorbed (LVREA) (µmol.m-3.s-1) A0 Maximum local volumetric rate of radiant energy absorbed (µmol.m-3.s-1)
a Specific surface of liquid/gas transfer (m-1)
alight Illuminated specific surface (m-1)
C Concentration (mol.m-3)
C∞ Final salt concentration in the reactor (mol.m-3)
C* Liquid concentration at gas/liquid equilibrium (mol.m-3)
Dax Axial dispersion coefficient (m2.s-1)
fd Dark fraction of the reactor (-)
H Henry constant (Pa.m3.mol-1)
j Index of summation (-)
kL Liquid/gas mass transfer coefficient (m.s-1)
L Characteristic length of the flow (m)
Lreactor Thickness of the reactor (m)
P Pressure in the reactor (Pa)
q Photon flux density (µmol.m-2.s-1)
R Gas constant (8,314 J.mol-1.K-1)
ri Local molar volumetric reaction rate (mol.m-3.s-1)
S Surface (m2)
Slight Illuminated surface (m2)
T Temperature (K)
t Time (s)
tc Circulation time (s)
tm Mixing time (s)
v Liquid mean velocity (m.s-1)
VG Headspace gas volume in the reactor (m3)
VL Volume of solution contained in the reactor (m3)
Vlight Illuminated volume of the reactor (m3)
x Space coordinate in the Cartesian geometry (-)
Greek letters
α Absorptance (-)
χ Time constant in the complete model for pressure evolution (s-1)
Φ Apparent overall quantum yield (molH2.molehν-1)
Θ Dimensionless time c t t = Θ (-) λ Wavelength (m)
ρ Reflected part of the incoming photons by the medium itself (-)
τ Mean transmittance of the slurry (-)
Τ Mean transmittance of the window glass
Dimensionless number
Pe Péclet number based on the length of the reactor (-)
D L v
Pe= ⋅
Subscript
∩ Relative to hemispherical incident radiation onto the reactor
λ Relative to a spectral quantity for the wavelength
∞ Relative to a long-term time
0 Initial value
G Relative to gas phase
gas Relative to gaseous solute
glass Relative to the window glass
H2 Relative to H2
in Relative to inlet
L Relative to liquid phase
out uncorrected Relative to outlet without interface correction
out Relative to outlet
Other
= V XdV V 1 X : Spatial averagingReferences
[1] World Energy Council, World Energy Scenarios Composing energy futures to 2050, 2013.
[2] J. Nowotny, C.C. Sorrell, L.R. Sheppard, T. Bak, Solar-hydrogen: Environmentally safe fuel for the future, Int. J. Hydrog. Energy. 30 (2005) 521–544.
doi:10.1016/j.ijhydene.2004.06.012.
[3] M.M. Najafpour, R. Carpentier, S.I. Allakhverdiev, Artificial photosynthesis, J. Photochem. Photobiol. B. (2015). doi:10.1016/j.jphotobiol.2015.04.008.
[4] M. Anpo, Photocatalytic reduction of CO2 with H2O on highly dispersed Ti-oxide catalysts as a model of artificial photosynthesis, J. CO2 Util. 1 (2013) 8–17. doi:10.1016/j.jcou.2013.03.005.
[5] Z. Xing, X. Zong, J. Pan, L. Wang, On the engineering part of solar hydrogen production from water splitting: Photoreactor design, Chem. Eng. Sci. 104 (2013) 125–146.
doi:10.1016/j.ces.2013.08.039.
[6] A. Kudo, Y. Miseki, Heterogeneous photocatalyst materials for water splitting, Chem. Soc. Rev. 38 (2008) 253–278. doi:10.1039/B800489G.
[7] L. Davydov, P.G. Smirniotis, S.E. Pratsinis, Novel Differential Reactor for the
Measurement of Overall Quantum Yields, Ind. Eng. Chem. Res. 38 (1999) 1376–1383. doi:10.1021/ie9801498.
[8] J. Moreira, B. Serrano, A. Ortiz, H. de Lasa, TiO2 absorption and scattering coefficients using Monte Carlo method and macroscopic balances in a photo-CREC unit, Chem. Eng. Sci. 66 (2011) 5813–5821. doi:10.1016/j.ces.2011.07.040.
[9] M.I. Cabrera, O.M. Alfano, A.E. Cassano, Novel reactor for photocatalytic kinetic studies, Ind. Eng. Chem. Res. 33 (1994) 3031–3042.
[10] M. Schwarze, D. Stellmach, M. Schröder, K. Kailasam, R. Reske, A. Thomas, et al., Quantification of photocatalytic hydrogen evolution, Phys. Chem. Chem. Phys. 15 (2013) 3466–3472. doi:10.1039/C3CP50168J.
[11] A. Agarwal, A. Bhaskarwar, Comparative simulation of falling-film and parallel-film reactors for photocatalytic production of hydrogen, Int. J. Hydrog. Energy. 32 (2007) 2764–2775. doi:10.1016/j.ijhydene.2006.12.025.
[12] G.H. Rossetti, E.D. Albizzati, O.M. Alfano, Modeling and experimental verification of a flat-plate solar photoreactor, Ind. Eng. Chem. Res. 37 (1998) 3592–3601.
[13] A.E. Cassano, C.A. Martin, R.J. Brandi, O.M. Alfano, Photoreactor Analysis and Design: Fundamentals and Applications, Ind. Eng. Chem. Res. 34 (1995) 2155–2201.
doi:10.1021/ie00046a001.
[14] S. Escobedo Salas, B. Serrano Rosales, H. de Lasa, Quantum yield with platinum
modified TiO2 photocatalyst for hydrogen production, Appl. Catal. B Environ. 140–141 (2013) 523–536. doi:10.1016/j.apcatb.2013.04.016.
[15] H. Takache, J. Pruvost, J.-F. Cornet, Kinetic modeling of the photosynthetic growth of
Chlamydomonas reinhardtii in a photobioreactor, Biotechnol. Prog. 28 (2012) 681–692.
doi:10.1002/btpr.1545.
[16] N. Buehler, K. Meier, J.F. Reber, Photochemical hydrogen production with cadmium sulfide suspensions, J. Phys. Chem. 88 (1984) 3261–3268.
[17] J. Pruvost, L. Pottier, J. Legrand, Numerical investigation of hydrodynamic and mixing conditions in a torus photobioreactor, Chem. Eng. Sci. 61 (2006) 4476–4489.
doi:10.1016/j.ces.2006.02.027.
[18] H. Benkhelifa, J. Legrand, P. Legentilhomme, A. Montillet, Study of the hydrodynamic behaviour of the batch and continuous torus reactor in laminar and turbulent flow regimes by means of tracer methods, Chem. Eng. Sci. 55 (2000) 1871–1882. [19] R.M. Voncken, D.B. Holmes, H.W. den Hartog, Fluid flow in turbine-stirred, baffled
tanks—II: Dispersion during circulation, Chem. Eng. Sci. 19 (1964) 209–213. doi:10.1016/0009-2509(64)85031-4.
[20] M. Takao, S. Ono, T. Hirose, Y. Murakami, A mathematical solution for response of tracer pulse in a loop reactor with open boundary and recycle, Chem. Eng. Sci. 37 (1982) 796–798.
[21] H.J. Kuhn, S.E. Braslavsky, R. Schmidt, Chemical actinometry (IUPAC technical report), Pure Appl. Chem. 76 (2004) 2105–2146.
[22] E.E. Wegner, A.W. Adamson, Photochemistry of complex ions. III. Absolute quantum yields for the photolysis of some aqueous chromium (III) complexes. Chemical actinometry in the long wavelength visible region, J. Am. Chem. Soc. 88 (1966) 394– 404.
[23] J.-F. Cornet, A. Marty, J.-B. Gros, Revised technique for the determination of mean incident light fluxes on photobioreactors, Biotechnol. Prog. 13 (1997) 408–415. [24] C.S. Zalazar, M.D. Labas, C.A. Martín, R.J. Brandi, O.M. Alfano, A.E. Cassano, The
extended use of actinometry in the interpretation of photochemical reaction engineering data, Chem. Eng. J. 109 (2005) 67–81. doi:10.1016/j.cej.2005.03.011. [25] V. Rochatte, G. Dahi, A. Eskandari, J. Dauchet, F. Gros, M. Roudet, et al., Radiative
transfer approach for Reinecke’s salt actinometry from simple to complex geometries of photo(bio)reactors, Chem. Eng. J. Submitt. (n.d.).
[26] G. Cogne, C. Lasseur, J.-F. Cornet, C.-G. Dussap, J.-B. Gros, Growth monitoring of a photosynthetic micro-organism (Spirulina platensis) by pressure measurement, Biotechnol. Lett. 23 (2001) 1309–1314.
[27] A. Koca, M. Şahin, Photocatalytic hydrogen production by direct sun light from sulfide/sulfite solution, Int. J. Hydrog. Energy. 27 (2002) 363–367. doi:10.1016/S0360-3199(01)00133-1.
[28] E. Borgarello, N. Serpone, E. Pelizzetti, M. Barbeni, Efficient photochemical conversion of aqueous sulphides and sulphites to hydrogen using a rhodium-loaded CdS
photocatalyst, J. Photochem. 33 (1986) 35–48. doi:10.1016/0047-2670(86)87017-4. [29] J. Sabaté, S. Cervera-March, R. Simarro, J. Giménez, Photocatalytic production of
hydrogen from sulfide and sulfite waste streams: a kinetic model for reactions occurring in illuminating suspensions of CdS, Chem. Eng. Sci. 45 (1990) 3089–3096. doi:10.1016/0009-2509(90)80055-J.
[30] J.F. Reber, M. Rusek, Photochemical hydrogen production with platinized suspensions of cadmium sulfide and cadmium zinc sulfide modified by silver sulfide, J. Phys. Chem. 90 (1986) 824–834. doi:10.1021/j100277a024.
[31] A. T-Raissi, N. Muradov, C. Huang, O. Adebiyi, Hydrogen From Solar Via Light-Assisted High-Temperature Water Splitting Cycles, J. Sol. Energy Eng. 129 (2007) 184.
[32] S. Cervera-March, L. Borrell, J. Giménez, R. Simarro, J.M. Andújar, Solar hydrogen photoproduction from sulphide/sulphite substrate, Int. J. Hydrog. Energy. 17 (1992) 683–688. doi:10.1016/0360-3199(92)90087-D.
[33] S. Ninomiya, S. Adachi, Optical properties of wurtzite CdS, J. Appl. Phys. 78 (1995) 1183–1190. doi:10.1063/1.360355.
[34] S. Weisenberger, A. Schumpe, Estimation of gas solubilities in salt solutions at temperatures from 273 K to 363 K, AIChE J. 42 (1996) 298–300.
doi:10.1002/aic.690420130.
[35] R. Sander, Compilation of Henry’s law constants, version 3.99, Atmos Chem Phys Discuss. 14 (2014) 29615–30521. doi:10.5194/acpd-14-29615-2014.
[36] J.-M. Herrmann, Heterogeneous photocatalysis: fundamentals and applications to the removal of various types of aqueous pollutants, Catal. Today. 53 (1999) 115–129. doi:10.1016/S0920-5861(99)00107-8.
[37] E. Vulliet, J.-M. Chovelon, C. Guillard, J.-M. Herrmann, Factors influencing the
photocatalytic degradation of sulfonylurea herbicides by TiO2 aqueous suspension, J. Photochem. Photobiol. Chem. 159 (2003) 71–79. doi:10.1016/S1010-6030(03)00108-4. [38] J.-F. Cornet, C.-G. Dussap, A Simple and reliable formula for assessment of maximum
volumetric productivities in photobioreactors, Biotechnol. Prog. 25 (2009) 424–435. doi:10.1002/btpr.138.
[39] J.F. Cornet, C.G. Dussap, G. Dubertret, A structured model for simulation of cultures of the cyanobacterium Spirulina platensis in photobioreactors: I. Coupling between light transfer and growth kinetics, Biotechnol. Bioeng. 40 (1992) 817–825.
doi:10.1002/bit.260400709.
[40] J.-F. Cornet, Calculation of optimal design and ideal productivities of volumetrically lightened photobioreactors using the constructal approach, Chem. Eng. Sci. 65 (2010) 985–998. doi:10.1016/j.ces.2009.09.052.
[41] L. Pottier, J. Pruvost, J. Deremetz, J.-F. Cornet, J. Legrand, C.G. Dussap, A fully predictive model for one-dimensional light attenuation by Chlamydomonas reinhardtii in a torus photobioreactor, Biotechnol. Bioeng. 91 (2005) 569–582. doi:10.1002/bit.20475. [42] C.F. Bohren, D.R. Huffman, eds., Absorption and Scattering of Light by Small Particles,
Wiley-VCH Verlag GmbH, Weinheim, Germany, 1998.
[43] N. Sahu, S.N. Upadhyay, A.S.K. Sinha, Kinetics of reduction of water to hydrogen by visible light on alumina supported Pt–CdS photocatalysts, Int. J. Hydrog. Energy. 34 (2009) 130–137. doi:10.1016/j.ijhydene.2008.09.043.
[44] W. Yao, C. Huang, N. Muradov, A. T-Raissi, A novel Pd–Cr2O3/CdS photocatalyst for solar hydrogen production using a regenerable sacrificial donor, Int. J. Hydrog. Energy. 36 (2011) 4710–4715. doi:10.1016/j.ijhydene.2010.12.124.
[45] H. Kisch, Semiconductor Photocatalysis—Mechanistic and Synthetic Aspects, Angew. Chem. Int. Ed. 52 (2013) 812–847. doi:10.1002/anie.201201200.
[46] C. Wang, J. Rabani, D.W. Bahnemann, J.K. Dohrmann, Photonic efficiency and quantum yield of formaldehyde formation from methanol in the presence of various TiO 2 photocatalysts, J. Photochem. Photobiol. Chem. 148 (2002) 169–176.
[47] L. Sun, J.R. Bolton, Determination of the quantum yield for the photochemical generation of hydroxyl radicals in TiO2 suspensions, J. Phys. Chem. 100 (1996) 4127– 4134.
[48] F. Quentel, G. Passard, F. Gloaguen, A Binuclear Iron–Thiolate Catalyst for
Electrochemical Hydrogen Production in Aqueous Micellar Solution, Chem. – Eur. J. 18 (2012) 13473–13479. doi:10.1002/chem.201201884.
[49] F. Avenier, C. Herrero, W. Leibl, A. Desbois, R. Guillot, J.-P. Mahy, et al., Photoassisted Generation of a Dinuclear Iron(III) Peroxo Species and Oxygen-Atom Transfer, Angew. Chem. Int. Ed. 52 (2013) 3634–3637. doi:10.1002/anie.201210020.