HAL Id: hal-01152470
https://hal.archives-ouvertes.fr/hal-01152470
Submitted on 17 May 2015
HAL is a multi-disciplinary open access
archive for the deposit and dissemination of
sci-entific research documents, whether they are
pub-lished or not. The documents may come from
teaching and research institutions in France or
abroad, or from public or private research centers.
L’archive ouverte pluridisciplinaire HAL, est
destinée au dépôt et à la diffusion de documents
scientifiques de niveau recherche, publiés ou non,
émanant des établissements d’enseignement et de
recherche français ou étrangers, des laboratoires
publics ou privés.
Performance Prediction in a Decentralized Environment
for Peer-to-Peer Computing
Bogdan Florin Cornea, Julien Bourgeois, Tung Nguyen, Didier El Baz
To cite this version:
Bogdan Florin Cornea, Julien Bourgeois, Tung Nguyen, Didier El Baz.
Performance
Predic-tion in a Decentralized Environment for Peer-to-Peer Computing. 2011 IEEE InternaPredic-tional
Par-allel & Distributed Processing Symposium, May 2011, Anchorage, United States. pp.1613-1621,
�10.1109/IPDPS.2011.321�. �hal-01152470�
Performance Prediction in a Decentralized
Environment for Peer-to-Peer Computing
Bogdan Florin Cornea
∗, Julien Bourgeois
∗, The Tung Nguyen
†, Didier El-Baz
†∗
LIFC, University of Franche-Comt´e; 1 cours Leprince Ringuet; 25201 Montb´eliard; France.
{bogdan.cornea, julien.bourgeois}@univ-fcomte.fr
†
CNRS; LAAS; 7 avenue du colonel Roche, F-31077 Toulouse, France.
University of Toulouse; UPS, INSA, INP, ISAE; LAAS; F-31077 Toulouse France.
{ttnguyen, elbaz}@laas.fr
Abstract—P2PDC is an environment for high performance peer to peer computing that allows direct communication between peers. This environment is based on P2PSAP, a self adaptive communication protocol. P2PDC is suited to the solution of large scale numerical simulation problems via distributed iterative methods. dPerf is a performance prediction environment for parallel and distributed applications, with primary interest in programs written in C, C++, Fortran for P2PDC. The dPerf performance prediction tool makes use of static and dynamic analyses combined with trace-based simulation. In this paper, we present a decentralized version of P2PDC and show how dPerf predicts performance for the P2PDC environment. We present new features of P2PDC aimed at making it more scalable and robust. Through experiments with P2PDC and dPerf, we show how to properly choose a peer to peer computing system which can match the computing power of a cluster.
Keywords-peer to peer computing, high performance comput-ing, distributed computcomput-ing, task parallel model, performance prediction, automatic static analysis, block benchmarking, trace-based simulation
I. INTRODUCTION
Peer-to-Peer (P2P) applications have known great develop-ments these years. These applications were originally designed for file sharing, e.g. Gnutella [1] or FreeNet [2] and are now considered to a larger scope from video streaming to system update and distributed data base. Recent advances in microprocessors architecture and networks permit one to consider new applications like High Performance Computing (HPC). Therefore, we can identify a real stake at developing new protocols and environments for HPC since this can lead to economic and attractive solutions.
In order to obtain good efficiency of HPC P2P applications, special transport protocols have to be designed, and proper performance prediction tools must be employed. We note that existing transport protocols like TCP and UDP were originally designed to provide ordered and reliable transmission to the application and are no longer adapted to both real-time and distributed computing applications.
In [3], we have proposed the Peer To Peer Self Adap-tive communication Protocol (P2PSAP) which is suited to high performance distributed computing. P2PSAP chooses dynamically appropriate communication mode between any peers according to decisions taken at application level like
schemes of computation, e.g. synchronous or asynchronous iterative schemes and elements of context like network topol-ogy at transport level. This approach is different from MPICH Madeleine [4] in allowing the modification of internal trans-port protocol mechanism in addition to switch between net-works.
In [5], we have presented centralized version of P2PDC an environment for high performance peer to peer computing which makes use of the P2PSAP protocol in order to allow direct communication between peers.
Traditional prediction tools are not particularly well-suited to large scale peer-to-peer HPC applications. For this reason, we have developed the distributed Performance Prediction environment (dPerf), see [6]. dPerf is inspired by previous work [7] which uses static and semi static analysis of dis-tributed applications that communicate using MPI [8]. Later on, starting with [9–11], the principles of performance pre-diction for MPI applications were oriented towards peer to peer networks. Currently, dPerf aims at applying the ideas from [7, 9–11] to peer to peer distributed computing, where applications communicate using the P2PDC environment.
In this paper we present a decentralized version of P2PDC that includes features aimed at making P2PDC more scalable and robust, and we show how to evaluate the performance of peer-to-peer distributed applications in order to obtain a computing power comparable to that of a cluster. Indeed, a hybrid topology manager manages peers efficiently and facil-itates peers collection for a computation, and a hierarchical task allocation mechanism accelerate task allocation to peers and avoids connection bottleneck at submitter. We use dPerf features that permit us to calculate the necessary resources of a P2P computing grid that will provide the same computing power as a cluster belonging to the Grid 5000 testbed.
This article is structured as follows. Section II introduces related works in the field of peer to peer computing and perfor-mance prediction for distributed applications. In section III, we describe the features of the decentralized version of P2PDC as well as the methodology and requirements for dPerf to evaluate and predict the execution time of applications written for the P2PDC decentralized computing environment. Computational results are displayed and analyzed in Section IV, while our conclusions and future work are presented in Section V.
2011 IEEE International Parallel & Distributed Processing Symposium
2011 IEEE International Parallel & Distributed Processing Symposium
2011 IEEE International Parallel & Distributed Processing Symposium
II. RELATEDWORK
A. Environment for peer to peer computing
Recently, middleware like BOINC [12] or OurGrid [13] have been developed in order to exploit the CPU cycles of computers connected to the Internet. Those systems are generally dedicated to data parallel applications where tasks are independent and direct communication between machines is not needed. MapReduce [14] is a programming model and an associated implementation for processing and generating large data sets. Users specify a map function that processes a key/value pair to generate a set of intermediate key/value pair, and a reduce function that merges all intermediate values associated with the same intermediate key. This programming model is not appropriate for distributed iterative algorithms with frequent communication between peers.
B. Performance prediction
Along with application development came the performance prediction tools. These evolved at the same time as the applications themselves which brings the older prediction tools in a phase where it is difficult to handle today’s hardware evolution rate. The various existent prediction tools normally involve little manpower, take less time than the real execu-tion of the applicaexecu-tion subjected to evaluaexecu-tion, may provide developers with an insights of the application behavior, and may assist scientist in choosing optimal future HPC system configuration. Up to this day, performance prediction tools can be classified as: analytical [15–17], profile-based (based on compilers and instrumentation tools) [7, 18],
simulation-based[19, 20], and hybrid [21–24]. The hybrid methods are a combination of profile- and simulation- based, dPerf belonging to this category.
The above-mentioned research address single-processor sys-tems, or are developed for specific applications, or they are limited to centralized systems and to communication protocols prior to P2PSAP. To the best of our knowledge, there is no performance prediction tool that focus on both parallel and peer to peer distributed system, and there surely is no tool that evaluates applications written for the P2PDC environment. For this purpose, the dPerf prediction environment evaluates distributed applications written in C, C++, or Fortran and communicating via MPI or P2PSAP, in other words handling previous and future HPC systems.
III. P2PDCENVIRONMENT AND DPERF TOOL
In this section, we present the decentralized version of P2PDC based on a hybrid topology manager and a hierarchical task allocation mechanism which makes P2PDC more scalable and efficient. Afterwards we describe dPerf, our tool for predicting application performance in the P2PDC environment. In the sequel, the so-called task corresponds to a computation submitted to environment; a part of a computation assigned to a peer is called a subtask.
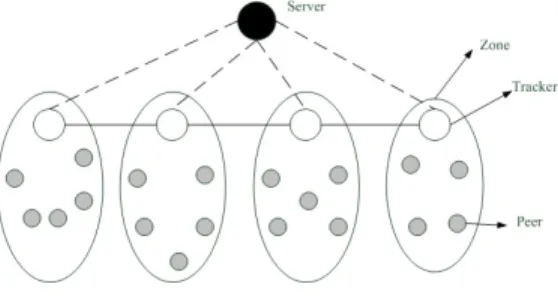
Fig. 1: General topology architecture.
Fig. 2: Trackers topology.
A. Hybrid topology manager
In the centralized version of P2PDC, a topology server manages informations regarding peers and allocates peers to a task. This centralized architecture is not scalable since the topology server is overloaded when the number of peer increases. Furthermore, when a topology server failure occurs, no task can be carried out. Thus, we have implemented a new topology architecture which is scalable and facilitates peers collection for computation.
1) General topology architecture: Figure 1 illustrates the general topology architecture. It consists of a Server, Trackers and Peers.
• Server manages informations regarding trackers
connec-tion/disconnection; it is the contact point of new nodes joining overlay network for the first time. When trackers or peers have no contact to join overlay network, they contact the server in order to receive a list of closest connected trackers, then they connect to trackers in the received list. The server can also store statistic informa-tion regarding connecinforma-tion/disconnecinforma-tion time, resources donated/consumed of all nodes in the overlay network.
• A tracker manages informations regarding a set of peers,
called a zone. It collects statistic information regarding connection/disconnection time, resources donated/con-sumed of peers in his zone and periodically sends these data to server.
• Peers are donors of computational resources. Peers are
grouped in zones and managed by the tracker of zone. Trackers topology is a line, see Figure 2. Each trackerT i maintains a set of closest trackers N i. In order to get rid of the case where some trackers can be isolated, there are, in the setN i, |N i|/2 closest trackers having IP address greater than IP address of owner tracker and |N i|/2 closest trackers having IP address smaller than IP address of owner tracker. Moreover, each tracker maintains connection with the closest tracker on right side and the closest tracker on left side.
1618 1614 1614
In a zone, peers publish their information regarding proces-sor, memory, hard disk and current usage state to tracker of zone and wait for works. Peers have to update periodically their usage state to tracker.
2) IP-based proximity metric: In the literature, there are several proximity metrics that can be used in order to calculate the proximity between peers in the network such as IP path length, AS path length, geographic distance, and measures related to RTT, etc (see [25]). Each metric has its own advantages and weakness. We have chosen IP-based proximity metric because it makes use of local informations (IP address) to calculate the proximity, hence it does not consume network resource and is faster than other metrics.
IP-based proximity metric [26] makes use of the longest common IP prefix length as the measure of proximity between peers. For example, in the case of 3 peers: P1 having IP address 145.82.1.1, P2 having IP address 145.82.1.129 and P3 having address 145.83.56.74. The longest common prefix between P1 and P2 is 24 bits, while the longest common prefix between P1 and P3 is 15 bits. So P1 considers that P2 is closer than P3.
3) Topology initialization: Initially, we suppose that the system has a server and some trackers managed by system administrator. These nodes are cores of the system and are on-line permanently. When the number of peers increases, system administrator choose some trust volunteers peers to become trackers. Trackers are chosen based on on-line time, i.e. volunteers peers with biggest on-line time will be chosen; moreover, trackers are chosen spearing on the IP range in order to ensure that the number of peer in a zone is balanced between zones. When P2PDC environment is downloaded and installed on a node, IP address of server and a list of trackers are set and stored in local memory. This tracker list will be updated when node joins to overlay network.
4) Tracker joins: When a new tracker connects to overlay network, it sends a join message to closest tracker in trackers list stored in local memory. If this tracker does not answer, then it sends join message to next closest trackers in trackers list. In the case where all trackers in the trackers list don’t answer, new tracker will contact the server; then the server sends to it a new trackers list. The tracker, when receiving a join message, calculates and compares the proximity between itself and new tracker with proximity between trackers in its closest trackers set N and new tracker. If contacted tracker found in its set N a tracker that is closer to new tracker, then it transfers join message to this tracker. This step repeats until the closest tracker to new tracker is found in the overlay network. The closest tracker firstly informs all trackers in set N about new tracker. Secondly, it removes the farthest tracker along the same side as new tracker in the set N and adds new tracker to the set N . Others trackers in the set N of closest trackers must adjust their setN along the same way. The closest tracker sends also its set N to new tracker so that new tracker can build its own setN . Finally, new tracker establishes connections with two closest trackers along the two sides in his setN . Figure 3 shows state of trackers topology after new trackerT 8 has joined overlay network.
Fig. 3: Trackers topology after a new tracker has joined.
Fig. 4: Trackers topology after a tracker has disconnected.
5) Tracker leaves: As a tracker maintains connections with two closest trackers along the two sides in the set N , a tracker disconnection can be detected by direct neighbors when connection is broken. Suppose that tracker T4 in Figure 2 crashes, its direct neighbors T3 and T5 detect disconnection of T4. T3 informs trackers along left side of his set N and the server about T4 disconnection. In order that trackers on left side of T3 can rebuild their set N, T3 sends also trackers list on right side of its set N; then these trackers replace T4 by a closest tracker received. Similarly, T5 informs trackers on right side of its set N and the server about T4 disconnection and sends to them trackers on left side of its set N. Afterwards, T3 establishes a connection with T5 and the two trackers send to each other the farthest trackers so that they can rebuild their set N. Figure 4 presents trackers topology after tracker T4 has disconnected.
6) Peer joins: When a new peer joins overlay network, it sends a join message to closest tracker in tracker list stored in local memory; the join message is transferred to tracker which is closest to new peer. The closest tracker adds this peer to its peers list and sends an accept message to new peer along with its neighbors set N. New peer updates its tracker list and sends their information regarding resources such as processor, memory, hard disk and current usage state to tracker of zone. After joining a zone, peers have to update periodically their resources usage state to tracker. When tracker receives state update from a peer, it sends an answer message to this peer.
7) Peer leaves: When a peer disconnects, tracker does not receive resources usage state update from this peer. If tracker does not receive state update of a peer after a time T, then tracker considers that this peer is disconnected. On the other hand, when a tracker disconnects, peers of this zone don’t receive answer message in response to state update message. If peers don’t receive answer message from tracker after a time T, then peers consider that this tracker is disconnected; then peers will send join message to closest tracker in their tracker list, i.e. they will join to neighbors zone.
We note that when the server disconnects, the system con-tinues working; topology of trackers and peers are maintained; new trackers and new peers can join to overlay network
Fig. 5: Allocation graph.
through their tracker list in local memory; Trackers store statistics information in local memory and send them to the server when the server comes back.
B. Peers collection for a task
When a node, the so-called submitter, wants to submit a task, it has to join the overlay network firstly; i.e. it finds a closest tracker and joins this zone. Then the submitter sends peer request message to its tracker; this message con-tains information regarding computation like task’s descrip-tion, number of peers needed initially, peers requirements; the tracker filters connected peers in its zone which satisfy requirements of the request and send these peers back to submitter. If number of peers collected by this trackers is not enough, then submitter requests peer from trackers in its local tracker list. If number of collected peers is not enough after having sent requests to all trackers in its local tracker list, then submitter requests more trackers address from the two farthest trackers on the two sides in its local tracker list. These two farthest trackers send to submitter trackers in their tracker list in other side with submitter. Then, submitter requests peers from news received trackers. This step repeats until enough peers have been collected. Peers reserved for a computation are considered busy and cannot be reserved for another computation.
C. Hierarchical task allocation
When submitter has collected enough peers, it divides peers into groups based on proximity; in each group, a peer is chosen by submitter to become coordinator which will manage others peers in group. The number of peers in a group cannot exceed
Cmaxin order to ensure efficient management of coordinator. We have chosen Cmax = 32. Submitter sends peers list of a group to coordinator. Then, the coordinator connects to all peer in its group and sends a ”reverse” message to peers. When a peer is reserved for a computation, it sends a message to its tracker to inform that it is not free any more. Figure 5 illustrates created peers graph.
Submitter decomposes task into subtasks and send subtasks to groups coordinators. Subtasks are then sent by coordinators to peers. Subtasks results are sent in inverse direction, i.e. peers send their subtask result to coordinator, then coordinator transfers them to submitter.
We note that hierarchical task allocation has many advan-tages as compared with the case where there are not coor-dinator. Firstly, hierarchical task allocation is faster because
submitter does not has to connect in succession to all peer in order to reserve peers and send subtasks; submitter has only connect to coordinators and peer reservation and subtask sending are carried out in parallel by coordinators; moreover, peers grouping is based on proximity, hence communication between coordinator and peers is faster than directed commu-nication between submitter and peers. Secondly, sending result to submitter via coordinators avoids bottleneck at submitter because if all peers send results directly to submitter, submitter may become a bottleneck.
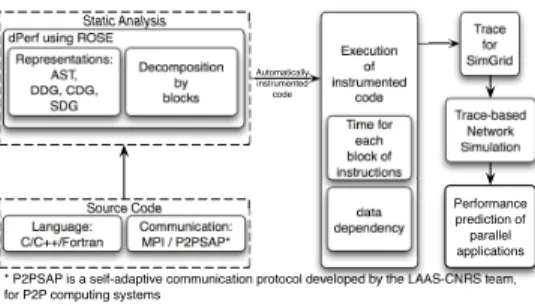
D. Performance prediction with dPerf - methodology and requirements Source Code Static Analysis Language: C/C++/Fortran Communication: MPI / P2PSAP* Execution of instrumented code Time for each block of instructions data dependency dPerf using ROSE
Representations: AST, DDG, CDG, SDG Decomposition by blocks Automatically instrumented code
* P2PSAP is a self-adaptive communication protocol developed by the LAAS-CNRS team, for P2P computing systems
Trace for SimGrid Trace-based Network Simulation Performance prediction of parallel applications
Fig. 6: dPerf prediction environment
The dPerf prediction environment is depicted in Fig. 6 and has previously been presented in [6]. We will briefly enumerate several requirements that must be met so that application performance prediction can be done, and then we quickly remind the most important aspects of dPerf.
1) Requirements: The prerequisites presented in the follow-ing ensure that the analysis of the input code, the execution of the transformed code and the simulation of trace files take place under best conditions.
Hardware counters: for obtaining very accurate information about user and system time based on performance counter registers. Accuracy was demonstrated in [27].
GNU/Linux and the Performance Counters kernel module: to the best of our knowledge, only Linux provides developers with a module and interfaces for reading the hardware coun-ters. Ways of enabling the performance counters module in the Linux kernel together with available interfaces are presented in [27].
PAPI: the Performance Application Programing Interface (PAPI) [28, 29] provides developers with simple interfaces for reading all information available in the hardware counters. The retrieval of information from registers is done with a minimum noise introduced into the measured system, and thus, any tool that uses PAPI has increased accuracy from measurement point of view.
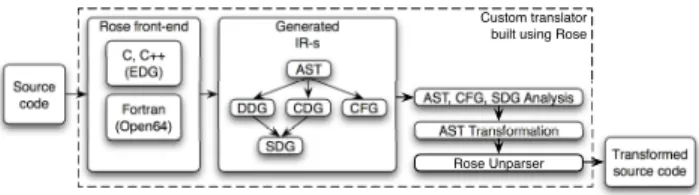
ROSE compiler: dPerf predictions are based on static anal-ysis of an input source code. The static code analyzer in dPerf is in fact a custom translator built using Rose Compiler framework [30]. Rose is a compiler infrastructure offering developers the necessary methods for building custom source-to-source program transformation and analysis tools (see Fig.
1620 1616 1616
7). It can analyze large scale applications. Since the custom tools based on Rose accept C, C++, Fortran, OpenMP and UPC programs, it means that these tools cover the most part of applications running on parallel and distributed systems. The Abstract Syntax Tree (AST) is the fundamental syntactic
Custom translator built using Rose
Transformed source code Source code Rose front-end C, C++ (EDG) Fortran (Open64) Generated IR-s AST DDG CDG CFG AST, CFG, SDG Analysis SDG AST Transformation Rose Unparser
Fig. 7: Diagram of a custom tool built using the Rose compiler framework
representation of a single file source code. It can be eas-ily analyzed and based on its traversal, any transformation can be performed. dPerf uses the AST built by Rose to identify key elements such as statements, basic blocks and calls for communication. For this reason, our tool gains a second advantage compared to other program analyzers, that is making use of the methods available within Rose for analyzing not only the AST, but also the data and control dependence graphs of an input code. Trace-based simulation
using Simgrid: for building custom network simulators or per-form fast trace-based simulations with the default simulation kernel available in Simgrid. From Simgrid [19] framework, we use the MSG module for replaying trace files based on a deployment platform defined by us. dPerf passes the output of our static analysis to SimGrid’s MSG module. Using this module, the communication time can be calculated for any network topology, this solving the communication time aspect of our application performance prediction.
2) Methodology: dPerf methodology has previously been described in [6], therefore, in this article, we briefly go through the most important aspects of our performance prediction approach. The dPerf approach for doing performance pre-diction for distributed applications running with the P2PDC decentralized environment is presented in the following.
Choosing the input source code: due to the fact that dPerf is built over Rose and Simgrid frameworks, any C, C++ or Fortran application can be passed as input.
Automatic static analysis: by calling methods available through Rose framework, dPerf parses the input source code and obtains an abstract syntax tree (AST) which will be analyzed automatically. Upon analysis, the AST is modified so that lines of code will be injected into the source code for instrumentation purposes. The AST representation allows dPerf to analyze the most basic instruction blocks in search for communication calls. The instructions representing calls for communication can be of any type, meaning that dPerf is cus-tomizable for recognizing multiple communication methods such as MPI or P2PSAP. This point in the analysis process is responsible for inserting into the studied AST of calls to the PAPI library for obtaining accurate measurement of time duration. Two ways of performing the automatic static analysis are implemented in dPerf, as explained in [6], but in this paper we only employ the simple block benchmarking technique.
The use of benchmarking by block makes it possible for dPerf results to be scaled-up while maintaining accuracy in predicting the performance.
Unparsing the AST transformations: once all transforma-tions at AST level are made, dPerf unparses the modified AST into a source code of the same programming language as the input one.
Build the transformed code using several compiler opti-mization levels: in order to provide performance estimation with respect to various optimizations of the compiler, the transformed source code is compiled, in turn, using GCC optimization levels 0, 1, 2, 3 and s.
Obtaining trace files: by running the compiled transformed source code, the result consists in a set of trace files for each execution and per participating process or node. Traces con-tain computation time measured using hardware counters and expressed in nanoseconds, followed by relevant parameters for communication calls.
Using Simgrid to calculate prediction result: the trace files obtained earlier are given at input to Simgrid, but not before configuring the distributed network to be simulated. The platform description file being ready and the trace files available, with Simgrid we calculate the necessary time for communicating over the network. To this time, Simgrid adds the computation time already present in the trace file. The output is the total predicted time (tpredicted) for the input
application.
An important feature of dPerf is the reduced slowdown due to the use of block benchmarking techniques [6].
IV. EXPERIMENTS WITH DPERF ONP2PDC The experimental setup for predicting application perfor-mance with dPerf for applications running in a decentralized P2PDC environment consists of two parts. First, we prove the accuracy of a dPerf performance prediction on a homogeneous cluster. Then we propose a case study for testing several possible network topologies on a peer-to-peer computing grid consisting of identical machines as those used in a cluster. For simplicity, we will refer to these two stages of the experiment as Stage-1 and Stage-2. We want to show that using dPerf we can find the best peer-to-peer system configuration which would match the computing power of the homogeneous cluster.
A. Experimental setup
1) Input source code - the obstacle problem: the experi-ments are performed on a source code for the obstacle prob-lem. This code written in C was developed in the framework of the ANR CIP project [31] (see also [32]). In [5], the code for the obstacle problem was adapted to the P2PDC environment. Communications between peers are made via the P2PSAP protocol.
2) Compiler options: the GCC compiler is used for com-piling the source code. The code of the obstacle problem is compiled in turn with the option corresponding to each of the following optimization levels: 0, 1, 2, 3, s.
3) Computing system nodes: for achieving experimental results, we are using some of the available resources of Grid’5000 [33], an experimental testbed composed of around 5000 CPUs distributed over 9 sites throughout France. In Stage-1 we employ 2n nodes of the Bordeplage cluster [34],
with n ∈ {1, 2, 3, 4, 5}. In Stage-2 we use the same 2n
nodes with n ∈ {1, 2, 3, 4, 5}, but the network topologies are different from the one in Stage-1. On each working node, only one core is employed, regardless of the total number of available cores per node. The nodes are Intel Xeon EM64T 3GHz, 1 MB L2 cache, 2 GB Memory.
4) Computing system network infrastructure: in Stage-1, the cluster network topology is the following:
• all network interface cards (NIC) are 1 Gbps Gigabit
Ethernet with a latency of 100 microseconds;
• cluster backbone bandwidth is of 10 Gbps with a latency
of 100 microseconds.
In Stage-2 of the experiment, the same node types as the ones in Stage-1 are used, but connected, in turn, by two different network topologies (Stage-2A and Stage-2B). Both networks enumerated below connect a number of 210
nodes, out of which we use, in turn, 21
..25
nodes, in order to be directly comparable to Stage-1. All connections are full-duplex.
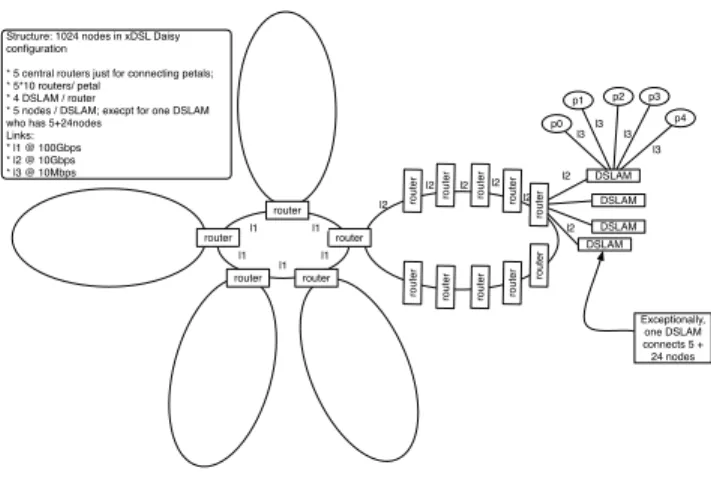
1) Stage-2A: a Daisy Topology, as described in [10, 35, 36].
• 5 central routers;
• 5 petals, each with 10 routers on it;
• 4 DSLAM units connected to each router on the
petals;
• 5 nodes connected to each DSLAM, except the
central ones;
• all links between routers are of 10Gbps, except the
central ring which is at 100Gbps;
• all links from DSLAM to routers are of 10Gpbs; • all links from nodes to DSLAM are of 5 to 10 Mbps,
value randomly assigned;
This configuration (see Fig. 8) is used by most Internet providers in Europe for xDSL lines in particular. xDSL refers to any type of Digital Subscriber Line, includ-ing asymmetric DSL (ADSL), symmetric DSL (SDSL), very-high-bitrate DSL (VDSL), etc.
2) Stage-2B: a regular Local Area Network
• backbone of 1 Gbps
• each node is connected to the backbone at 100 Mbps
By using these network configurations we want to calculate the number of distributed nodes that need to be connected over xDSL or LAN in order to provide the equivalent computation power of a cluster.
B. Results obtained with dPerf
The experiments detailed below are a comparison between a reference time (CPU + communication) and a prediction for a peer-to-peer system using identical machines but different network topologies. All this is done for finding at what point the cluster computing power is equivalent to the power supplied by a desktop grid over xDSL lines or LAN.
l3 l3 l3 l3 l2 l2 l2 l2 l2 l2 router router router router router
router router router router
router router router router router router DSLAM DSLAM DSLAM DSLAM p0 p1 p2 p4 p3 Exceptionally, one DSLAM connects 5 + 24 nodes Structure: 1024 nodes in xDSL Daisy
configuration
* 5 central routers just for connecting petals; * 5*10 routers/ petal
* 4 DSLAM / router
* 5 nodes / DSLAM; execpt for one DSLAM who has 5+24nodes
Links: * l1 @ 100Gbps * l2 @ 10Gbps * l3 @ 10Mbps l1 l1 l1 l1 l1 l2
Fig. 8: Stage-2A Daisy topology to describe a xDSL network.
1) Reference time: the reference time tnormal execution is
obtained during Stage-1 by compiling and running the code on the Bordeplage cluster. The distributed environment is P2PDC and the end of each execution displays an overall execution time measured using hardware counters and expressed in nanoseconds. Fig. 9 depicts the reference time for 2, 4, 8, 16 and 32 nodes using each compiler optimization level.
0 5 10 15 20 25 30 35 40 45 2 4 8 16 32 tnormal execution [s] Number of peers Obstacle problem in P2PDC environment
optimizaton level 0 optimizaton level 1 optimizaton level 2 optimizaton level 3 optimizaton level s
Fig. 9: Stage-1 reference execution time for all optimization levels.
2) Predicted time: the prediction obtained during Stage-1 is based on simulating identical cluster configuration, that is nodes and network topology. For this, all files from the obstacle problem source which contain calls to P2PSAP com-munication are passed as input to dPerf. dPerf automatically analyzes them and prepares them for instrumentation, as de-scribed in section III-D. The output is then compiled, ran and trace files are obtained. A platform description file is necessary for performing trace-based simulation. In Stage-1, the platform file defines a network topology identical to the real one used in the Grid5000 cluster. In Stage-2A, the platform description file defines a Daisy Topology xDSL network infrastructure, the most widely solution for domestic Internet access lines. In Stage-2B, the network used for trace-based simulations is a typical LAN, used by most university campuses, corporates,
1622 1618 1618
TABLE I: Comparing equivalent predictions and the corresponding computing power in Grid5000.
Processes Performance Processes
number topology (than) number topology
4 xDSL slightly lower 2 Grid5000
2 LAN slightly lower 2 Grid5000
4 LAN slightly lower 4 Grid5000
8 LAN same as 4 Grid5000
32 LAN slightly lower 8 Grid5000
and other research facilities. Simgrid uses the trace files and the platform description files, the result being the predicted
timetpredicted.
3) Comparison of reference and predicted time for Stage-1:
Fig. 10 depicts the comparison betweentnormal execution and
tpredicted during Stage-1. It can be noticed that the reference
time and the prediction calculated with dPerf are very close, meaning that dPerf yields an accurate prediction. Due to the fact that prediction is accurate at all optimization levels, only level 3 of GCC optimization is presented in Fig. 10.
0 2 4 6 8 10 12 14 16 2 4 8 16 32 Time [s] Number of peers Obstacle problem in P2PDC environment prediction with dPerf
reference time
Fig. 10: Stage-1 reference time compared to predicted time. GCC optimization level 3.
4) Finding equivalent computing power in a peer-to-peer desktop grid over xDSL or LAN: Stage-2 of the experimental part consists in finding the equivalent computing power of the Bordeplage cluster in a peer-to-peer desktop grid. Due to the precision in predicting execution time shown for Stage-1, we will present the results for scenarios that are closer to real-life situations. The reference time obtained by running the code with P2PDC is compared to the situation where a desktop grid of computers are connected to a xDSL and afterwards over LAN and communicate in P2PDC. A four-way comparison is presented in Fig. 11. We remind that the prediction process is accurate and the results presented in the following are the prediction of performance if we would replace the computing power of Grid5000 by an xDSL or a LAN. In Stage-2A, our attempt to find an equivalent xDSL desktop grid gives unsat-isfactory results due to the computation- and communication-intensive type of the numerical simulation code. Although the communication size is reduced, the necessary time to exchange data tends to increase exponentially with the number of peers, while the computation load per peer decreases. We
do notice that four processes in xDSL are slightly slower than two processes in Grid5000. In Stage-2B, we estimate better performances in peer-to-peer if we use LAN for solving the obstacle problem. Fig. 11 and table I show the comparison results when the code is compiled with optimization level 0. We see that, for example, we may choose to deploy the parallel code in P2PDC using eight peers on LAN instead of waiting for four available nodes on Grid5000.
0 10 20 30 40 50 60 2 4 8 16 32 Time [s] Number of peers Obstacle Problem in P2PDC Environment
Optimization Level 0
reference time dPerf prediction for Grid5000 dPerf prediction for xDSL dPerf prediction for LAN
Fig. 11: Reference time compared to predicted time for Grid5000 cluster, xDSL and LAN, for optimization level 0.
V. CONCLUSION AND FUTURE WORK
This paper introduced the decentralized version of the peer-to-peer HPC environment P2PDC along with a set of experi-ments to show the accuracy of dPerf in predicting performance for applications running with P2PDC.
The features presented for P2PDC are meant to provide our decentralized environment with scalability and robustness. By introducing the hybrid topology manager, peers are handled more efficiently, and peer collection in view of a computation is facilitated. We presented how task allocation to peers is accelerated and bottlenecks at submitter are avoided by intro-ducing a hierarchical task allocation mechanism. As shown in through experiments, dPerf accurately predicts application performance based on a set of trace files obtained on a reference platform. The novelty of this paper from a prediction point of view is the possibility to use dPerf for finding an equivalent computing power of a homogeneous cluster in a peer-to-peer computing platform connected over a xDSL network or over LAN, thus placing P2PDC and dPerf in a real-life situation.
Currently we are carrying out computation tests with P2PDC on several testbeds like PlanetLab and Grid5000 and from a prediction point of view we mention ongoing research on multi-core architectures so that dPerf would efficiently calculate the equivalent computing power of a homogeneous cluster in a completely heterogeneous peer-to-peer grid con-nected over a heterogeneous network. Another near-future goal is to be able to supply application prediction with P2PDC for a few hundreds up to a few thousand machines by scaling-up static analysis obtained with dPerf.
ACKNOWLEDGMENT
This work is funded by the French National Agency for Research under the ANR-07-CIS7-011 contract [31]. Exper-iments presented in this paper were carried out using the Grid5000 experimental testbed, being developed under the INRIA ALADDIN development action with support from CNRS, RENATER and several Universities as well as other funding bodies [33].
REFERENCES
[1] Gnutella protocol development. [Online]. Available: http://rfc.gnutella.sourceforge.net
[2] The freenet network project. [Online]. Available: http://freenet.sourceforge.net
[3] D. El Baz and T. T. Nguyen, “A self-adaptive commu-nication protocol with application to high performance peer to peer distributed computing,” in PDP’10: Proc.
of the 18th Euromicro Conf. on Parallel, Distributed and Network-based Processing. Washington, DC, USA: IEEE Computer Society, 2010, pp. 327–333.
[4] O. Aumage and G. Mercier, “MPICH/Madeleine: a True Multi-Protocol MPI for High Performance Networks,” in
IPDPS’01: 15th International Parallel and Distributed Processing Symposium. IEEE, 2001, pp. 5–1.
[5] T. T. Nguyen, D. El Baz, P. Spiteri, G. Jourjon, and M. Chau, “High performance peer-to-peer distributed computing with application to obstacle problem,” in
IPDPSW’10: IEEE International Symposium on Paral-lel Distributed Processing, Workshops and Phd Forum, 2010, pp. 1–8.
[6] B. F. Cornea and J. Bourgeois, “Performance prediction of distributed applications using block benchmarking methods,” in PDP’11: Proc. of the 19th Euromicro Conf.
on Parallel, Distributed and Network-Based Processing. IEEE Computer Society, 2011.
[7] J. Bourgeois and F. Spies, “Performance prediction of an NAS benchmark program with ChronosMix environ-ment,” in Euro-Par’00: Proc. from the 6th International
Euro-Par Conf. on Parallel Processing. London, UK: Springer-Verlag, 2000, pp. 208–216.
[8] MPI. The message passing interface standard. [Online]. Available: http://www-unix.mcs.anl.gov/mpi
[9] J.-B. Ernst-Desmulier, J. Bourgeois, F. Spies, and J. Ver-beke, “Adding new features in a peer-to-peer distributed computing framework,” in PDP’05: Proc. of the 13th
Euromicro Conf. on Parallel, Distributed and Network-Based Processing. Washington, DC, USA: IEEE Com-puter Society, 2005, pp. 34–41.
[10] J.-B. Ernst-Desmulier, J. Bourgeois, and F. Spies, “P2pperf: a framework for simulating and optimizing peer-to-peer-distributed computing applications,”
Con-currency and Computation: Practice & Experience, vol. 20, no. 6, pp. 693–712, 2008.
[11] J. Bourgeois, J.-B. Ernst-Desmulier, and F. Spies, “Eval-uation of a performance prediction tool for peer-to-peer distributed computing applications,” in
PMAC-2WN’09/ICPADS’09: Workshop on Performance
Mod-elling and Analysis of Communication in Wired and Wireless Networks. IEEE Computer Society Press, 2009, pp. 814–820.
[12] D. P. Anderson, “Boinc: A system for public-resource computing and storage,” in GRID’04: 5th IEEE/ACM
In-ternational Workshop on Grid Computing. Washington, DC, USA: IEEE Computer Society, 2004, pp. 4–10. [13] F. B. N. Andrade, W. Cirne and P. Roisenberg, “Ourgrid:
An approach to easily assemble grids with equitable resource sharing,” in Proc. of the 9th Workshop on
Job Scheduling Strategies for Parallel Processing, ser. Lecture Notes in Computer Science, vol. 2862. Springer Berlin / Heidelberg, 2003, pp. 61–68.
[14] J. Dean and S. Ghemawat, “Mapreduce: Simplified data processing on large clusters,” OSDI’04: Proc. of the 6th
Conf. on Symposium on Opearting Systems Design and Implementation, vol. 6, 2004.
[15] D. Culler, R. Karp, D. Patterson, A. Sahay, K. E. Schauser, E. Santos, R. Subramonian, and T. von Eicken, “LogP: towards a realistic model of parallel computa-tion,” Proc. of the 4th ACM SIGPLAN symposium on
Principles and practice of parallel programming, vol. 28, no. 7, pp. 1–12, 1993.
[16] D. Sundaram-Stukel and M. K. Vernon, “Predictive analysis of a wavefront application using LogGP,” 7th
ACM SIGPLAN Symposium on Principles and Practice of Parallel Programming, vol. 34, no. 8, pp. 141–150, 1999.
[17] A. J. C. van Gemund, “Symbolic performance modeling of parallel systems,” IEEE Transactions on Parallel and
Distributed Systems, vol. 14, no. 2, pp. 154–165, 2003. [18] R. H. Saavedra and A. J. Smith, “Analysis of benchmark
characteristics and benchmark performance prediction,”
ACM Transactions on Computer Systems, vol. 14, no. 4, pp. 344–384, 1996.
[19] H. Casanova, A. Legrand, and M. Quinson, “SimGrid: A generic framework for large-scale distributed exper-iments,” in UKSIM’08: Proc. of the 10th International
Conf. on Computer Modeling and Simulation. Wash-ington, DC, USA: IEEE Computer Society, 2008, pp. 126–131.
[20] S. Prakash and R. L. Bagrodia, “MPI-SIM: using parallel simulation to evaluate mpi programs,” in WSC’98: Proc.
of the 30th conference on Winter simulation. IEEE Computer Society Press, 1998, pp. 467–474.
[21] V. S. Adve, R. Bagrodia, J. C. Browne, E. Deelman, A. Dube, E. N. Houstis, J. R. Rice, R. Sakellariou, D. J. Sundaram-Stukel, P. J. Teller, and M. K. Vernon, “PO-EMS: End-to-end performance design of large parallel adaptive computational systems,” IEEE Transactions on
Software Engineering, vol. 26, pp. 1027–1048, 2000. [22] A. Snavely, N. Wolter, and L. Carrington, “Modeling
application performance by convolving machine sig-natures with application profiles,” in WWC’01: IEEE
International Workshop on Workload Characterization. Washington, DC, USA: IEEE Computer Society, 2001, pp. 149–156.
[23] R. M. Badia, F. Escal´e, E. Gabriel, J. Gimenez, R. Keller,
1624 1620 1620
J. Labarta, and M. S. M¨uller, “Performance prediction in a grid environment,” in Grid Computing, ser. Lecture Notes in Computer Science. Springer Berlin / Heidel-berg, 2004, vol. 2970, pp. 257–264.
[24] J. Zhai, W. Chen, and W. Zheng, “Phantom: predicting performance of parallel applications on large-scale par-allel machines using a single node,” in PPoPP’10: Proc.
of the 15th ACM SIGPLAN symposium on Principles and practice of parallel programming. New York, NY, USA: ACM, 2010, pp. 305–314.
[25] B. Huffaker, M. Fomenkov, D. J. Plummer, D. Moore, k claffy, B. H. M. Fomenkov, and A. Background, “Distance metrics in the internet,” in IEEE International
Telecommunications Symposium, 2002, pp. 200–2. [26] J. Zhao and J.-D. Lu, “Solving overlay mismatching
of unstructured p2p networks using physical locality information,” vol. 0. Los Alamitos, CA, USA: IEEE Computer Society, 2006, pp. 75–76.
[27] D. Zaparanuks, M. Jovic, and M. Hauswirth, “Accuracy of performance counter measurements,” in ISPASS’09:
IEEE International Symposium on Performance Analysis of Systems and Software, Boston, MA, USA, 2009, pp. 23–32.
[28] PAPI project website. [Online]. Available: http://icl.cs. utk.edu/papi/
[29] PAPI sc2008 handout (papi-2008.pdf). [Online]. Available: http://icl.cs.utk.edu/graphics/posters/files/ [30] M. Schordan and D. Quinlan, “A source-to-source
archi-tecture for user-defined optimizations,” in Modular
Pro-gramming Languages, ser. Lecture Notes in Computer Science. Springer Berlin / Heidelberg, 2003, vol. 2789, pp. 214–223.
[31] ANR-07-CIS7-011. ANR CIP web site. [Online]. Available: http://spiderman-2.laas.fr/CIS-CIP
[32] P. Spit´eri and M. Chau, “Parallel Asynchronous Richard-son Method for the Solution of Obstacle Problem,” in
Proc. of the 16th Annual International Symposium on High Performance Computing Systems and Applications. Los Alamitos, CA, USA: IEEE Computer Society, 2002, pp. 133–138.
[33] Grid5000 platform. [Online]. Available: http://www. grid5000.fr
[34] Bordeaux hardware resources. [Online]. Avail-able: https://www.grid5000.fr/mediawiki/index.php/ Bordeaux:Hardware
[35] S. Linck, E. Dedu, and F. Spies, “Distance-dependent RED policy (DDRED),” in International Conf. on
Net-working (ICN). Sainte-Luce, Martinique: IEEE, 2007, pp. 1–6.
[36] E. Dedu and E. Lochin, “A study on the benefit of TCP packet prioritisation,” in PDP’09: Proc. of the 17th
Euromicro Conf. on Parallel, Distributed and Network-based Processing. Weimar, Germany: IEEE Computer Society, 2009, pp. 161–166.