HAL Id: hal-00295350
https://hal.archives-ouvertes.fr/hal-00295350
Submitted on 24 Oct 2003
HAL is a multi-disciplinary open access
archive for the deposit and dissemination of
sci-entific research documents, whether they are
pub-lished or not. The documents may come from
teaching and research institutions in France or
abroad, or from public or private research centers.
L’archive ouverte pluridisciplinaire HAL, est
destinée au dépôt et à la diffusion de documents
scientifiques de niveau recherche, publiés ou non,
émanant des établissements d’enseignement et de
recherche français ou étrangers, des laboratoires
publics ou privés.
transport to the Arctic
S. Eckhardt, A. Stohl, S. Beirle, N. Spichtinger, P. James, C. Forster, C.
Junker, T. Wagner, U. Platt, S. G. Jennings
To cite this version:
S. Eckhardt, A. Stohl, S. Beirle, N. Spichtinger, P. James, et al.. The North Atlantic Oscillation
con-trols air pollution transport to the Arctic. Atmospheric Chemistry and Physics, European Geosciences
Union, 2003, 3 (5), pp.1769-1778. �hal-00295350�
Atmos. Chem. Phys., 3, 1769–1778, 2003
www.atmos-chem-phys.org/acp/3/1769/
Atmospheric
Chemistry
and Physics
The North Atlantic Oscillation controls air pollution transport to the
Arctic
S. Eckhardt1, A. Stohl1,4, S. Beirle2, N. Spichtinger1, P. James1, C. Forster1, C. Junker3, T. Wagner2, U. Platt2, and S. G. Jennings3
1Department of Ecology, Technical University of Munich, Germany 2Institute of Environmental Physics, Heidelberg University, Germany 3Department of Experimental Physics, National University of Ireland, Ireland
4now at Cooperative Institute for Research in Environmental Sciences, University of Colorado/NOAA Aeronomy Laboratory,
USA
Received: 4 April 2003 – Published in Atmos. Chem. Phys. Discuss.: 24 June 2003 Revised: 29 September 2003 – Accepted: 16 October 2003 – Published: 24 October 2003
Abstract. This paper studies the interannual variability of
pollution pathways from northern hemisphere (NH) conti-nents into the Arctic. Using a 15-year model simulation of the dispersion of passive tracers representative of anthro-pogenic emissions from NH continents, we show that the North Atlantic Oscillation (NAO) exerts a strong control on the pollution transport into the Arctic, particularly in win-ter and spring. For tracer lifetimes of 5 (30) days, surface concentrations in the Arctic winter are enhanced by about 70% (30%) during high phases of the NAO (in the following referred to as NAO+) compared to its low phases (NAO−). This is mainly due to great differences in the pathways of European pollution during NAO+and NAO−phases, respec-tively, but reinforced by North American pollution, which is also enhanced in the Arctic during NAO+ phases. In con-trast, Asian pollution in the Arctic does not significantly de-pend on the NAO phase. The model results are confirmed us-ing remotely-sensed NO2vertical atmospheric columns
ob-tained from seven years of satellite measurements, which show enhanced northward NO2transport and reduced NO2
outflow into the North Atlantic from Central Europe during NAO+phases. Surface measurements of carbon monoxide
(CO) and black carbon at high-latitude stations further cor-roborate the overall picture of enhanced Arctic pollution lev-els during NAO+phases.
Correspondence to: A. Stohl
1 Introduction
During winter and spring, the Arctic suffers from high levels of anthropogenic pollution (Mitchell, 1957), leading to de-creased visibility – the Arctic haze (Barrie, 1986) – radiative forcing of the Arctic climate (Garrett et al., 2002), soil pol-lution (Meijer et al., 2003), and accumulation of persistent organic chemicals (Wania, 2003). Accumulation of ozone precursors in the Arctic in winter and their release to lower latitudes in spring also causes a peak in photochemical ozone formation, contributing to the spring-time maximum in pho-tooxidants that is observed throughout much of the north-ern hemisphere (NH) troposphere (Penkett and Brice, 1986). Factors that cause the winter/spring maximum of Arctic pol-lution, i.e. seasonal changes in pollutant removal rates, pho-tochemical processes, local meteorology and pollution trans-port pathways, are reasonably well understood now (Barrie, 1986; Polissar et al., 2001). There is also evidence for down-ward trends of, e.g., sulfate, cadmium, or aerosols that have been related to emission reductions (Bodhaine, 1989; Li et al., 2003). However, little attention has yet been paid to the influence of climate variability on interannual changes of Arctic air pollution levels.
In the NH, especially during the winter months, the most prominent and recurrent pattern of atmospheric variability is the North Atlantic Oscillation (NAO), a redistribution of at-mospheric mass between the Arctic and the subtropical At-lantic (Hurrell, 1995). Oscillations between high and low NAO phases produce large changes in the mean wind speed and direction over the Atlantic, the heat and moisture trans-port between the Atlantic and the neighbouring continents, and the intensity and number of storms (Hurrell et al., 2003). Thus, NAO-related influences on hemispheric-scale pollu-tion transport are to be expected. Indeed, it has been shown that the NAO influences the transport of Saharan dust into
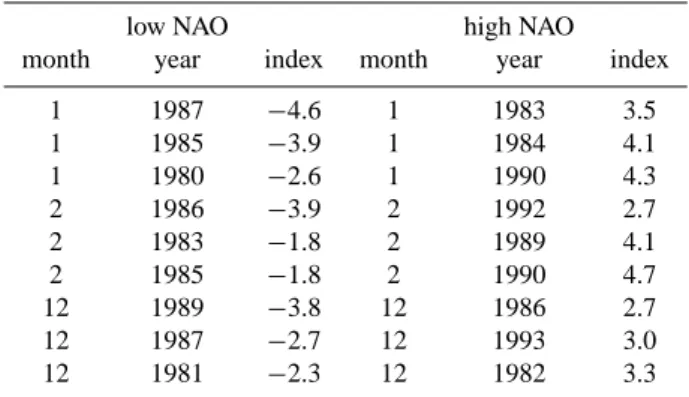
Table 1. Winter months and their associated monthly NAO index used for constructing the low and high NAO index ensembles for the 15-year climatology, respectively (indices downloaded on July, 2002)
low NAO high NAO
month year index month year index
1 1987 −4.6 1 1983 3.5 1 1985 −3.9 1 1984 4.1 1 1980 −2.6 1 1990 4.3 2 1986 −3.9 2 1992 2.7 2 1983 −1.8 2 1989 4.1 2 1985 −1.8 2 1990 4.7 12 1989 −3.8 12 1986 2.7 12 1987 −2.7 12 1993 3.0 12 1981 −2.3 12 1982 3.3
the Atlantic and Mediterranean (Moulin et al., 1997), and photochemical model calculations suggest that it may also modify the transport of pollutants from North America to Eu-rope (Li et al., 2002). Here we present a significant correla-tion between the NAO and air pollucorrela-tion transport towards the Arctic. The results of this paper represent a strong relation-ship between the NAO and model results of global pollution transport as well as CO and BC concentration measured at high latitude measurement stations and NO2retrieved using
spectral data from the Global Ozone Monitoring Experiment (GOME). According to our results, the NAO exhibits the strongest influence on NH pollution transport out of a series of popular indices describing climate variability in various regions of the globe (other indices investigated were, e.g., the Southern Oscillation, Pacific-North America pattern, Arctic Oscillation). Thus, we concentrate here on the NAO, but we also briefly discuss the Arctic Oscillation, which is related to the NAO.
2 Methods
Poleward transport of air pollution was examined in a 15-year (1979–1993) climatology of modelled tracer transport, an extension to a previous one-year study (Stohl et al., 2002). The climatology is based on calculations with the Lagrangian particle dispersion model FLEXPART (Stohl et al., 1998), driven by six-hourly meteorological re-analysis data from the European Centre for Medium-Range Weather Forecasts (ECMWF) (Gibson et al., 1999). FLEXPART treats advec-tion and turbulent diffusion by calculating the trajectories of a multitude of particles. Stochastic fluctuations, obtained by solving Langevin equations (Stohl and Thomson, 1999), are superimposed on the grid-scale winds to represent transport by turbulent eddies. More detailed descriptions of FLEX-PART and typical applications can be found in papers by Stohl et al. (2002, 2003) and Forster et al. (2001). In order
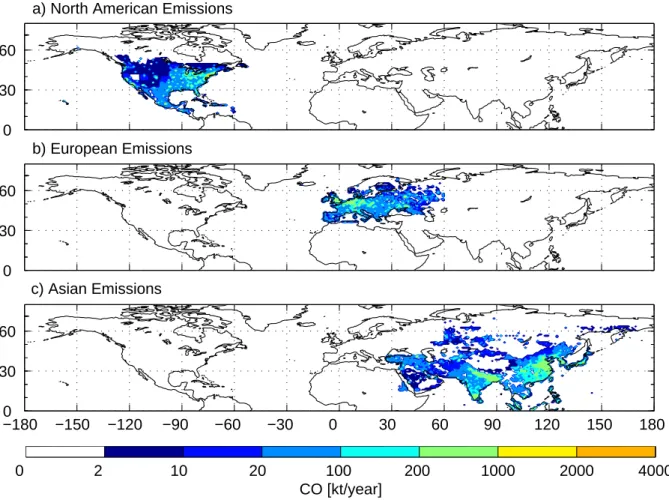
to identify the typical pathways taken by pollution plumes originating from the different continents (and their variations with the NAO), we simulated the transport of three (Asian, European, North American) carbon monoxide (CO) pollu-tion tracers. The model setup was the same as in our pre-vious study (Stohl et al., 2002), but the model was run for 15 years using the meteorological re-analysis data. Emis-sions were taken from the global EDGAR version 2 inven-tory (Olivier et al., 1996) with the base year 1990. Attri-bution of an EDGAR grid cell to a particular continent was done approximately according to the continental boundaries shown on a geographical map, resulting in the emission dis-tribution shown in Fig. 1. For North America, Europe and Asia, 240 000, 230 000, and 500 000 particles were released per month, respectively. Anthropogenic CO emissions have a distribution similar to the emissions of many other anthro-pogenic pollutants, and thus are used here also as a proxy for anthropogenic pollution in a general sense.
Particles were quasi-continuously (i.e., every 15 minutes) emitted over the 15-year period. They were tagged with their release time and followed in the simulation for 50 days. Knowing the particles’ release time allowed to bin them into 12 age classes. From this dataset, concentrations were cal-culated every 15 minutes on a three-dimensional (3◦×5◦
(latitude/longitude) and 20 vertical levels up 20 km) grid. Monthly averages of these fields are used in this study. Thus, for every month of our simulation, 12 concentration fields, each one consisting of tracer of definite age only (e.g., 0– 2 days for the “youngest” age class, and 40–50 days for the “oldest” age class) were available for further analyses. This age-spectrum approach is popular in stratospheric re-search (Hall and Plumb, 1994) and a thorough theoretical de-scription of this method applied to intercontinental pollution transport has recently been published by Holzer et al. (2003). The age spectra are useful for showing how tracer dispersion looks like in a climate-average, taking short-term variations in transport fully into account.
Chemical species in the atmosphere can be characterized by their lifetime τ , after which their mass has decreased to 1/e of its initial value (i.e., the mass emitted). To determine the concentration Cτ of a species with lifetime τ from the
discrete age spectra, we can use
|Cτ |≈ N X n=1 Cne− tn τ, (1)
where Cnis the tracer concentration in the age class n, tnis
the mean age of class n, and N is the number of age classes used (12 in our case). This approximate relationship holds for species with lifetimes well within the range of the age classes available, i.e. not for species with very short or very long lifetimes.
The age spectra can also be used conveniently to create movies (each consisting of N frames) of time-mean tracer dispersion. This can be done either for an individual month
S. Eckhardt et al.: NAO controls Arctic air pollution 1771 0 30 60 0 30 60 −180 −150 −120 −90 −60 −30 0 30 60 90 120 150 180 0 30 60 0 2 10 20 100 200 1000 2000 4000 CO [kt/year]
a) North American Emissions
b) European Emissions
c) Asian Emissions
Fig. 1. Anthropogenic CO emissions in kilotons CO per year and 1◦×1◦grid cell according to the EDGAR inventory for the base year 1990 for North America (a), Europe (b) and Asia (c).
(note that we have monthly model output), or for ensem-bles averaged over months with similar properties (e.g., high NAO indices). These averaged fields are furtheron referred to as composites. To obtain the composites, the age spectra of the months pertaining to the ensemble are averaged.
In order to study the NAO’s influence on tracer transport, we have produced composite movies representing ensem-ble averages of the winter months with the highest (here-after referred to as NAO+) and lowest (NAO−) 20% of all NAO indices. The mean values of these ensembles are 3.6 and −3.0, respectively. Table 1 gives detailed information on the months and indices used to create the NAO+ and
NAO− composites. The NAO index used here was
calcu-lated from the difference of sea level pressure (SLP) be-tween Ponta Delgada, Azores and Stykkisholmur/Reykjavik, Iceland normalized with the standard deviation in SLP for each station (Hurrell, 1995).In wintertime the NAO index ex-plains 33% of the total variance of the SLP field over the Atlantic (Hurrell and v. Loon , 1997). The monthly NAO in-dex values were taken from an internet website (http://www. cgd.ucar.edu/∼jhurrell/nao.html). This website was updated
since we downloaded the data, and the recent values have changed slightly from those that we have used here. How-ever, the changes are small and, as we have checked, do not affect our results noticeably. A correlation and linear regres-sion analysis between tracer concentration and the NAO in-dex was performed for every individual model grid cell, such that the spatial distribution of the correlations and regressions could be shown. This is a standard technique used in clima-tology (e.g. Hurrell et al., 2003).
3 Results
Figure 2 shows snapshots from the two dispersion movies of the European tracer for composites based on months with NAO+ conditions and months with NAO− conditions, re-spectively. The full movies showing the dispersion of the European, Asian and North American tracers are available from the internet website http://www.forst.tu-muenchen.de/ EXT/LST/METEO/arcticpollution. After 2–4 days (Fig. 2a and b), the European pollution plume is largely confined to south of 60◦N for NAO−, but it reaches 70◦N for NAO+.
−300 0 30 60 90 120 150 0 0 0 0 0 0 2 4 6 8 10 12 14 16 −300 0 30 60 90 120 150 0 0 0 0 0 −30 0 30 60 90 120 150 30 40 50 60 70 80 −30 0 30 60 90 120 150 30 40 50 60 70 80 0 1 2 3 4 5 6 7 [mg m−2] [mg m−2]
b) NAO+, Age: 2−4 days a) NAO−, Age: 2−4 days
d) NAO+, Age: 8−10 days c) NAO−, Age: 8−10 days
Fig. 2. European tracer columns [mg m−2] 2–4 days (a, b), and 8–10 days (c, d) after tracer emission. The two composites represent the three December, January and February months with the lowest and highest NAO index, respectively, selected from a 15-year (1979–1993) period.
After 8–10 days (Figs. 2c and d), most of the European tracer is found south (north) of the Arctic circle for the NAO− (NAO+) composites. In the movies, large differences be-tween the two NAO phases are evident for up to 25 days, after which the differences decrease. Thus, while Euro-pean pollution is eventually transported to the Arctic under both regimes, the poleward transport is faster during NAO+ phases.
Figure 3 shows the corresponding plots for the North America tracer. Like for the European tracer, more North American tracer reaches Arctic latitudes during NAO+ phases, even though the differences between the NAO+and NAO− are smaller. The tracer’s transport across the North
Atlantic is faster and directed towards higher latitudes for the NAO+ensemble. Transport of North American air pollution is strongly affected by the warm conveyor belt airstreams of extratropical cyclones (Stohl et al., 2002), and these warm conveyor belts show a similar correlation with the NAO (Eckhardt et al., 2003).
In order to quantify the contributions of European, Asian and North American emissions to the Arctic pollution, we plot for both NAO phases the average tracer mixing ratios at the surface, averaged over the Arctic region north of 70◦N, in dependence of the tracer’s e-folding lifetime. Fig. 4 reveals three important facts: Firstly, European emissions contribute more to Arctic pollution than Asian and North American
S. Eckhardt et al.: NAO controls Arctic air pollution 1773 −180 −120 −60 0 60 120 180 −20 0 20 40 60 80 −180 −120 −60 0 60 120 180 −20 0 20 40 60 80 0 1 2 3 4 −180 −120 −60 0 60 120 180 −20 0 20 40 60 80 −180 −120 −60 0 60 120 180 −20 0 20 40 60 80 0 2 4 6 8 10 12 14 16 [mg m−2] [mg m−2]
a) NAO−, Age: 2−4 days c) NAO−, Age: 8−10 days
b) NAO+, Age: 2−4 days d) NAO+, Age: 8−10 days
Fig. 3. Same as Fig. 2, but for the North American tracer.
emissions together, due to Europe’s position at higher lat-itudes and prevailing airflow patterns (Stohl et al., 2002). Secondly, more tracer from all three source continents is found in the Arctic for NAO+than for NAO−. Thirdly, the
NAO dependence is strongest for the European tracer and decreases with its e-folding lifetime, as can be seen by the relative differences between NAO+and NAO−being great-est for the European tracer and at the shortgreat-est lifetimes. For an e-folding lifetime of 5 days (30 days), 90% (50%) more European tracer and 70% (30%) more tracer in total resides in the Arctic for NAO+than for NAO−.
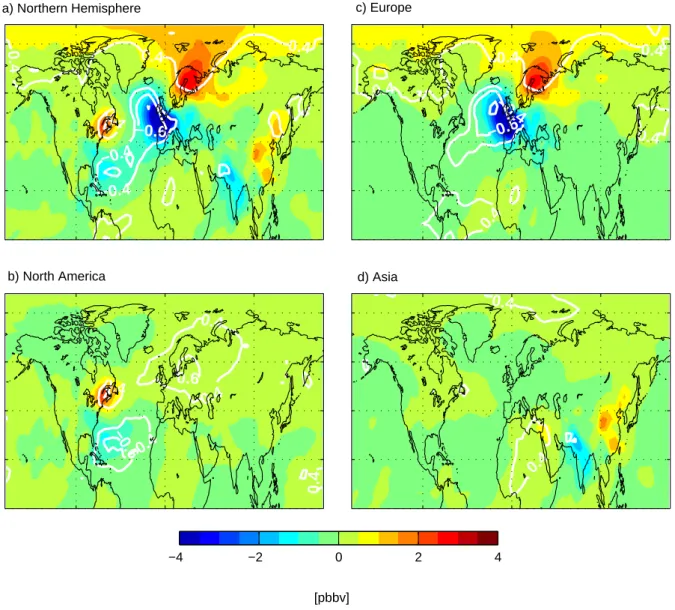
Figure 5 shows maps of the slopes between the surface mixing ratios of the 30-day-lifetime tracers (from all NH continents together, as well as from Europe, America, and Asia alone), and the NAO index, obtained from a linear
re-gression model analysis. Furthermore, correlation coeffi-cients are superimposed as white lines, in order to identify those regions where the slopes have been obtained from sig-nificant correlation results. Both the North American tracer and the European tracer show a bipole pattern, with a re-gion of positive slopes north of the main source rere-gion, and a region with negative slopes south of the source region. These patterns are significant, as can be seen by the correla-tion coefficients, which show values up to −0.83 and +0.67 (for our sample size a correlation coefficent of ±0.37 in-dicates significance on the 99% level). The slopes for the Asian tracer reveal a more complicated distribution, which is largely not significant, according to the correlation coef-ficients. However, in the polar regions, positive slopes are found for the Asian tracer, too. The slopes for tracer mixing
5 10 15 20 25 30 0 2 4 6 8 10 12 14 16
Average concentration at 500m agl [ppbv]
Lifetime [days] North America
Europe Asia
Fig. 4. Dependence of the winter-time mean tracer mixing ratios [ppbv] at the surface, averaged over the region north of 70◦N, on tracer lifetime for NAO+(bold lines) and NAO−(dashed lines) en-sembles, respectively, for European (green lines), North American (blue lines) and Asian tracer (red lines).
ratios originating from all NH continents together closely re-semble the results for Europe alone, confirming the domi-nant European signal. We also performed the same analysis for the Arctic Oscillation (AO) index, which revealed simi-lar patterns. At the lowest level, the main difference for the tracer with 30 days lifetime is that the very high positive cor-relations over northern Scandinavia disappear when using the AO. However, high positive correlations remain over the en-tire Arctic area. Positive slopes with significant correlations are also found in the Asian region for the AO, which are not seen with the NAO. The analysis for the AO can be viewed on our website.
To prove that the NAO affects the pollution outflow from Europe as suggested by the model, we use satellite mea-surements of a short-lived (lifetime of hours in the boundary layer, and up to a few days in the free troposphere) substance, nitrogen dioxide (NO2), from GOME. GOME is a
spectrom-eter operating in nadir-viewing geometry on the ERS-2 satel-lite since 1995 (Burrows et al., 1999). From the spectral data, total column NO2 is retrieved using Differential
Op-tical Absorption Spectroscopy (Leue et al., 2001). Nitrogen oxides have in the troposphere an important role for human health, climate and atmospheric chemistry. They have in-fluence on Ozone production as well as on OH concentra-tion (Atkinson, 2000; Jacob, 2003). Residual NO2columns
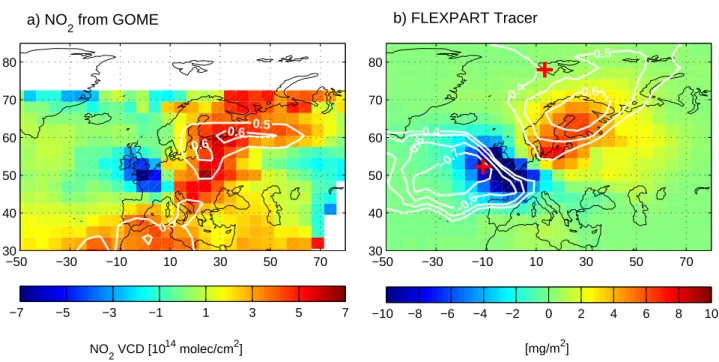
were constructed for NAO+ minus NAO− conditions (see Table 1 for the months selected and their NAO indices) in the same manner as for the model results, but using the seven winters with available GOME data. The residuals show a dipole structure with a NO2 surplus over northern Europe
and a deficit over western Europe (Fig. 6a). NO2 data are
less reliable in regions where clouds are present, and they also reflect patterns in stratospheric NO2. Both cloud
pat-terns and the amount of stratospheric NO2 may vary with
the NAO. Stratospheric NO2may particularly vary because
tropopause heights change with the NAO. To rule out that the dipole pattern seen in Fig. 6a could have been produced by one of these mechanisms, careful analyses of cloud data from GOME itself, the International Satellite Cloud Clima-tology Project (Rossow and Schiffer, 1999), and ECMWF tropopause heights for NAO+and NAO−were done. These analyses showed that neither cloud patterns nor tropopause heights showed residuals that corresponded to the identified spatial structures. Thus, the NO2residuals are no artifact of
the retrieval technique, but really show an enhanced outflow into the Arctic and a decreased outflow into the North At-lantic of European pollution for the NAO+compared to the
NAO−ensemble.
A map of NAO+ minus NAO− residuals of the
Euro-pean 1-day-lifetime tracer columns (Fig. 6b) corroborates this finding. Even though the time periods of the model simulations and the measurements do not overlap and the model does not account for chemical transformations and de-position (other than applying a 1-day lifetime), there is very good general agreement between the two maps. Note that our youngest age class is actually 0–2 days, such that the 1-day-lifetime tracer cannot be accurately computed, but rather reflects the patterns of the 0–2 days age class. This explains why the dipole structure seen in the model results has a larger dimension than the corresponding NO2dipole, as NOxhas a
lifetime on the order of hours to a day.
The spatial patterns identified in both the GOME obser-vations and the model results are statistically significant, as shown by the correlation coefficients between the NAO in-dex and vertical columns. Correlation coefficients were cal-culated for the full period of available data (i.e., not only the NAO+or NAO−composites). For the model results, corre-lation coefficients between the NAO indices and the tracer columns range from −0.79 to 0.68. For the NO2
observa-tions, the enhanced northward flow for high NAO is also highly significant (correlations up to 0.62, for our sample size a correlation coefficent of 0.58 is significant on the 99% level), whereas the reduced outflow to the west is less signif-icant (correlations up to −0.21).
Unfortunately, NO2 has too short a lifetime to trace the
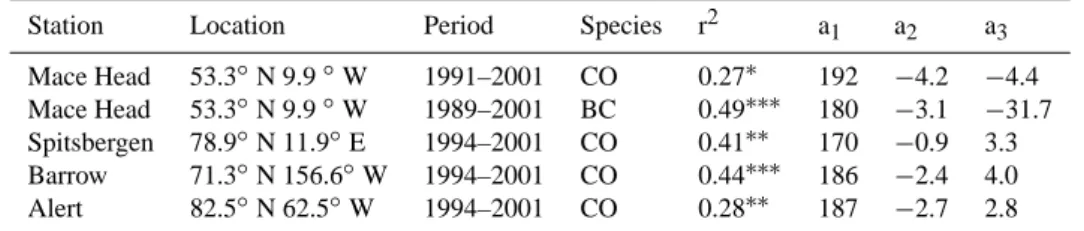
pollution all the way into the Arctic. However, in-situ mea-surements of longer-lived substances at high-latitude sta-tions confirm our model results. Table 3 shows results of a linear correlation analysis of CO data at three Arctic sta-tions (Spitsbergen, Barrow, Alert) and at the Irish west coast (Mace Head), obtained from the NOAA global flask sam-pling network (Novelli et al., 1998), and black carbon (BC) data (Cooke et al., 1997) at Mace Head. CO and BC have lifetimes of several months and about 10 days, respectively, in the Arctic winter. Since all time series show a downward trend, which is not discussed further here, a multiple linear
S. Eckhardt et al.: NAO controls Arctic air pollution 1775
−0.6
−0.4
0.4
0.4
0.4
0.4
0.6
−0.6
−0.4
−0.4
0.4
0.4
0.4
0.4
0.4
0.4
−0.6
−0.4
0.4
0.4
0.4
0.4
0.4
−4 −2 0 2 4a) Northern Hemisphere c) Europe
b) North America d) Asia
[pbbv]
Fig. 5. Maps of the slopes (ppbv per index unit) between the 30-day-lifetime model tracer, and the NAO index in winter, for (a) all three NH source continents together, (b) North America alone, (c) Europe alone, and (d) Asia alone. The slopes were obtained by carrying out a linear regression analysis with the NAO index as the independent variable, and the tracer mixing ratio in the lowest model layer as the dependent variable. The white contour lines show the correlation coefficient between NAO and the model tracer (contours are drawn at ±0.4, ±0.6 and ±0.8).
regression was performed with both time and the NAO index as independent variables, in order to exclude the possibility that correlations are due to joint NAO and emission trends. At all stations the NAO index is the main explanatory vari-able, and thus a regression with the NAO index alone yields very similar correlations and slopes. Depending on the sta-tion, the NAO explains about 30–50% of the variability seen in the data. At the Irish Mace Head research station, close to the negative pole in Fig. 6, there is a modest negative correla-tion between NAO and CO. According to the model simula-tions, this is a superposition of a strong negative correlation with European CO and a weaker positive correlation with
North American CO (Fig. 5). For the shorter-lived BC, for which the North American influence is small, we see a very strong and highly significant negative correlation with the NAO, reflecting reduced outflow from Europe to the North Atlantic during NAO+phases, which is due to the generally stronger westerly winds during high NAO phases.
In contrast, highly significant positive correlations be-tween NAO and CO are found at all Arctic stations, confirm-ing the enhanced poleward transport of air pollution from Europe and North America during NAO+ phases, seen in Figs. 2–5. For NAO indices of −4 (+4), CO is nearly 10% lower (higher) than on average. Fig. 5 demonstrates that most
−0.7 −0.6 −0.4 −0.6 0.6 0.5 0.4 −50 −30 −10 10 30 50 70 30 40 50 60 70 80 −10 −8 −6 −4 −2 0 2 4 6 8 10 −7 −5 −3 −1 1 3 5 7 0.5 0.6 0.6 0.5 −50 −30 −10 10 30 50 70 30 40 50 60 70 80 NO2 VCD [1014 molec/cm2] [mg/m2] a) NO
2 from GOME b) FLEXPART Tracer
+
+
Fig. 6. Comparison of observed and simulated NAO signal in pollution transport from Europe. Map of the residual NO2vertical columns
[1014molecules cm−2] retrieved from GOME satellite observations for NAO+minus NAO−composites during seven (1996–2002) winters (a). Residuals of vertical columns of the European 1-day-lifetime tracer during 15 winters (1979–1993) (b). In both (a) and (b), the colours show the tracer column residuals [mg m−2]. Superimposed as white lines are the correlation coefficients between the NAO indices and the NO2columns (in a) or the tracer columns (in b) for the full periods with available data. Crosses mark the locations of measurement sites at
Mace Head and Spitsbergen.
Table 2. Winter months and their associated monthly NAO index used for constructing the low and high NAO index ensembles for the GOME NO2, respectively (indices downloaded on August, 2003)
low NAO high NAO
month year index month year index
12 2001 −4.1 1 1999 1.3
12 1996 −3.7 12 1998 1.6
1 1997 −2.4 12 1999 1.7
12 2000 −2.2 2 1999 2.2
1 1996 −1.8 2 2000 3.1
of this correlation can be explained by NAO-related modifi-cations of European pollution transport.
Similar, albeit weaker, correlations between the NAO and both measurement data and model results were found for spring, whereas for summer and autumn low correlations were obtained. This is expected, as the NAO is strongest in winter and early spring (Hurrell et al., 2003). Similar corre-lations were found with alternative NAO-related patterns like the Arctic Oscillation (see our supplementary website). The NAO was used here because European emissions are most important for Arctic air pollution and the NAO possesses the greatest explanatory power over the Euro-Atlantic region (Ambaum et al., 2001).
4 Discussion and conclusions
Using a 15-year tracer transport climatology based on model simulation driven by ECMWF wind fields it was found in this study that transport of anthropogenic pollution from all three NH continents correlates with the NAO in winter and spring. Enhanced transport of pollution to the Arctic from all three NH continents was observed during high NAO phases. The strongest dependency of simulated Arctic pollution levels on the NAO occurred for the pollution originating from Eu-rope, and the dependence of transport on the NAO index (see Fig. 4) was strongest for tracers with short lifetimes. Satel-lite observations of NO2show a similar correlation with the
NAO index and, thus, confirm the model results. CO mea-surements at Arctic surface stations, which are all positively correlated with the NAO, further corroborate our model re-sults.
Our observation that the NAO controls pollution outflow from NH continents into the Arctic possibly has important consequences. During the past decades, there has been a positive trend in the NAO (Hurrell, 1995), explaining partly why climate change in the Arctic was probably faster than anywhere else in the world (Moritz et al., 2002). Anthro-pogenic aerosols reduce cloud droplet sizes (Br´eon et al., 2002), which globally leads to negative radiative forcing due to an increase in cloud reflectivity. However, under Arctic
S. Eckhardt et al.: NAO controls Arctic air pollution 1777
Table 3. Table shows coefficients obtained from a multiple linear regression with CO or BC as dependent, and time and NAO index as independent variables: a1intercept (unit ppbv for CO, ng m−3for BC), a2trend (ppbv/year for CO, ng m−3/year for BC), a3slope with
NAO index (ppbv for CO, ng m−3for BC).∗significance of r2on the∗5% level,∗∗1% level,∗∗∗0.1% level.
Station Location Period Species r2 a1 a2 a3
Mace Head 53.3◦N 9.9◦W 1991–2001 CO 0.27∗ 192 −4.2 −4.4 Mace Head 53.3◦N 9.9◦W 1989–2001 BC 0.49∗∗∗ 180 −3.1 −31.7 Spitsbergen 78.9◦N 11.9◦E 1994–2001 CO 0.41∗∗ 170 −0.9 3.3 Barrow 71.3◦N 156.6◦W 1994–2001 CO 0.44∗∗∗ 186 −2.4 4.0 Alert 82.5◦N 62.5◦W 1994–2001 CO 0.28∗∗ 187 −2.7 2.8
conditions (large solar zenith angles, high surface albedo be-cause of snow and ice), increased cloud reflectivity does not lead to surface cooling, because of the absence of short-wave radiation. Instead, aerosols and thin clouds warm the surface by increasing the longwave emissivity (Garrett et al., 2002), which adds to the forcing by greenhouse gases. Thus, part of the observed Arctic warming may have been due to en-hanced transport of anthropogenic pollution into the Arctic during the past decades, both because of increasing emis-sions and the positive NAO trend. Very recently, though, the Arctic has cooled and become less cloudy in winter (Wang and Key, 2003), which could be related to recent emission reductions in Europe and North America, while the NAO has stabilised in the last decade. This hypothesis is speculative at the moment, but it could be tested by doing sensitivity runs with climate models, in which aerosol formation from high-latitude regions are switched on and off, respectively.
Another implication of our results is a possible feedback on the NAO itself, caused by transport of short-lived green-house gases (e.g., ozone) and aerosols to the Arctic varying with the NAO phase. Both the strength and the direction of such a feedback loop are unknown yet, but if it exists it could be highly relevant. This hypothesis could be explored by looking how the NAO develops with and without emissions from high-latitude regions in chemistry-climate models.
According to our results, the NAO may lead to large inter-annual and decadal variability of nitrogen deposition to the Arctic Ocean, with potentially important ecological implica-tions (Pearl et al., 1999) and feedbacks on climate through the uptake of carbon dioxide. Furthermore, a negative cor-relation between the NAO and nitrate concentrations in U.K. freshwaters has been reported, but is not yet explained (Mon-teith et al., 2000). We suggest that variability in atmospheric transport of nitrogen from the European mainland and the U.K. itself is responsible.
Acknowledgements. This study was funded by the German
Fed-eral Ministry for Education and Research within the Atmospheric Research Program 2000 (AFO 2000) as part of the projects CAR-LOTTA and NOXTRAM. ECMWF and the German Weather Ser-vice permitted access to the ECMWF archives. We acknowledge the National Oceanic and Atmospheric Administration (NOAA), Climate Monitoring and Diagnostics Laboratory (CMDL), Carbon
Cycle Group, for providing CO data on the web, and J. Hurrell from the Climate Analysis Section, NCAR, Boulder, USA, for the NAO index data. Support of the BC measurement programme by T. Gerard Spain at Mace Head is gratefully acknowledged. We also wish to acknowledge support from the EU through the 5FP Project: CORE (Climate-Biosphere-Interactions), Contract number: EVRI-CT1999-40009. Finally we would like to thank for the very con-structive help of two anonymous reviewers.
References
Ambaum, M. H. P., Hoskins, B. J., and Stephenson, D. B., Arctic Oscillation or North Atlantic Oscillation?, J. Climate, 14, 3495– 3507, 2001.
Atkinson, R.: Atmospheric chemistry of VOCs and NOx, Atmos.
Environ., 34, 2063–2101, 2000.
Barrie, L. A.: Arctic air-pollution – an overview of current knowl-edge, Atmos. Environ., 20, 643–663, 1986.
Bodhaine, B. A.: Barrow surface aerosol: 1976–1987, Atmos. Env-iron., 23, 2357–2369, 1989.
Br´eon, F.-M., Tanr´e, D., and Generoso, S.: Aerosol effect on cloud droplet size monitored from satellite, Science, 295, 834–838, 2002.
Burrows, J. P., Weber, M., Buchwitz, M., Rozanov, V. V., Ladst¨atter-Weißenmayer, A., Richter, A., DeBeek, R., Hoogen, R., Bramstedt, K., and Eichmann, K. U.: The Global Ozone Monitoring Experiment (GOME): Mission concept and first sci-entific results, J. Atmos. Sci., 56, 151–175, 1999.
Cooke, W. F., Jennings, S. G., and Spain, T. G.: Black carbon mea-surements at Mace Head, 1989–1996, J. Geophys. Res., 102, 25 339–25 346, 1997.
Eckhardt, S., Stohl, A., Wernli, H., James, P., Forster, C., and Spichtiner, N.: A 15-year climatology of warm conveyor belts, J. Climate, in press, 2003.
Forster, C., Wandinger, U., Wotawa, G., James, P., Mattis, I., Al-thausen, D., Simmonds, P., O’Doherty, S., Kleefeld, C., Jen-nings, S. G., Schneider, J., Trickl, T., Kreipl, S., J¨ager, H., and Stohl, A.: Transport of boreal forest fire emissions from Canada to Europe, J. Geophys. Res., 106, 22 887–22 906, 2001. Garrett, T. J., Radke, L. F., and Hobbs, P. V.: Aerosol effects on
cloud emissivity and surface longwave heating in the Arctic, J. Atmos. Sci., 59, 769–778, 2002.
Gibson, J. K., Kallberg, P., Uppala, S., Hernandez, A., Nomura, A., and Serrano, E.: ECMWF Re-Analysis Project Report Series, 1. ERA-15 Description, Version 2, ECMWF, Reading, UK, 1999.
Hall, T. M. and Plumb, R. A.: Age as a diagnostic of stratospheric transport, J. Geophys. Res., 99, 1059–1070, 1994.
Holzer, M., McKendry, I. G., and Jaffe, D. A.: Springtime trans-Pacific atmospheric transport from East Asia: A transit-time-PDF approach, J. Geophys. Res., in press, 2003.
Hurrell, J. W., Kushnir, Y., Ottersen, G., and Visbeck, M. (Eds): The North Atlantic Oscillation: Climate Significance and Envi-ronmental Impact, Geophysical Monograph Series, 134, 279 pp., 2003.
Hurrell, J. W. and v. Loon, H.: Decadal variations in climate as-sociated with the North Atlantic Oscillation, Clim. Change, 36, 301–326, 1997.
Hurrell, J. W.: Decadal trends in the North Atlantic Oscillation: Regional temperatures and precipitation, Science, 269, 676–679, 1995.
Jacob, D. J.: The oxidizing power of the atmosphere, Handbook of Weather, Climate and Water, edited by Potter, T. D. and Colman, B., Wiley, 2003.
Leue, C., Wenig, M., Wagner, T., Klimm, O., Platt, U., and J¨ahne, B.: Quantitative analysis of NOxemissions from Global Ozone
Monitoring Experiment satellite image sequences, J. Geophys. Res., 106, 5493–5505, 2001.
Li, Q., Jacob, D. J., Bey, I., Palmer, P. I., Duncan, B. N., Field, B. D., Martin, R. V., Fiore, A. M., Yantosca, R. M., Parrish, D. D., Simmonds, P. G., and Oltmans, S. J.: Transatlantic transport of pollution and its effects on surface ozone in Europe and North America, J. Geophys. Res. 107, doi: 10.1029/2001JD001422, 2002.
Li, C., Cornett, J., and Ungar, K.: Long-term decrease of cadmium concentrations in the Canadian Arctic air, Geophys. Res. Lett., 30, 1256, doi: 10.1029/2002GL016723, 2003.
Meijer, S. N., Ockenden, W. A., Sweetman, A., Breivik, K., Gri-malt, J. O., and Jones, K. C.: Global distribution and budget of PCBs and HCB in background surface soils: implications for sources and environmental processes, Environ. Sci. Technol., 37, 667–672, 2003.
Mitchell, J. M.: Visual range in the polar regions with particulate reference to the Alaskan Arctic, J. Atmos. Terr. Phys. Special Suppl., 195–211, 1957.
Monteith, D. T., Evans, C. D., and Reynolds, B.: Are temporal vari-ations in the nitrate content of UK upland freshwaters linked to the North Atlantic Oscillation?, Hydrol. Process. 14, 1745–1749, 2000.
Moritz, R. E., Bitz, C. M., and Steig, E. J.: Dynamics of recent climate change in the Arctic, Science, 297, 1497–1502, 2002. Moulin, D., Lambert, C. E., Dulac, F., and Dayan, U.: Control of
atmospheric export of dust from North Africa by the North At-lantic Oscillation, Nature, 387, 691–694, 1997.
Novelli, P. C., Masarie, K. A., and Lang, P. M.: Distributions and recent changes of carbon monoxide in the lower troposphere, J. Geophys. Res., 103, 19 015–19 033, 1998.
Olivier, J. G. J., Bouwman, A. F., Van der Maas, C. W. M., Berdowski, J. J. M., Veldt, C., Bloos, J. P. J., Visschedijk, A. J. H., Zandveld, P. Y. J., and Haverlag, J. L.: Description of EDGAR Version 2.0. A set of global emission inventories of greenhouse gases and ozone depleting substances for all anthro-pogenic and most natural sources per country basis and on 1◦×1◦ grid, RIVM/TNO report, December 1996, RIVM Bilthoven, RIVM report nr. 771060 002 [TNO MEP report nr. R96/119], 1996.
Pearl, H. W. and Whitall, D. R.: Anthropogenically-derived atmo-spheric nitrogen deposition, marine eutrophication and harmful algal bloom expansion: is there a link?, Ambio, 28, 307–311, 1999.
Penkett, S. A. and Brice, K. A.: The spring maximum in pho-tooxidants in the Northern Hemisphere troposphere, Nature, 319, 655–657, 1986.
Polissar, A., Hopke, P. K., and Harris, J. M.: Source regions for atmospheric aerosol measured at Barrow, Alaska. Environ. Sci. Technol., 35, 4214–4226, 2001.
Rossow, W. B. and Schiffer, R. A.: Advances in understanding clouds from ISCCP. Bull. Am. Met. Soc., 80, 2261–2287, 1999. Stohl, A., Forster, C., Eckhardt, S., Spichtinger, N., Huntrieser, H., Heland, J., Schlager, H., Wilhelm, S., Arnold, F., and Cooper, O.: A backward modeling study of intercontinental pollution trans-port using aircraft measurements, J. Geophys. Res., 108, 4370, doi: 10.1029/2002JD002862, 2003.
Stohl, A., Eckhardt, S., Forster, C., James, P., and Spichtinger, N.: On the pathways and timescales of intercontinental air pollution transport, J. Geophys. Res., 107, 4684, doi: 10.1029/2001JD001396, 2002a.
Stohl, A. and Thomson, D. J.: A density correction for Lagrangian particle dispersion models, Boundary-Layer Meteorol., 90, 155– 167, 1999.
Stohl, A., Hittenberger, M., and Wotawa, G.: Validation of the Lagrangian particle dispersion model FLEXPART against large scale tracer experiment data, Atmos. Environ., 32, 4245–4264, 1998.
Wang, X. and Key, J. R.: Recent trends in Arctic surface, cloud, and radiation properties from space, Science, 299, 1725–1728, 2003. Wania, F.: Assessing the potential of persistent organic chemicals for long-range transport and accumulation in polar regions, Env-iron. Sci. Technol., 37, 1344–1351, 2003.
![Fig. 2. European tracer columns [mg m −2 ] 2–4 days (a, b), and 8–10 days (c, d) after tracer emission](https://thumb-eu.123doks.com/thumbv2/123doknet/14544528.536007/5.892.108.786.105.730/fig-european-tracer-columns-days-days-tracer-emission.webp)

![Fig. 4. Dependence of the winter-time mean tracer mixing ratios [ppbv] at the surface, averaged over the region north of 70 ◦ N, on tracer lifetime for NAO + (bold lines) and NAO − (dashed lines) en-sembles, respectively, for European (green lines), North](https://thumb-eu.123doks.com/thumbv2/123doknet/14544528.536007/7.892.77.425.96.373/dependence-winter-surface-averaged-lifetime-sembles-respectively-european.webp)