HAL Id: hal-00295373
https://hal.archives-ouvertes.fr/hal-00295373
Submitted on 5 Dec 2003
HAL is a multi-disciplinary open access
archive for the deposit and dissemination of
sci-entific research documents, whether they are
pub-lished or not. The documents may come from
teaching and research institutions in France or
abroad, or from public or private research centers.
L’archive ouverte pluridisciplinaire HAL, est
destinée au dépôt et à la diffusion de documents
scientifiques de niveau recherche, publiés ou non,
émanant des établissements d’enseignement et de
recherche français ou étrangers, des laboratoires
publics ou privés.
Lidar and in situ observations of continental and
Saharan aerosol: closure analysis of particles optical and
physical properties
G. P. Gobbi, F. Barnaba, R. van Dingenen, J. P. Putaud, M. Mircea, M. C.
Facchini
To cite this version:
G. P. Gobbi, F. Barnaba, R. van Dingenen, J. P. Putaud, M. Mircea, et al.. Lidar and in situ
observations of continental and Saharan aerosol: closure analysis of particles optical and physical
properties. Atmospheric Chemistry and Physics, European Geosciences Union, 2003, 3 (6),
pp.2161-2172. �hal-00295373�
www.atmos-chem-phys.org/acp/3/2161/
Chemistry
and Physics
Lidar and in situ observations of continental and Saharan aerosol:
closure analysis of particles optical and physical properties
G. P. Gobbi1, F. Barnaba1, R. Van Dingenen2, J. P. Putaud2, M. Mircea3, and M. C. Facchini3
1Istituto di Scienze dell’Atmosfera e del Clima-CNR, Roma, Italy
2European Commission Joint Research Centre, Ispra, Italy
3Istituto di Scienze dell’Atmosfera e del Clima-CNR, Bologna, Italy
Received: 29 October 2002 – Published in Atmos. Chem. Phys. Discuss.: 3 February 2003 Revised: 2 September 2003 – Accepted: 1 October 2003 – Published: 5 December 2003
Abstract. Single wavelength polarization lidar observations
collected at Mt. Cimone (44.2◦N, 10.7◦E, 1870 m a.s.l.)
dur-ing the June 2000 MINATROC campaign are analyzed to derive tropospheric profiles of aerosol extinction, depolar-ization, surface area and volume. Lidar retrievals for the 2170–2245 m level are compared to the same variables as computed from in situ measurements of particles size distri-butions, performed at the mountain top Station (2165 m a.s.l.) by a differential mobility analyzer (DMA) and an optical par-ticle counter (OPC). A sensitivity analysis of this closure ex-periment shows that mean relative differences between the backscatter coefficients obtained by the two techniques un-dergo a sharp decrease when hygroscopic growth to ambi-ent humidity is considered for the DMA dataset, otherwise representative of dry aerosols. Minimization of differences between lidar and size distribution-derived backscatter coef-ficients allowed to find values of the “best” refractive index, specific to each measurement. These results show the refrac-tive index to increase for air masses proceeding from Africa and Western Europe. Lidar depolarization was observed to minimize mainly in airmasses proceeding from Western Eu-rope, thus indicating a spherical, i.e. liquid nature for such aerosols. Conversely, African, Mediterranean and East Eu-rope aerosol showed a larger depolarizing fraction, mainly due to coexisting refractory and soluble fractions. The anal-ysis shows average relative differences between lidar and in-situ observations of 5% for backscatter, 36% for extinction 41% for surface area and 37% for volume. These values are well within the expected combined uncertainties of the lidar and in situ retrievals. Average differences further decrease during the Saharan dust transport event, when a lidar sig-nal inversion model considering non-spherical scatterers is employed. The quality of the closure obtained between par-ticle counter and lidar-derived aerosol surface area and vol-ume observations constitutes a validation of the technique
Correspondence to: G. P. Gobbi
(g.gobbi@isac.cnr.it)
adopted to retrieve such aerosol properties on the basis of single-wavelength lidar observations.
1 Introduction
Atmospheric aerosols play a crucial role in determining the Earth radiation balance via two different mechanisms: 1) scattering and absorbing both solar and thermal radiation, 2) acting as cloud condensation nuclei. The radiative forc-ing anthropogenic aerosols enact via these two mechanisms (in particular the second one) is currently evaluated to be opposite in sign but of the same order and in some regions even larger than the forcing due to current greenhouse gases (e.g. Ramanathan et al., 2001). Also through mechanism (2), in particular by increasing the number of suspended cloud droplets, anthropogenic contribution to aerosol con-centrations can inhibit precipitation, therefore modifying the hydrological cycle (Rosenfeld et al., 1999). Furthermore, aerosols provide airborne reactive surfaces for the heteroge-neous chemistry processes leading to changes in atmospheric composition (e.g. Jacob, 2000; Balkanski et al., 2003). Un-derstanding of these processes is still considered to be very low (e.g. Penner et al., 2001, and references therein). An improved global picture of atmospheric aerosols and related processes is therefore needed to better address some of the fundamental mechanisms controlling the Earth’s climate.
In situ observations play a key role in building the picture of airborne particulate matter. This is because the microphys-ical and chemmicrophys-ical properties of aerosol particles necessary to invert remote sensing (satellite, lidar, sunphotometer) obser-vations are mainly determined by means of these techniques (e.g. Raes et al., 2000). While current satellite passive ra-diometry experiments start providing global (land and ocean) column contents (e.g. Kaufman et al., 2002), lidars (laser radars) remain best suited at retrieving vertical profiles of at-mospheric aerosols (e.g. Franke et al., 2001; Sassen, 2002). In fact, in the near future elastic backscatter lidars will be
flown onboard space platforms by both NASA (Calipso) and ESA (Earthcare). A quantitative retrieval of aerosol proper-ties by these lidars will require the use of specific algorithms and assumptions. These might lead to rather large errors if erroneously applied (e.g. Karyampudi et al., 1999; Gobbi et al., 2002). Relevant results need then to be validated against in situ or complementary observations.
In this paper we shall compare and discuss lidar and in situ particle size distribution measurements simultaneously collected during an experimental campaign characterized by both continental and Saharan aerosol conditions. The instru-mental set up and measurement schemes will be described in Sect. 2. In Sect. 3 we shall present and discuss the evolution of the vertical profiles of aerosol extinction, depolarization, surface area and volume retrieved by the single-wavelength, polarization lidar system. Finally, in Sect. 4 we shall com-pare lidar retrievals of aerosol backscatter, extinction, surface area and volume for the 2200 m level to equivalent retrievals computed from in situ particle counters observations carried-out at that altitude. The latter analysis will provide both the best refractive index of the observed aerosols and a closure experiment between lidar and particle counter-derived sur-face area and volume observations.
2 Methods
The European Union (EU) Mineral dust and Tropospheric Chemistry (MINATROC) campaign took place at the Mt.
Cimone Station (44.2◦N, 10.7◦E, 2165 m a.s.l.) between 1
June and 5 July 2000 (Balkanski et al., 2003). In addition to atmospheric chemistry measurements, aerosol observations were carried out by means of particle sizing instrumentation, by impactors, by optical nephelometer and aethalometer and by the Vehicle-mounted Lidar System (VELIS). For the pur-poses of our analysis, we shall combine particle size distribu-tion and composidistribu-tion results, together with the VELIS lidar measurements. We start with providing an outline of the ob-servational methods.
2.1 The VELIS lidar
VELIS is a compact, mobile polarization lidar designed to provide day and night-time profiles of atmospheric aerosols starting 150 m from the system and up to the lower strato-sphere. VELIS has been developed at the Institute for Sci-ences of the Atmosphere and Climate (ISAC) of the Ital-ian Research Council (CNR) in Rome (Gobbi et al., 2000). The lidar emitter is based on a frequency doubled (532 nm) Nd:YAG laser, generating plane-polarized, 100 mJ pulses at 15 Hz. A two-receiver configuration is employed to cope with the high dynamic range of the returning signal: a 10 cm telescope for the near range (150–2000 m from the system) and a 25 cm one for the far range (1.5–20 km). Below 150 m the signal is corrected to account for the incomplete
geo-metrical superposition between the laser beam and the tele-scope field of view characterizing these levels. The atmo-spheric backscatter signal is detected by photomultipliers and digitized by photon counting devices. Relative to the po-larized laser emission, each receiver detects both parallel,
S//, and perpendicular, S⊥, polarization signals. Here S
represents the backscatter signal generated by atmospheric
molecules Sm and aerosols Sa (S=Sm+Sa), after
subtrac-tion of the background noise. Since non-spherical
parti-cles introduce some degree of depolarization in the light they backscatter while spherical particles do not, the linear
depolarization ratio D=S⊥/S//=(Sm⊥+Sa⊥)/(Sm//+Sa//)
allows to discriminate liquid (spherical) from solid
(non-spherical) particles (e.g. Gobbi, 1998). Aerosol-induced
depolarization Da=Sa⊥/Sa// (that is the ratio between the
aerosol-generated orthogonal signals) represents a useful tool in studying the solid versus liquid aerosol phases (e.g.
Gobbi et al., 2000). However, Da can diverge for small
aerosol contents and the more straightforward parameter D is often used to give a general picture of atmospheric de-polarization. From the just given definitions it is evident
that D and Da tend to the same value for Sa Sm. The
lidar signal of a specific altitude z, is generated by the backscatter of atmospheric molecules and aerosols present at that level and extinguished (by the same constituents)
on its way back to the receiver. Assuming that
molec-ular density profiles are known (via either radio-sounding or model data), the lidar equation, relating the signal to
its atmospheric causes, then contains the two unknowns βa
and σa, i.e. the aerosol backscatter and extinction
coeffi-cients, respectively (e.g. Measures, 1984). A relationship be-tween aerosol extinction and backscatter is then needed to solve this equation (e.g. Klett, 1985). Our analysis of the VELIS observations at Mt. Cimone is performed by
employ-ing model-derived functional relationships σa=f (βa)
spe-cific to the aerosol types being observed (e.g. Barnaba and
Gobbi, 2001). The lidar equation is therefore solved by
means of an iteration-convergence procedure: 1) The lidar trace is calibrated against a model atmosphere (obtained from a ten-year climatology of radio-soundings launched 150 km N–W of the site) at an aerosol-free level individuated by vi-sual analysis of the signal. From the model atmosphere the
molecular backscatter profile βm (z) is obtained. The
cali-brated lidar signal therefore represents the unattenuated
to-tal backscatter profile βtot(z)=βm(z)+βa(z); 2) the aerosol
backscatter βa(zi) at each measurement point is determined
as βa(zi)=βtot(zi)−βm(zi); 3) the aerosol extinction σa at
each measurement point is obtained from the σa=f (βa)
model relationship (either continental or Saharan dust mod-els will be employed here, see discussion below) on the basis
of the aerosol backscatter βacomputed at step 2; 4) at each
measurement point the calibrated signal βtot(zi) is corrected
for both the aerosol and molecular extinction encountered below that point, then providing a new extinction corrected
on integrated aerosol backscatter is reached, according to
the condition: 6i|βa0(zi)−βa(zi)|/6iβa0(zi)≤10−3. Errors
in the retrieval of βa(zi)depend on measurement conditions
and range. In the case of the VELIS observations at Mt. Ci-mone, typical errors dβ/β≈20% have been computed em-ploying the error analysis method of Russell et al. (1979).
To analyze VELIS data collected during the campaign,
σa=f (βa) relationships for continental aerosols (Barnaba
and Gobbi, 2003) and for Saharan dust (Barnaba and Gobbi, 2001) have been employed. This is justified by the domi-nating aerosol types being identified on the basis of backtra-jectories as mainly continental in the period 1 June–2 July and as Saharan dust in the period 3–5 July (e.g. Sect. 4.3). Once backscatter profiles are retrieved, the backscatter ratio
R=(βa+βm)/βm can be computed. This parameter is very
useful at determining the relative contributions of molecules and aerosols to the total atmospheric backscatter.
Aerosol surface area, Sa, and volume, Va, profiles are
es-timated by relationships (Sa=f (βa)and Va=f (βa))
relat-ing these parameters to backscatter coefficients and obtained by the same aerosol models. In the case of Saharan dust,
the functional relationships σa=f (βa)and Sa=f (βa)
com-puted for non-spherical particles representative of mineral dust will be employed. Benefits of the spherical versus non-spherical model are discussed in Gobbi et al. (2002). Since
the volume-backscatter relationship Va=f (βa)is not
avail-able for non-spherical dust particles (Barnaba and Gobbi, 2001), volume estimates will be performed on the basis of the spherical (Mie) model for both continental and Saharan aerosols. In Sect. 4 we shall discuss in depth the relevant results and the effects of non-sphericity on retrieved aerosol optical and physical properties. In the case of continental aerosols, typical (average) uncertainty of the model-based es-timates are 25% for extinction, 30% for Surface area, and 40% for Volume (Barnaba and Gobbi 2003). In the case
of Saharan dust, expected uncertainties are of 40% for σa,
45% for Sa, and 80% for Va, (Barnaba and Gobbi, 2001).
It is worth mentioning that the “direct”, statistical approach (Barnaba and Gobbi 2001 and Barnaba and Gobbi, 2003)
employed in this analysis to retrieve aerosol properties as σa,
Sa, and Vafrom single-wavelength lidar data is substantially
different from the “inverse” ones exploiting more complex, multi-wavelength lidar observations to retrieve a wider range of aerosol properties (e.g. Qing et al., 1989; Muller et al., 1999; Veselovskii et al., 2002). Advantages and limits of the two methods can be found in more detail in the relevant references.
During the campaign, VELIS was located at Pian Caval-laro (1870 m a.s.l.), about 300 m below and 300 m apart from the Mt. Cimone Station (2165 m a.s.l.) where the aerosol in situ observations were performed. VELIS collected aerosol profiles in the period 2 June–4 July 2000. Both day and night-time observations employed in this paper are the result of five-minute averages, at 75 m vertical resolution.
2.2 The particle sizing instrumentation
Instrumentation for the in-situ particle size distribution mea-surements was deployed by the European Commission Joint Research Center (JRC) of Ispra. Aerosol number size distri-butions in the 6–600 nm dry diameter range were measured by a custom-built Vienna type DMA (length 28 cm), using a TSI CPC model 3010 as particle counter. It is important to note that these size distributions were obtained in dry sheath air conditions, hence particles are reduced to their dry size when measured. Number size distributions in the size range 0.3–10 µm were measured with an optical particle counter (OPC, GRIMM model 1.108). The optical arrangement in-side the instrument is such that the scattered light is detected
at an angle of 90±30◦.
Unlike the DMA sampling, the aerosol entering the OPC was not dried. The OPC sizing is based on a calibration with latex spheres, performed by the manufacturer. Sizing of non-spherical dust particles implies uncertainties which are diffi-cult to quantify. Mishchenko et al. (1997) calculated ratios for non-spherical (prolate and oblate spheroids, representa-tive of dust properties) to spherical phase functions for
scat-tering angles from 60◦to 120◦to be in the range 0.8 to 1.8,
at 90◦ the ratio being near 1.2. Therefore, some
overesti-mation might affect the size retrieval in the presence of non-spherical particles. Overall, the expected uncertainties in the particle counters-derived aerosol concentrations, surface area and volume are of 16%, 22% and 29%, respectively (Putaud et al., 2000).
3 Lidar profiles during MINATROC
An overview of the lidar retrievals collected during the Mt.
Cimone campaign is given in Fig. 1. Here are reported
the contour plots of the 532 nm extinction coefficient σa
(Fig. 1a), depolarization ratio D (Fig. 1b), surface area (Fig. 1c) and volume (Fig. 1d), respectively. Uncertainty of these retrievals has been given in Sect. 2.1. These plots al-low to see both the maximum height reached by aerosols and the presence of a daily cycle. In general, both features were determined by the daily inflation of the planetary boundary layer (PBL) and aerosols are observed to reach maximum heights of approximately 3 km in the second half of the day. Several different conditions are noticed to superimpose to this general behavior, markedly in the periods 4–11 June, 28 June and 2–5 July (days 32–35), when aerosols were de-tected up to 5–8 km altitudes. In these cases backtrajecto-ries (e.g. Sect. 4.3) together with high depolarization values reveal that these airmasses proceeded from Africa and con-tained dust. Most of the PBL aerosol presented some de-polarization, i.e. it contained some non-spherical particles. However, a marked decrease in depolarization is observed in the period 24–31 June, mainly characterized by transport
(a)
(b)
Figure 1 Minart1f1.ppt
3 4 5 6 7 8 910 11 12 13 14 15 16 17 18 19 20 21 22 23 24 25 26 27 28 29 30 31 32 33 34 DAY OF JUNE- JULY 2000 (UT)
2 3 4 5 6 7 8 Z (km) 0.020 0.040 0.070 0.100 0.200 Aer o sol Exti ncti on (km -1 ) 3 4 5 6 7 8 9 10 11 12 13 14 15 16 17 18 19 20 21 22 23 24 25 26 27 28 29 30 31 32 33 34 DAY OF JUNE- JULY 2000 (UT)
2 3 4 5 6 7 8 Z (km) 5% 8% 10% 15% 20% 40% D epolarization (c) (d) Figure 1 3 4 5 6 7 8 9 10 11 12 13 14 15 16 17 18 19 20 21 22 23 24 25 26 27 28 29 30 31 32 33 34 DAY OF JUNE- JULY 2000 (UT)
2 3 4 5 6 7 8 Z (km ) 5E-007 1E-006 2E-006 3E-006 4E-006 5E-006 Aero sol S u rfac e Ar ea (c m 2 /cm 3 ) 3 4 5 6 7 8 9 10 11 12 13 14 15 16 17 18 19 20 21 22 23 24 25 26 27 28 29 30 31 32 33 34 DAY OF JUNE- JULY 2000 (UT)
2 3 4 5 6 7 8 Z (km) 3.0E-012 5.0E-012 1.0E-011 1.5E-011 2.0E-011 3.0E-011 A e ros o l Volu me (c m 3 /cm 3)
Fig. 1. Contour plots of lidar-derived aerosol properties observed during the Mt. Cimone MINATROC campaign: (a) 532 nm extinc-tion coefficient σa; (b) depolarization ratio D; (c) surface area Sa;
and (d) volume Va.
from Western Europe. We shall further discuss these issues in Sect. 4.
Amongst the episodes of Saharan dust transport detected by VELIS, the only one reaching down to the station level was observed at the beginning of July 2000. In fact, in the
period 6–9 June, when high dust was observed, aerosol ex-tinction was comparable and depolarization was even higher than during the period 3–4 July. However, the depolariza-tion plot of the June events (Fig. 1b) clearly shows the fea-tures of PBL and Saharan aerosols to remain separated, with most of the dust confined to levels above 3 km, i.e. higher than the Mt. Cimone Station. This is consistent with in-situ OPC measurements, which did not indicate any significant increase in coarse particles at that time. Conversely, a pro-gressive lowering of the dust layer clearly starts on 2 July (day 32). In fact, the arrival of mineral particles at the Sta-tion was detected in the afternoon of 3 July, well in agree-ment with the descent of the 8% depolarization contour at that level. This dust event reached up to about 8 km altitude with maximum backscatter ratio of the order of R=5. How-ever, maximum values of depolarization were of the order of D=15%, i.e. much lower than the typical dry dust depo-larization of D≈45% (e.g. Gobbi et al., 2000), as observed between 3 and 5 km on 6 June. This behavior is possibly ex-plained by the combined presence of a rather large soluble fraction (of the order of 50%, Putaud et al., 2003) and RH levels larger than 50% which could sustain the condensation of a liquid aerosol phase. As a matter of fact, cloud conden-sation occurred between 3 and 5 km altitude during the whole night between 3 and 4 July.
Plots of aerosol surface area and volume (Figs. 1c and 1d) depict a behavior similar to the one of extinction (Fig. 1a). These results show maximum values in both aerosol surface area and volume to be associated with dust events, with
con-centrations of the order of 500 µm2cm−3and 30 µm3cm−3,
respectively. Considering that volume is underestimated in the presence of non-spherical particles, these results indicate the dust events crossing over Mt. Cimone (that is at about 2500 km from the source) to be characterized by contents
of at least 10–30 µm3cm−3(that converts to approximately
25–75 µg m−3) extending all the way up to 6 km altitude. In
the following section, we shall address the quality of these retrieved aerosol properties by comparing lidar observations and in situ aerosol samplings of air masses located at the Mt. Cimone Station level.
4 Lidar-particle counters comparisons at the Mt. Ci-mone station level
In this comparison we employ lidar retrievals for the 75 m height bin spanning the region 2170–2245 m a.s.l. together with size distributions observed by the DMA and OPC in-struments at the Station level (2165 m a.s.l.) within 30 min from the lidar measurement. Size distributions are employed to compute aerosol surface area and volume, plus backscatter and extinction coefficients at the lidar wavelength of 532 nm. These optical properties have been computed by means of a Mie scattering code at eighteen different values of the re-fractive index m (in parentheses the imaginary parts): 1.30
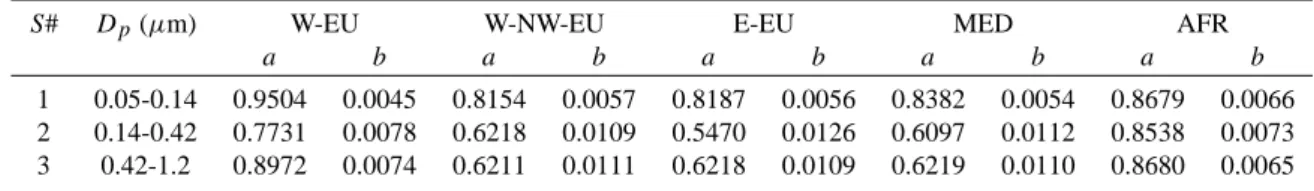
Table 1. Coefficients a and b employed to correct for hygroscopic growth the DMA-derived aerosol size at Mt. Cimone Station. Coefficients are provided as a function of air mass origin (e.g. Sect. 4.3) and particle diameter range (Dp), corresponding to the impactor stage number
(S#).
S# Dp(µm) W-EU W-NW-EU E-EU MED AFR
a b a b a b a b a b
1 0.05-0.14 0.9504 0.0045 0.8154 0.0057 0.8187 0.0056 0.8382 0.0054 0.8679 0.0066 2 0.14-0.42 0.7731 0.0078 0.6218 0.0109 0.5470 0.0126 0.6097 0.0112 0.8538 0.0073 3 0.42-1.2 0.8972 0.0074 0.6211 0.0111 0.6218 0.0109 0.6219 0.0110 0.8680 0.0065
(−0.0i), 1.33 (−0.0i), 1.35 (−0.0i), 1.4 (−0.0i, −5×10⁻³i,
−0.01i), 1.45 (−0.0i, −5×10⁻³i, −0.01i), 1.50 (−0.0i,
−5×10⁻³i, −0.01i), 1.55 (−0.0i, −5×10⁻³i, −0.01i) and
1.60 (−0.0i, −5×10⁻³i, −0.01i). These values have been
selected to represent the full variability range of aerosol composition from pure water droplets (m=1.33–0.0i) to min-eral dust grains m=1.55–0.01i (e.g. d’Almeida et al., 1991). The boundary values m=1.30–0.0i and m=1.60 have been in-cluded to check for results outside the expected range. Use of the Mie theory implies considering particles as spherical. While such an assumption is rather good in the case of liquid and of hygroscopic aerosols, it might lead to a strong over-estimation of backscatter and to a slight underover-estimation of extinction in the case of non-spherical particles as soot or mineral dust (Mishchenko et al., 1997; Gobbi et al., 2002). As mentioned, we shall use a non-spherical scattering model to invert lidar traces of Saharan dust and a spherical scatter-ing model for continental aerosols. Nevertheless, we shall use lidar depolarization information to flag possible sources of inconsistencies by indicating when non-spherical particles are affecting the signal.
4.1 RH-correction of observed particle size
Size distributions employed in this analysis are obtained from DMA data up to 500 nm diameters and OPC data above that size. Since DMA size distributions are provided for dry particles, physical and optical properties computed using these size distributions should be converted to ambient condi-tions to allow for comparison with lidar data. To account for such an effect, we have used a semi-empirical hygroscopic growth model parameterized by using the K¨ohler theory and size-resolved measurements (from impactor filters) of chem-ical composition of the aerosol (Putaud et al., 2003). Im-pactor filters were collected at the same location as the other in situ measurements. The hygroscopic growth model con-sidered in the present study relates the wet aerosol diameter
Dwetat a given ambient relative humidity RH (measured at
the station) to the dry aerosol diameter Ddry by means of
an expression of the form: Dwet=Ddryaexp(b∗RH ), where
RH is expressed in % and a, b are constants depending on
the particle size and chemical composition. Analysis of the chemical composition of aerosols, in particular for water
sol-uble inorganic and organic species, shows important changes in both the percentage and the ionic composition from one air mass to the other, as well as from one size range to an-other within the same air mass. Therefore, for each air mass type (e.g. Sect. 4.3) we have determined different constants
aand b (reported in Table 1) for each Berner impactor stage
by fitting the mean wet aerosol diameter computed by the K¨ohler theory as a function of relative humidity. At a given relative humidity, the mean wet aerosol diameter of a given impactor stage then represents the mean of the wet diameters computed by means of the K¨ohler theory from the DMA dry diameter measurements enclosed in that stage. In the present calculations, the aerosol in the DMA size range was assumed to be internally mixed, with mean chemical composition cor-responding to the one observed in the relevant impactor stage and for the specific air mass. The variation of the surface ten-sion with concentration of moles of carbon (Facchini et al., 1999) was also considered.
All size distribution-derived physical quantities (i.e. sur-face area, volume, backscatter and extinction coefficients) have been computed for both RH -corrected and non cor-rected size distributions. Results of these computations and their comparisons with lidar retrievals obtained at the most 30 min apart from the size distribution measurement are dis-cussed hereafter.
4.2 Backscatter and extinction: sensitivity to RH and
re-fractive index
Minimum and maximum backscatter coefficients obtained from Mie calculations are reported in Fig. 2a for non cor-rected data and in Fig. 2b for RH -corcor-rected data, respec-tively. Both figures show backscatter coefficients to sharply increase when switching from lower (m=1.33–0.0i) to higher value (m=1.55–0.0i) of the refractive index. Lidar-measured backscatter coefficients are also plotted in these figures as black dots. Comparison of Figs. 2a and 2b clearly shows that an agreement between lidar and size distribution-derived aerosol backscatter is only achieved when the RH -correction is applied. In this case most of the lidar observations fall within the backscatter range determined by refractive in-dex variability. This result is quantified by the analysis of
FIGURE 2
5 10 15 20 25 30 35
DAY OF JUNE- JULY 2000 (UT)
0 1E-008 2E-008 3E-008 4E-008 5E-008 6E-008 7E-008 8E-008 βa (c m -1 sr -1) Non-Corrected JRC data m=1.33-0.0i m=1.55-0.0i VELIS z=2207m (a) 5 10 15 20 25 30 35
DAY OF JUNE- JULY 2000 (UT)
0 1E-008 2E-008 3E-008 4E-008 5E-008 6E-008 7E-008 8E-008 βa (c m -1 sr -1) RH-Corrected JRC data m=1.33-0.0i m=1.55-0.0i VELIS z=2207m (b)
Fig. 2. Lidar observed (black dots) and size distribution-derived backscatter coefficients for two values of the refractive index:1)
m=1.33–0.0i (diamonds), 2) m=1.55–0.0i (open squares). Results employing original DMA “dry” size distributions are presented in(a), while (b) considers particles RH -dependent growth.
average, module relative differences:
dβa/βa=N−1
X
i=1,N
(|βVELISi−βJRCi|/βJRCi) (1)
computed for the eighteen values of the refractive index (N =148 being the number of considered measurements).
The behavior of dβa/βa versus m is reported in Fig. 3.
This plot shows that minimization of dβa/βa for non RH
-corrected data is only achieved by forcing m to large, unreal-istic values. Conversely, the RH -corrected dataset reaches a
minimum of dβa/βa=0.38 for m=1.45–0.0i, while smoothly
increasing for both smaller and larger values of m. As ex-pected, Fig. 3 shows that the effect of a non-zero imaginary part of the refractive index is to reduce backscatter, an effect that could be also obtained by a smaller real refractive in-dex with zero absorption. Refractive indices retrieved in the following analysis should then be interpreted accordingly.
Values of dβa/βaare representative of the combined
aver-age relative indetermination of the two measurements. In this
FIGURE 3
0.0 0.2 0.4 0.6 0.8 1.0 1.2 1.4 1.6 1.8 2.0 2.2 2.4 2.6 2.8 3.0 3.2 3.4 3.6 3.8 1.25 1.3 1.35 1.4 1.45 1.5 1.55 1.6 1.65 REFRACTIVE INDEX dX/XdBeta/Beta Non RH-corrected dBeta/Beta RH-corrected dExt/Ext Non RH-corrected dExt/Ext RH-corrected
Fig. 3. Dependence on choice of the refractive index m (non-zero imaginary components are represented by a corresponding decrease in the real part) of the relative differences dβa/βa(blue circles for
non-RH -corrected data, pale blue circles for RH -corrected data) and dσa/σa (red triangles for non-RH -corrected data, orange
tri-angles for RH -corrected data), averaged over the whole data set.
respect, even though levels of dβa/βa=38% can appear quite
large, we should consider that this is the agreement to expect when employing a single, average refractive index (m=1.45–
0.0i) for the whole campaign. In Sect. 4.3, for each ith
mea-surement we shall minimize with respect to m the differences
dβi(m)to provide an estimate of the refractive index specific
to the relevant aerosol type. The statistical significance of this retrieval will be addressed in that section.
The behavior of extinction coefficients average differences
dσa/σa as a function of m is also reported in Fig. 3.
Simi-larly to backscatter, minimization of dσa/σa for non RH
-corrected data is only reached by increasing the refractive index to unrealistic values. Conversely, when applying RH-correction a broad region of minimum average differences
dσa/σa≈0.55 is found for refractive indices ranging between
1.45 and 1.55. These results show extinction retrievals to be consistent with backscatter ones, but less sensitive to a precise choice of the refractive index. In Sect. 4.3 we shall
see how the dβa/βa minimization procedure carried-out to
retrieve a time-dependent value of m will also improve the agreement of the extinction retrievals and provide an esti-mate of the related errors.
As a campaign average, approximately 20% of all aerosol backscatter and extinction coefficients computed from the
RH-corrected size distributions were generated by particles
smaller than 0.15 µm in radius. Only a few percent of βa
and σa was due to particles larger than 1 µm in the case of
continental aerosols. Conversely, in the presence of Saha-ran dust (whose grains were mainly larger than 1 µm) this latter fraction increased to approximately 20% for extinc-tion and 40% for backscatter. These results reveal two note-worthy points: 1) the importance of resolving aerosol size
FIGURE 4
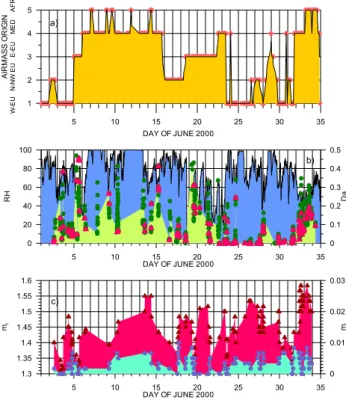
5 10 15 20 25 30 35 DAY OF JUNE 2000 0 20 40 60 80 100 RH 0 0.1 0.2 0.3 0.4 0.5 Da 5 10 15 20 25 30 35 DAY OF JUNE 2000 1 2 3 4 5 AI R M ASS O R IG IN W -EU N -N W EU E-EU M E D A F R a) b) c) 5 10 15 20 25 30 35 DAY OF JUNE 2000 1.3 1.35 1.4 1.45 1.5 1.55 1.6 mr 0 0.01 0.02 0.03 miFig. 4. Time evolution of: (a) origin of air masses arriving at Mt. Cimone Station level during the MINATROC campaign; (b) relative humidity RH (black line, blue filling) and aerosol depolarization
Da(green dots represent all lidar data, while red triangles show data
retrieved within 30 min from is situ observations, at RH <90%), and (c) three-point running averages of real mr (red triangles) and
imaginary part mi(blue bullets) part of the aerosol refractive index, as inferred from minimization of lidar and size distribution-derived backscatter coefficients.
distributions below 0.15 µm (a typical lower threshold of op-tical particle counters) when evaluating aerosol opop-tical prop-erties, and 2) the error (overestimate) intrinsic to the Mie-computed backscatter in the case of non-spherical particles can be rather large and tending to compensate the possible lack of information about smaller sizes mentioned at point (1).
4.3 Airmass origin in relation to depolarization and
refrac-tive index
To improve the interpretation of results we plotted in Fig. 4a the origin of the airmasses arriving at Mt. Cimone Sta-tion (2165 m a.s.l.), as obtained by 10-day, three-dimensional backtrajectories computed by the FLEXTRA model (Stohl and Wakowa, 1995). These were classified into five cate-gories according to the geographical area of longer perma-nence while approaching Mt. Cimone. This backtrajectory information has been parameterized by indicating with 1 air from West Europe, with 2 air from N-NW Europe, with 3 air from Eastern Europe, with 4 air from the Mediterranean
FIGURE 5
40 60 80 100 RH% 0 0.1 0.2 0.3 0.4 0.5 Da W-EU (JUN 25-27) N-NW-EU (JUN 16-17) E-EU (JUN 19) MED (JUN 6-10) AFR (JUL 3-4)Fig. 5. Relationship between Da, and RH at Mt. Cimone Station
level, for selected periods corresponding to airmasses proceeding from the five regions considered: 1) W-Europe (green crosses); 2) N-NW Europe (open orange squares); 3) E-Europe (purple amonds); 4) Mediterranean (blue bullets) and 5) Africa (orange di-amonds).
basin and with 5 air from Africa. This plot shows that air-masses originated from the Mediterranean-African regions in the periods 6–15 June and 2–5 July 2000. The remaining periods were characterized by air mainly proceeding from Eastern Europe (5 June and 19–22 June) and Western Eu-rope (3–4, 24–27 and 30 June). In Fig. 4b we plot the rela-tive humidity (RH ) record as measured at the Station level (P. Bonasoni, personal communication, 2001), together with
the aerosol depolarization ratio Da, observed by VELIS at
that level.
4.3.1 Depolarization
A first analysis of Figs. 4a and 4b shows lower values of de-polarization to be mainly linked to airmassess arriving from Western and N-NW Europe, an effect particularly evident in the period 2–5 and 25–31 June. Conversely, air from E-Europe was characterized by relatively high values of depo-larization, as well as air proceeding from the Mediterranean
and African regions. The relationship between Da and RH
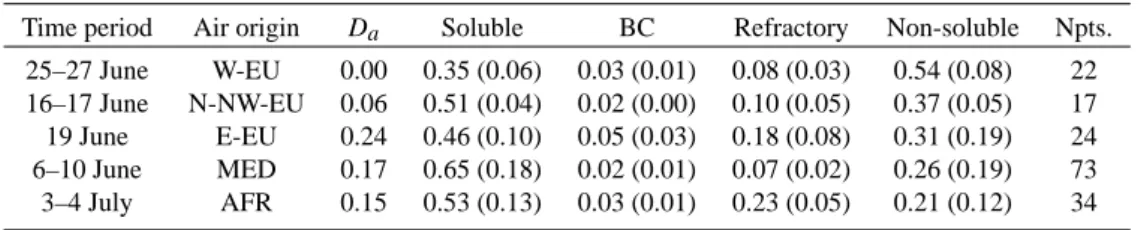
for selected periods, corresponding to airmasses proceeding from these five regions is presented in Fig. 5. For these five airmasses, average values of aerosol composition as ob-served at Mt. Cimone Station by chemical analysis of the sub and super-micron aerosol modes (Putaud et al., 2003) are reported in Table 2, together with average aerosol depo-larization. In Fig. 5, the low-depolarization airmasses of 25– 27 June (from W Europe) and of 16–17 June (from N-NW
Table 2. Aerosol properties averaged over time periods when airmasses had homogeneous origin: 1) Aerosol depolarization Daplus average
volume fraction (standard deviation in parentheses) of aerosol components: 1) Soluble; 2) Black Carbon, (BC); 3) Refractory (dust+non-volatile organic carbon); 4) Non-soluble (semi-(dust+non-volatile). Npts. indicates number of employed measurements.
Time period Air origin Da Soluble BC Refractory Non-soluble Npts.
25–27 June W-EU 0.00 0.35 (0.06) 0.03 (0.01) 0.08 (0.03) 0.54 (0.08) 22 16–17 June N-NW-EU 0.06 0.51 (0.04) 0.02 (0.00) 0.10 (0.05) 0.37 (0.05) 17 19 June E-EU 0.24 0.46 (0.10) 0.05 (0.03) 0.18 (0.08) 0.31 (0.19) 24 6–10 June MED 0.17 0.65 (0.18) 0.02 (0.01) 0.07 (0.02) 0.26 (0.19) 73 3–4 July AFR 0.15 0.53 (0.13) 0.03 (0.01) 0.23 (0.05) 0.21 (0.12) 34
Europe) do not show any significant correlation with RH , i.e. a liquid phase characterizes these aerosols already at 50%
RH. Much higher depolarization levels and solubility effects
(decrease of Da with increasing RH ) are instead observed
for East Europe (19 June), Mediterranean (6–11 June) and African aerosols (3–4 July).
Saharan dust is commonly considered to be hydropho-bic. This property is well portrayed by the airborne obser-vations of aerosol extinction coefficients carried-out in dry (RH =10–30%) and wet (RH =80–90%) conditions by Gasso et al. (2000). Those measurements showed the marine PBL aerosol extinction to grow by a factor of 2–3, when switch-ing from the dry to the wet conditions. Conversely, the ex-tinction coefficient of Saharan dust showed no meaningful increase when subject to the same change in RH . Neverthe-less, at the Mt. Cimone Station level we observed low aerosol
depolarization (average Da<20%) and an anticorrelation
be-tween Daand RH (RH ranging between 40 and 70%) even
in the Saharan aerosol conditions of 3–4 July (Fig. 5). In fact, in situ observations at 2165 m reveal the soluble fraction of these airmasses (e.g. Table 2) to be larger than the campaign average and to peak at noon of 3 July, when PBL convec-tion reaches its maximum. As opposed to this behavior, af-ter 12:00 UT of 3 July aerosol depolarization was observed
to reach the typical dry dust value Da≈45% at levels above
2.8 km, i.e. in the region less affected by intrusions of PBL aerosols. All this evidence points out to the presence of a soluble aerosol fraction, externally mixing with the Saharan dust particles at the Mt. Cimone Station level. It is worth noticing that the same conclusion is independently reached by Putaud et al. (2003) on the basis of chemical analysis of the sub and super-micron aerosol modes.
4.3.2 Refractive index
To estimate the time-dependent aerosol refractive index, we determined the m value (amongst the eighteen ones
previ-ously reported) minimizing the dβai/βai ratio for each i
th
lidar-in situ comparison. Three-point running averages of the real and imaginary parts of the refractive index as re-trieved by this procedure are reported in Fig. 4c. This plot shows that until 17 June (with the exception of the
possi-bly African air of 13–14 June), the retrieved m values are rather low, mainly m<1.45–0.005i. The aerosol refractive index then grows during the second part of the campaign, peaking in both its real and imaginary parts (m≈1.5–0.005i) for the liquid (non-depolarizing) particles from Western and NW Europe (25–27 June) and during the Saharan dust event of 2–4 July, when it varies about the typical values for dust (m≈1.55).
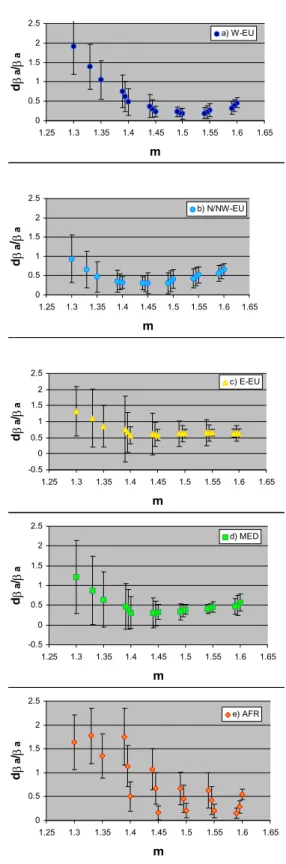
To evaluate the statistical significance of the refractive
in-dex retrievals, we computed the dβa/βa parameter (Eq. 1)
for the five homogeneous airmasses defined in Table 2. For each airmass, computations were carried-out employing all the eighteen m values of this study. The resulting average
dβa/βa(and relevant standard deviation, STD) are plotted as
a function of m in Fig. 6. For the Western European aerosols
of 25–27 June (Fig. 6a), dβa/βareaches a sharp minimum in
the m=1.50–0.0i – 1.55–0.0i region. Associated small stan-dard deviations both indicate this aerosol to be homogeneous over the three days and support the statistical significance of the refractive index retrieval. In fact, all points below
m=1.45–0.0i and above m=1.55–0.0i fall outside the STD of
dβa/βaat m=1.5–0.0i. The large non-soluble, semi-volatile
fraction of this aerosol (e.g. Table 2), together with its liquid
phase (D≈0%) induce to believe this is an organic aerosol,
possibly containing toluene or benzene compounds, whose typical refractive indices span the range 1.47–1.59.
N-NW Europe aerosols of 16–17 June (Fig. 6b) show a
minimum in both dβa/βa and its standard deviation in the
m=1.40–0.0i – 1.45–0.01i region. However, standard
devia-tions indicate that a broader region, encompassing refractive indices up to m=1.55–0.005i could characterize this airmass. In fact, this aerosol shows a pretty large non-soluble, semi-volatile fraction (e.g. Table 2). Eastern Europe aerosols of
19 June (Fig. 6c) present a minimum in both dβa/βa and
its standard deviation at m=1.45–0.0i. The broad region of
dβa/βavalues falling within the STD of that minimum
indi-cate that all refractive indices larger than m=1.40–0.01i could characterize this aerosol. It is interesting to note that this
airmass shows the largest values of Daand of −dDa/dRH
(e.g. Fig. 5). Such behavior is likely due to the big refrac-tory and soluble fractions coexisting in these aerosols (e.g.
Table 2). In fact, the effect of a soluble fraction is of de-creasing both its depolarization and refractive index while diluting. Both the large refractive index variability of Fig. 4c
and the broad region of minimum dβa/βa of Fig. 6d can
then be explained by these properties. The dβa/βaminimum
for Mediterranean aerosols (6–11 June, Fig. 6d) is reached at m=1.45–0.005i. Conversely, smallest standard deviations are found at m=1.55–0.01i. Therefore, the m=1.40–0.0i – 1.60–0.01i region provides possible values of this airmass refractive index. As for the E-Europe aerosol, this airmass
shows pretty large Da, −dDa/dRH and soluble component
values (e.g. Fig. 6d and Table 2). Again, this would explain the broad range of possible m values for this 5-day period as mainly due to solubility effects.
In spite of the large refractory fraction of its aerosols, the Saharan airmass of 3–4 July also contains a large soluble fraction (e.g. Table 2). This explains both the refractive index variability observed in this period (Fig. 5) and the somewhat
broad region of minimum dβa/βaobserved in Fig. 6e.
Nev-ertheless, this region is centered about m=1.53, the typical refractive index of dust, and mainly zero-absorption m val-ues (1.45–0.0i, 1.50–0.0i and 1.55–0.0i) fall within the STD
bar of the minimum dβa/βafound at m=1.6–0.01i.
In the previous analysis, best results (an uncertainty
dm=0.05 over a three-day average) were achieved for air
containing liquid aerosol with low RH dependence (i.e. with small soluble fraction). Conversely, aerosols with larger sol-uble fraction (East Europe, Mediterranean and African) led to proportionally more spread retrievals, mostly linked to short-term RH changes. Overall, these results are in sup-port of the statistical significance of the refractive index re-trievals presented in Fig. 4. The latters are also in good agree-ment with the long term aerosol climatology collected by the photometer network AERONET and described in Dubovik et al. (2002).
4.4 Closure analysis
The methods employed in the previous sections can be sum-marized as follows: from the VELIS lidar we have retrieved βVELIS, σVELIS (β), SVELIS (β), and VVELIS (β). The
in-situ size distribution measurements yielded measured SJRC,
VJRC, whereas application of a Mie code to these size
distri-butions (with “tunable” refractive indices) provided a set of
eighteen estimates of βJRC and σJRC. Then, differences for
each backscatter measurement pair (βVELIS, βJRC) recorded
within 30 min have been minimized to determine the asso-ciated best refractive index m. Now, to evaluate the out-comes of such a minimization, and to assess the quality of the lidar-derived extinction, surface area and volume retrievals, we shall address mean values of the relevant absolute (e.g. Eq. 1) and sign-conserving (bias) differences between the lidar-derived and the in-situ retrieved variables. The time
evolution of aerosol extinction σa, surface area Sa and
vol-ume Va as estimated from lidar and obtained from in situ
FIGURE 6
0 0.5 1 1.5 2 2.5 1.25 1.3 1.35 1.4 1.45 1.5 1.55 1.6 1.65 m dβ a /β a a) W-EU 0 0.5 1 1.5 2 2.5 1.25 1.3 1.35 1.4 1.45 1.5 1.55 1.6 1.65 m dβ a /β a b) N/NW-EU -0.5 0 0.5 1 1.5 2 2.5 1.25 1.3 1.35 1.4 1.45 1.5 1.55 1.6 1.65 m dβ a /β a c) E-EU -0.5 0 0.5 1 1.5 2 2.5 1.25 1.3 1.35 1.4 1.45 1.5 1.55 1.6 1.65 m dβ a /β a d) MED 0 0.5 1 1.5 2 2.5 1.25 1.3 1.35 1.4 1.45 1.5 1.55 1.6 1.65 m dβ a /β a e) AFRFig. 6. Average values of dβa/βa(error bars representing relevant
standard deviations) computed for the five homogeneous-origin air-masses defined in Table 2, and plotted as a function of the eighteen values of refractive index considered in this study (non-zero imagi-nary components are represented by a corresponding decrease in the real part). Single plots correspondence: (a) W-Europe; (b) N-NW Europe; (c) E-Europe; d) Mediterranean, and e) Africa.
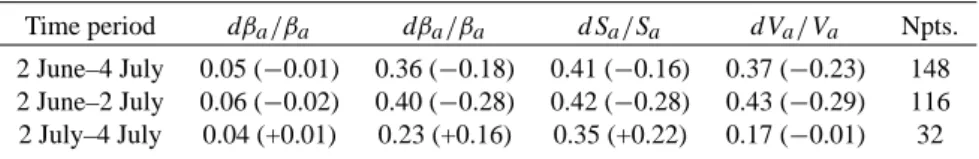
Table 3. Absolute values of average relative differences as of Eq. (1) (in parentheses the sign-conserving relative differences, i.e. bias) between lidar and size distribution-derived aerosol properties. Three periods are addressed: 1) the whole campaign (2 June–4 July), 2) the “continental aerosol period (2 June–2 July at 00:00) and 3) the African dust period (2 July at 00:00–4 July at noon). Backscatter and extinction coefficient differences are obtained after minimization of dβawith respect to refractive index.
Time period dβa/βa dβa/βa dSa/Sa dVa/Va Npts.
2 June–4 July 0.05 (−0.01) 0.36 (−0.18) 0.41 (−0.16) 0.37 (−0.23) 148 2 June–2 July 0.06 (−0.02) 0.40 (−0.28) 0.42 (−0.28) 0.43 (−0.29) 116 2 July–4 July 0.04 (+0.01) 0.23 (+0.16) 0.35 (+0.22) 0.17 (−0.01) 32
measurements (both RH -corrected and non corrected data) is reported in Figs. 7a, 7b and 7c, respectively. Similarly to
the case of βa, these results show that RH -corrected data
provide a better agreement between lidar and in situ data. Three different time intervals will be considered in the com-parative analysis of lidar and in-situ retrievals: 1) the whole campaign, 2 June–4 July (148 data points); 2) the “conti-nental” period 2 June–2 July (116 data points) and 3) the Saharan dust period, 2–4 July (32 data points). Relevant re-sults reported in Table 3 show that minimization with respect to m, led to a decrease in average backscatter differences
dβa/βafrom 0.38 (resulting from a single, best value of m,
e.g. Sect. 4.2) to 0.05 for the whole campaign period, and to
dβa/βa=0.04 in dust conditions. Systematic differences in
these two periods are −0.01 and +0.01, respectively (e.g. Ta-ble 3). These values indicate that, in spite of the finite number of employed refractive indices (18), the minimization led to a good agreement between the two data sets.
The minimization process carried-out for backscatter leads
to average extinction differences dσa/σa=0.36 for the whole
period (e.g. Table 3). In the analysis using a fixed,
“best” refractive index (m=1.45, Sect. 4.2) this value was
dσa/σa=0.55 for RH corrected data and 0.67 for nonRH
-corrected data. Again, the agreement is better during the
Saharan dust event (dσa/σa=0.23) than during the
“conti-nental” period (dσa/σa=0.40). The systematic difference
observed during the latter period (−0.28) becomes smaller and positive (+0.16) in dust conditions. Such a switch is
likely due to an underestimation of σa by the spherical
con-tinental aerosol model applied to lidar observations when in the presence of non-spherical particles, and to an
overesti-mation of σacaused by use of the non-spherical dust model
in the presence of mixed liquid-dust particles. Overall, the non-spherical (dust) model performs better than the spheri-cal (continental aerosol) one. However, considering that the
average relative error expected in the lidar estimation of σa
is of the order of 0.25 for continental aerosols and of 0.40 for Saharan dust (e.g. Sect. 2.1), even the largest average
ab-solute differences reported above (dσa/σa=0.40) fall within
the combined error bars of the VELIS and JRC measure-ments (of the order of 16%, e.g. Sect. 2.2).
Surface area and volume average differences for the whole
campaign decrease from dSa/Sa=0.60 and dVa/Va=0.66
in the non RH -corrected record down to 0.41 and 0.37 for the RH -corrected data. Again, the agreement improves dur-ing the dust event (e.g. Table 3). It is worth noticdur-ing that while for surface area (extinction) systematic differences switch from −0.28 (−0.28) in continental aerosol conditions to +0.22 (+0.16) in dust conditions, in the case of volume the change is much smaller (from −0.29 to −0.01). Results then indicate a better performance of the non-spherical dust model with respect to the continental one also in the case of surface area and volume retrievals. At the same time, the spherical dust model employed in the volume estimates per-forms very well, confirming the effects of a mixed (liquid plus solid) phase of aerosols at the Station level during that event. Taking into account that the average uncertainty
ex-pected in the lidar estimation of Sa(Va) is of the order of 0.30
(0.40) for continental aerosols and of 0.45 (0.80) for Saharan dust (e.g. Sect. 2.1), even the largest average absolute
differ-ences found in this analysis (dSa/Sa=0.42, dVa/Va=0.43)
fall within the combined error bars of the VELIS and JRC measurements (of the order of 22% (29%), e.g. Sect. 2.2).
5 Conclusions
Aerosol extinction, depolarization, surface area and volume profiles obtained by lidar during the MINATROC campaign at Mt. Cimone (1 June–5 July 2000) have been presented. These observations consistently show the presence of a daily, PBL-related aerosol cycle reaching approximately 3 km alti-tude. Transport of Saharan dust was also observed to occur in several occasions, reaching up to 8 km altitude. However, lidar depolarization profiles indicate that during the month of June the dust did not reach down to the Mt. Cimone Sta-tion level (2165 m a.s.l.), where the campaign in situ sam-pling took place. Conversely, a dust event first observed by lidar on 2 July is shown to extend well down to the station level by the afternoon of 3 July, when it also started being detected by the instrumentation deployed there.
To perform a closure analysis, aerosol size distribu-tions observed at the Mt. Cimone Station by DMA and OPC instruments have been employed to compute aerosol
backscatter and extinction coefficients plus surface area and volume. These values have then been compared to retrievals of the same variables as obtained by the VELIS lidar in the corresponding height interval 2170–2245 m. For each mea-surement, minimization of differences between the lidar and the particle counters backscatter coefficients (the latters ob-tained for eighteen values of the refractive index), was shown to provide a statistically significant value of the refractive in-dex m for the relevant aerosol. When using such a refrac-tive index, average differences (whole campaign) between lidar and in situ-retrieved backscatter and extinction coeffi-cients are of 5% and 36%, respectively. In the case of sur-face area and volume, average differences are of the order of 41% and 37%, respectively (e.g. Table 3). All these val-ues fall well within the combined uncertainty of the lidar and in situ retrievals. It was also noticed that all average differ-ences reduced during the July dust event, a case for which a non-spherical scattering model was available to invert the lidar signal. Conversely, in continental aerosol conditions (when a spherical aerosol model was employed) average dif-ferences were observed to increase with depolarization, i.e. with increasing particles non-sphericity. These results show how sensitive to particles shape the quantitative retrieval of aerosol properties by means of optical methods can be. In this context, lidar depolarization measurements were con-firmed to be a very useful tool for recognizing which aerosol shape (that is thermodynamic phase) is being observed and what inversion model to adopt.
By also exploiting air mass back-trajectories, together with the relative humidity record and aerosol chemical analysis (for the Station level) we showed that during the campaign: 1) Western and N-NW Europe aerosols were less soluble and more liquid than Eastern European and Mediterranean ones; 2) Saharan dust was likely externally mixed with a large
amount of soluble aerosols; 3) aerosol depolarization Dawas
correlated with the refractory content of the aerosol, while
−dDa/dRHwas correlated with its soluble fraction (aerosol
depolarization Da and relative humidity RH were
gener-ally anticorrelated, with the exception of the West and NW-European pollution aerosols); and 4) the retrieved refractive indices were positively correlated with the non-soluble and refractory aerosol fraction (non-volatile organic carbon and dust, respectively) observed at Mt. Cimone Station (Putaud et al., 2003).
On the whole, the analysis presented here provides a good (well within the inversion model error bars) in situ valida-tion of the single wavelength lidar estimates of aerosol
ex-tinction, surface area and volume. When considered
to-gether with the validation of lidar-retrieved optical depth ob-servations (Gobbi et al., 2002; Barnaba and Gobbi, 2003), these results show the great potential elastic backscatter, polarization-sensitive lidars have for reducing the current lack in knowledge affecting the altitude-dependent proper-ties of atmospheric aerosols.
FIGURE 7
5 10 15 20 25 30 35
DAY OF JUNE-JULY 2000 (UT)
0 0.1 0.2 0.3 0.4 σa (k m -1) RH-Corrected JRC data X m=1.33-0.0i m=1.55-0.0i VELIS z=2207m (a) 5 10 15 20 25 30 35
DAY OF JUNE- JULY 2000 (UT)
0 100 200 300 400 500 600 700 800 Sa ( µ m 2 cm -3)
Non-corrected JRC Surface Area Sulubility-RH-corrected JRC Surface area VELIS aerosol Surface area (z=2207m)
(b)
5 10 15 20 25 30 35
DAY OF JUNE- JULY 2000 (UT)
0 10 20 30 40 50 Va ( µ m 3 cm -3) Non-corrected JRC Volume Sulubility-RH-corrected JRC Volume VELIS aerosol volume (z=2207m)
(c)
Fig. 7. Comparison of lidar (black dots) and size distribution-derived parameters as observed at the level of the Mt. Cimone Sta-tion during the MINATROC campaign: (a) 532 nm aerosol extinc-tion σa(diamonds and squares represent results for m=1.33–0.0i,
and m=1.55–0.0i, respectively), (b) aerosol surface area Sa, and (c)
aerosol volume Va. In the case of Saand Vadiamonds represent
non RH -corrected DMA data, while squares consider data after hy-groscopic growth.
Acknowledgements. This work has been carried out under the
Eu-ropean Union Contract EVK2-CT-1999-00003 “MINATROC”. We wish to thank P. Bonasoni and F. P. Calzolari for the support pro-vided during the Mt. Cimone campaign.
References
Balkanski, Y., Bauer, S. E., van Dingenen, R., Bonasoni, P., Schulz, M., Fischer, H., Gobbi, G. P., Hanke, M., Hauglus-taine, D., Putaud, J. P., Stohl, A., and Raes, F.: The Mt. Ci-mone, Italy, free tropospheric campaign: principal characteristics of the gaseous and aerosol composition from European pollution, Mediterranean influences and during African dust events, Atmos. Chem. Phys. Discuss., 3, 1753–1776, 2003.
Barnaba, F. and Gobbi, G. P.: Lidar estimation of tropospheric aerosol extinction, surface area and volume: Maritime and desert-dust cases, J. Geophys. Res., 106, 3005–3018, (cor-rection in Barnaba, F. and Gobbi, G. P., JGR, 107, D13, 10.1029/2002JD002340, 2002) 2001.
Barnaba, F. and Gobbi, G. P.: Modeling the aerosol extinction ver-sus backscatter relationship in a mixed maritime-continental at-mosphere: Lidar application and validation, J. Atmos. Ocean. Technol., accepted, 2003.
D’Almeida, G. A., Koepke, P., and Shettle, E. P., Atmospheric Aerosols, A. Deepack Publishing Co., Hampton, VA, 1991. Dubovik, O., Holben, B., Eck, T. F., Smirnov, A., Kaufman, Y. J.,
King, M. D., Tanr´e, D., and Slutsker, I.: Variability of absorption and optical properties of key aerosol types observed in world-wide locations, J. Atmos. Sci., 59, 590–608, 2002.
Facchini, M. C., Mircea, M., Fuzzi, S., and Charlson, R. J.: Cloud albedo enhancement by surface-active organic solutes in growing droplets, Nature, 401, 257–259, 1999.
Franke, K., Ansmann, A., Muller, D., Althausen, D., Wagner, F., and Scheele, R.: One-year observations of particle lidar ratio over the tropical Indian Ocean with Raman lidar, Geophys. Res. Lett., 28, 24, 4559–4562, 2001.
Gasso, S., Hegg, D. A., Covert, D. S., Collins, D., Noone, K. J., Os-trom, E., Schmid, B., Russell, P. B., Livingston, J. M., Durkee, P. A., and Jonsson, H.: Influence of humidity on the aerosol scat-tering coefficient and its effect on the upwelling radiance during ACE 2, Tellus, 52B, 546–567, 2000.
Gobbi, G. P.: Polarization lidar returns from aerosols and thin clouds: a framework for the analysis. Appl. Opt., 37, 5505–5508, 1998.
Gobbi, G. P., Barnaba, F., Giorgi, R., and Santacasa, A.: Altitude-resolved properties of a Saharan dust event over the Mediter-ranean, Atmos. Environ., 34, 5119–5127, 2000.
Gobbi, G. P., Barnaba, F., Blumthaler, M., Labow, G., and Herman, J. R.: Observed effects of particle non-sphericity on the retrieval of marine and desert dust aerosol optical depth by lidar, Atmos. Res., 61, 1–14, 2002.
Jacob, D. J.: Heterogeneous chemistry and tropospheric ozone, At-mos. Env., 34, 2131–2159, 2000.
Karyampudi, V. M., Palm, S. P., Reagen, J. A., Fang, H., Grant, W. B., Hoff, R. M., Moulin, C., Pierce, H. F., Torres, O., Browell, E. V., and Melfi, S. H.: Validation of the Saharan dust plume conceptual model using lidar, Meteosat and ECMWF data, Bull. Am. Met. Soc., 80, 1045–1075, 1999.
Kaufman, Y. J., Tanr´e D., and Boucher, O.: A satellite view of aerosols in the climate system, Nature, 419, 215–223, 2002.
Klett, J. D.: Lidar inversion with variable backscatter/extinction ra-tios, Appl. Opt., 24, 1638–1643, 1985.
Measures, R. M.: Laser Remote Sensing, J. Wiley, New York, 1984. Mishchenko, M. I., Travis, L. D., Kahn, R. A., and West, R. A.: Modeling phase functions for dustlike tropospheric aerosols us-ing a shape mixture of randomly oriented polydisperse spheroids, J. Geophys. Res., 102, 16 831–16 847, 1997.
Mueller, D., Wandinger, U., and Ansmann, A.: Microphysical par-ticle parameters from extinction and backscatter lidar data by in-version with regularization: Theory, Appl. Opt., 38, 2346–2357, 1999.
Penner, J. E., Andreae, M., Annegarn, H., Barrie, L., Feichter, J., Hegg, D., Jayaraman, A., Leaitch, R., Murphy, D., Nganga, J., and Pitari, G.: Aerosols, their Direct and Indirect Effects, in Cli-mate Change 2001: The Scientific Basis, Cambridge University Press, Cambridge, 2001.
Putaud, J. P., Van Dingenen, R., Mangoni, M., Virkkula, A., Raes, F., Maring, H., Prospero, J. M., Swietlicki, E., Berg, O. J., Hillamo, R., and Makela, T.: Chemical mass closure and assess-ment of origin of the submicron aerosol in the marine boundary layer and the free troposphere at Tenerife during ACE 2, Tellus, 52B, 141–168, 2000.
Putaud, J. P., Van Dingenen, R., Dell’Acqua, A., Matta, E., Dece-sari, S., Facchini, M. C., and Fuzzi, S.: Size-segregated aerosol mass closure and chemical composition in Monte Cimone (I) during Minatroc, Atmos. Chem. Phys. Discuss., 3, 4097—4127, 2003.
Qing, P., Nakane, H., Sasano, Y., and Kitamura, S.: Numerical simulation of the retrieval of aerosol size distribution from mul-tiwavelength laser radar measurements, Appl. Opt., 28, 5259– 5265, 1989.
Raes F., Van Dingenen, R., Vignati, E., Wilson, J., Putaud, J. P., Se-infeld, J. H., and Adams, P.: Formation and cycling of aerosol in the global troposphere, Atmos. Environ., 34, 4215–4240, 2000. Ramanathan, V., Crutzen, P. J., Kiehl, J. T., and Rosenfeld, D.:
Aerosols, climate and the hydrological cycle, Science, 294, 2119–2124, 2001.
Rosenfeld, D.: TRMM observed first direct evidence of smoke from forest fires inhibiting rainfall, Geophys. Res. Lett., 26, 3105– 3108, 1999.
Russell, P. B., Swissler, T. J., and McCormick, M. P.: Methodology for error analysis and simulation of lidar aerosol measurements, Appl. Opt., 18, 3783–3797, 1979.
Stohl, A. and Wotawa, G.: A method for computing single trajecto-ries representing boundary layer transport, Atmos. Environ., 29, 3235–3239, 1995.
Sassen, K.: Indirect climate forcing over the western US from Asian dust storms, Geophys. Res. Lett., 29, 10, 10.1029/2001GL014051, 2002.
Veselovskii, I, Kolgotin, A., Griaznov, V., Mueller, D., Wandinger, U., and Whiteman, D. N.: Inversion with regularization for the retrieval of tropospheric aerosol parameters from multiwave-length lidar sounding, Appl. Opt., 41, 3685–3699, 2002.