Publisher’s version / Version de l'éditeur:
Building and Environment, 37, April 4, pp. 363-377, 1998-11-01
READ THESE TERMS AND CONDITIONS CAREFULLY BEFORE USING THIS WEBSITE. https://nrc-publications.canada.ca/eng/copyright
Vous avez des questions? Nous pouvons vous aider. Pour communiquer directement avec un auteur, consultez la
première page de la revue dans laquelle son article a été publié afin de trouver ses coordonnées. Si vous n’arrivez pas à les repérer, communiquez avec nous à PublicationsArchive-ArchivesPublications@nrc-cnrc.gc.ca.
Questions? Contact the NRC Publications Archive team at
PublicationsArchive-ArchivesPublications@nrc-cnrc.gc.ca. If you wish to email the authors directly, please see the first page of the publication for their contact information.
Archives des publications du CNRC
This publication could be one of several versions: author’s original, accepted manuscript or the publisher’s version. / La version de cette publication peut être l’une des suivantes : la version prépublication de l’auteur, la version acceptée du manuscrit ou la version de l’éditeur.
For the publisher’s version, please access the DOI link below./ Pour consulter la version de l’éditeur, utilisez le lien DOI ci-dessous.
https://doi.org/10.1016/S0360-1323(01)00042-7
Access and use of this website and the material on it are subject to the Terms and Conditions set forth at
Applicability of daylighting computer modeling in real case studies:
comparison between measured and simulated daylight availability and
lighting consumption
Galasiu, A. D.; Atif, M. R.
https://publications-cnrc.canada.ca/fra/droits
L’accès à ce site Web et l’utilisation de son contenu sont assujettis aux conditions présentées dans le site LISEZ CES CONDITIONS ATTENTIVEMENT AVANT D’UTILISER CE SITE WEB.
NRC Publications Record / Notice d'Archives des publications de CNRC:
https://nrc-publications.canada.ca/eng/view/object/?id=feecc95c-8c08-4340-9a00-8eaef8571475 https://publications-cnrc.canada.ca/fra/voir/objet/?id=feecc95c-8c08-4340-9a00-8eaef8571475
in Real Case Studies: Comparison between
Measured and Simulated Daylight Availability
and Lighting Consumption
Galasiu, A.D.; Atif, M.R.
A version of this paper is published in / Une version de ce document se trouve dans : IEA (International Energy Agency) Task 21 / Annex 29: Daylight in Buildings, November
1998, 68 pp.
www.nrc.ca/irc/ircpubs
T21/C1-21/CAN/98-11
Applicability of Daylighting Computer
Modeling in Real Case Studies:
Comparison between Measured and
Simulated Daylight Availability and
Lighting Consumption
A report of IEA SHC Task 21 / IEA ECBCS Annex 29
Daylight in Buildings
November 1998
Applicability of Daylighting Computer Modeling in Real Case
Studies: Comparison between Measured and Simulated Daylight
Availability and Lighting Consumption
by
Anca D. Galasiu * Morad R. Atif *
A report of IEA SHC Task 21 / IEA ECBCS Annex 29
Daylight in Buildings
November 1998
* National Research Council Canada, Institute for Research in
Construction, Indoor Environment Research Program
IEA Solar Heating and Cooling Programme (IEA SHC)
The International Energy Agency (IEA) was established in 1974 as an autonomous agency within the framework of the Economic Cooperation and Development (OECD) to carry out a
comprehensive program of energy cooperation among its 24 member countries and the Commission of the European Communities.
An important part of the Agency’s program involves collaboration in the research, development and demonstration of new energy technologies to reduce excessive reliance on imported oil, increase long-term energy security and reduce greenhouse gas emissions. The IEA’s R&D activities are headed by the Committee on Energy Research and Technology (CERT) and supported by a small Secretariat staff, headquartered in Paris. In addition, three Working Parties are charged with monitoring the various collaborative energy agreements, identifying new areas for cooperation and advising the CERT on policy matters.
Collaborative programs in the various energy technology areas are conducted under Implementing Agreements, which are signed by contracting parties (government agencies or entities designated by them). There are currently 41 Implementing Agreements covering fossil fuel technologies, renewable energy technologies, efficient energy end-use technologies, fusion technology and energy technology information centers.
The Solar Heating and Cooling Programme (SHC) was one of the first IEA Implementing Agreements to be established. Since 1977, its 21 members have been collaborating to advance active solar, passive solar and photovoltaic technologies and their application in buildings.
Australia Greece New Zealand
Austria Finland Norway
Belgium France Spain
Canada Italy Sweden
Denmark Japan Switzerland
European Commission Mexico United Kingdom
Germany Netherlands United States
A total of 26 Tasks have been initiated, 19 of which have been completed. Each Task is managed by an Operating Agent from one of the participating countries. Overall control of the program rests with an Executive Committee comprised of one representative from each contracting party to the Implementing Agreement. In addition, a number of special ad hoc activities--working groups, conferences and workshops--have been organized.
The Tasks of the IEA Solar Heating and Cooling Programme, both completed and current, are as follows:
Completed Tasks:
Task 1 Investigation of the Performance of Solar Heating and Cooling Systems Task 2 Coordination of Solar Heating and Cooling R&D
Task 3 Performance Testing of Solar Collectors
Task 4 Development of an Insolation Handbook and Instrument Package Task 5 Use of Existing Meteorological Information for Solar Energy Application Task 6 Performance of Solar Systems Using Evacuated Collectors
Task 7 Central Solar Heating Plants with Seasonal Storage Task 8 Passive and Hybrid Solar Low Energy Buildings Task 9 Solar Radiation and Pyranometry Studies Task 10 Solar Materials R&D
Task 11 Passive and Hybrid Solar Commercial Buildings
Task 12 Building Energy Analysis and Design Tools for Solar Applications Task 13 Advance Solar Low Energy Buildings
Task 14 Advance Active Solar Energy Systems Task 16 Photovoltaics in Buildings
Task 17 Measuring and Modeling Spectral Radiation Task 18 Advanced Glazing Materials for Solar Applications Task 19 Solar Air Systems
Task 20 Solar Energy in Building Renovation
Current Tasks and Working Groups:
Task 21 Daylight in Buildings
Task 22 Building Energy Analysis Tools
Task 23 Sustainable Solar Buildings: The Optimization of Solar Energy Use in Larger Buildings Task 24 Active Solar Procurement
Task 25 Solar Assisted Air Conditioning of Buildings Task 26 Solar Combosystems
Task reports and ordering information can be found in the IEA Solar Heating and Cooling Programme publications list. For additional information contact the SHC Executive Secretary, Pamela Murphy Kunz, Morse Associates Inc.,1808 Corcoran Street, NW, Washington, DC 20009, USA,Telephone:+1/202/483-2393, Fax:+1/202/265-2248, E-mail:pmurphykunz@compuserve.com Also, visit our web site at: http://www.iea-shc.org
IEA Energy Conservation in Buildings and Community Systems (IEA ECBCS)
The IEA sponsors research and development in a number of areas related to energy. In one of these areas, energy conservation in buildings, the IEA is sponsoring various exercises to predict more accurately the energy use of buildings, including comparison of existing computer programs, building monitoring, comparison of calculation methods, as well as air quality and studies of occupancy.
The Executive Committee
Overall control of the programme is maintained by an Executive Committee, which not only monitors existing projects but also identifies new areas where collaborative effort may be beneficial. To date the following have been initiated by the Executive Committee (completed projects are identified by *):
1 Load Energy Determination of Buildings *
2 Ekistics and Advanced Community Energy Systems *
3 Energy Conservation in Residential Buildings *
4 Glasgow Commercial Building Monitoring *
5 Air Infiltration and Ventilation Centre
6 Energy Systems and Design of Communities *
7 Local Government Energy Planning *
8 Inhabitant Behaviour with Regard to Ventilation *
9 Minimum Ventilation Rates *
10 Building HVAC Systems Simulation *
11 Energy Auditing *
12 Windows and Fenestration *
13 Energy Management in Hospitals *
14 Condensation *
15 Energy Efficiency in Schools *
16 BEMS - 1: Energy Management Procedures *
17 BEMS - 2: Evaluation and Emulation Techniques *
18 Demand Controlled Ventilating Systems *
19 Low Slope Roof Systems *
20 Air Flow Patterns within Buildings *
21 Thermal Modelling *
22 Energy Efficient Communities *
23 Multi-zone Air Flow Modelling (COMIS) *
24 Heat Air and Moisture Transfer in Envelopes *
25 Real Time HEVAC Simulation *
26 Energy Efficient Ventilation of Large Enclosures *
28 Low Energy Cooling Systems*
29 Daylight in Buildings
30 Bringing Simulation to Application
31 Energy Related Environmental Impact of Buildings
32 Integral Building Envelope Performance Assessment
33 Advanced Local Energy Planning
34 Computer-aided Evaluation of HVAC System Performance
IEA SHC Task 21 Subtask C List of Participants and contacts November 1998
Maurice Aizlewood Megatron Limited
165 Malborough Road London N19 4NE United Kingdom Telefon: +44 (0) 171 272 3739 Telefax: +44 (0) 171 272 5975 E-mail: admin@megatron.co.uk Morad Atif Anca Galasiu
National Research Council Canada Institute for Research in Construction Indoor Environment Research Program Bldg. M24 Montreal Road
Ottawa, Ontario K1A 0R6 Canada
Telefon: +1 613 993 9629 Telefax: +1 613 954 3733 E-mail: morad.atif@nrc.ca anca.galasiu@nrc.ca
Magali Bodart Université Catholique de Louvain
Architecture et Climat Place de Levant 1 1348 Louvain-la-Neuve Belgium Telefon: +32 1047 2223 Telefax: +32 1047 2150 E-mail: bodart@arch.ucl.ac.be Jan de Boer Michael Dirksmöller
Hans Erhorn (Subtask C leader)
Fraunhofer Institut für Bauphysik Nobelstrasse 12 70569 Stuttgart Germany Telefon: +49 711 970 3380 Telefax: +49 711 970 3399 E-mail: jdb@ibp.fhg.de md@ibp.fhg.de erh@ibp.fhg.de
William Carroll Lawrence Berkeley National Laboratory
Building 90 – Room 3026 94720 Berkeley, CA USA Telefon: +1 510 486 4890 Telefax: +1 510 486 5454 E-mail: wlcaroll@lbl.gov Ulla Dissing Sven Olssen Signal Control IDEON 223 70 Lund Sweden Telefon: +46 286 2000 Telefax: +46 1841 68 E-mail: ulla.dissing@signal.se sven.olsson@signal.se
Marc Fontoynont ENTPE/DGCB
Rue Maurice Audin
69518 Vaulx-en-Velin, Cedex France Telefon: +334 7204 7035 Telefax: +334 7204 7041 E-mail: marc.fontoynont@entpe.fr Karl Grau Kjeld Johnson
(Task 21 Operating Agent)
Danish Building Research Institute Postboks 119 DK-2970 Hørsholm Denmark Telefon: +45 45 86 55 33 Telefax: +45 45 86 75 35 E-mail: kg@sbi.dk kjj@sbi.dk
Nicole Hopkirk EMPA
Überlandstrasse 129 8600 Dübendorf Switzerland Telefon: +41 1 823 4791 Telefax: +41 1 823 4009 E-mail: nicole.hopkirk@empa.ch
Bernard Paule
Jean-Louis Scartezzini
LESO-PB/EPFL
École Polytechnique Fédérale de Lausanne 1015 Lausanne Switzerland Telefon: +41 21 693 5554 Telefax: +41 21 693 5550 E-mail: bernard.paule@epfl.ch scartezzini@leso.da.epfl.ch
Nils Svendenius Lund University
Dept. of Atomic Spectroscopy Sölvegatan 14 223 62 Lund Sweden Telefon: +46 46 222 7732 Telefax: +46 46 222 4709 E-mail: nils.svendenius@fysik.lu.se
Table of Contents
page
Table of Contents ...……. ii
List of Figures ...……. iii
List of Tables ...……. v Summary...………... vi Acknowledgments ...……. viii Introduction ...……. 1 Problem ...….…... 1 Objectives ...…….… 1
Case Study Description ...….…... 1
Description of Daylighting Features ...………. 2
Fenestration ...………. 2
Electrical Lighting System ...……… 2
Internal Reflectances ...……… 3
Description of the Adeline 1.0 Computer Software ………. 7
Methodology ...…… 8
On-site monitoring ……… 8
Measurements of Indoor Illuminance ...….…… 8
Measurements of Indoor Illuminance Below the Skylight ...……… 10
Measurements of Outdoor Illuminance ...………. 11
Measurements of Outdoor Solar Radiation ……….. 11
Measurements of Electrical Lighting Consumption ...….…... 13
Computer simulation ……… 13
Superlite Simulation Model ……….. 13
Superlink Simulation Model ………. 15
Radiance Simulation Model ………. 16
Results ...………... 18
Comparison between Measured and Simulated Data using the Superlite Model ...…….. 18
Comparison between Measured and Simulated Outdoor Illuminance for June 1995 ……… 18
Comparison between Measured and Simulated Indoor Illuminance for June 1995 ………... 19
Comparison between Measured and Simulated Outdoor Illuminance for December 1995… 26 Comparison between Measured and Simulated Indoor Illuminance for December 1995….. 26
Comparison between Measured and Simulated Data using Superlink ……… 33
Comparison between Measured and Simulated Data using the Radiance Model ...……… 35
Comparison between Measured and Simulated Illuminance for a Clear Sky in the Summer………... 35
Comparison between Measured and Simulated Illuminance for a Clear Sky in the Winter……….. 45
Comparison between Measured and Simulated Illuminance for an Overcast Sky …………. 55
Conclusions ...……. 65
Superlite Model ...……….………. 65
Superlink Model ...……….... 66
Radiance Model ………...……… 66
List of Figures
Figure Title Page
1 Plan and section of the atrium space ……….… 4
2 Plan and section of the atrium fenestration ……….…. 5
3 Location of atrium light sources ………... 6
4 Location of illuminance test-points ………... 9
5 Location of illuminance photosensors below the atrium skylight ………..…. 10
6 Plan view of the atrium roof and location of the daylighting monitoring station ………….…. 12
7 Section view through the atrium building and location of the daylighting monitoring station 12 8 Superlite simulation model – Atrium 1st, 2nd, and 3rd Floors ………... 14
9 Layout of test-points on the horizontal plane where comparisons between measured and simulated data were performed ……….…. 15
10 Radiance simulation model – Atrium 1st Floor (night-time, north-west view) ……….… 17
11 Radiance simulation model – Atrium 2nd Floor (night-time, south-east view) ……….... 17
12 Radiance simulation model – Atrium 3rd Floor (night-time, south-east view) ………... 17
13 Measured and Superlite simulated horizontal outdoor illuminance for June 6, June 8 and June 14, 1995 ………... 18
14 Measured and Superlite simulated indoor horizontal illuminance for June 6, June 8 and June 14, 1995 – 1st Floor – east, west, north and south test-points ……… 21
15 Measured and Superlite simulated indoor horizontal illuminance for June 6, June 8 and June 14, 1995 – 2nd Floor – east, west, north and south test-points ……….. 22
16 Measured and Superlite simulated indoor horizontal illuminance for June 6, June 8 and June 14, 1995 – 3rd Floor – east, west, north and south test-points ………... 23
17 Measured and Superlite simulated indoor horizontal illuminance for June 6, June 8 and June 14, 1995 – east, west, north and south test-points at base of skylight ………... 24
18 Measured and Superlite simulated indoor horizontal illuminance for June 6, June 8 and June 14, 1995 – Center of atrium ground floor and base of skylight ……….... 25
19 Measured and Superlite simulated outdoor horizontal illuminance for December 4, December 8 and December 15, 1995 ……… 26
20 Measured and Superlite simulated indoor horizontal illuminance December 4, December 8 and December 15, 1995 – 1st Floor – east, west, north and south test-points …………... 28
21 Measured and Superlite simulated indoor horizontal illuminance December 4, December 8 and December 15, 1995 – 2nd Floor – east, west, north and south test-points ………..… 29
22 Measured and Superlite simulated indoor horizontal illuminance December 4, December 8 and December 15, 1995 – 3rd Floor – east, west, north and south test-points ………….. 30
23 Measured and Superlite simulated indoor horizontal illuminance December 4, December 8 and December 15, 1995 – east, west, north and south test-points at base of skylight ..… 31
24 Measured and Superlite simulated indoor horizontal illuminance December 4, December 8 and December 15, 1995 – center of atrium ground floor and base of skylight ………….... 32
25 Measured and Radiance simulated indoor horizontal illuminance in the center of the atrium ground floor for June 8, 1995 ……….…. 36
26 Measured and Radiance simulated indoor horizontal illuminance for June 8, 1995 at various test-points located at the base of the atrium skylight ……….………... 36
27 Measured and Radiance simulated indoor horizontal illuminance for a clear sky in the summer at various test-points located at the atrium perimeter ………. 37
28 Measured and Radiance simulated indoor horizontal illuminance for a clear sky in the summer at various test-points located at 3.5 meters away from the atrium perimeter …..… 38
29 Radiance representation of the atrium ground floor under a clear sky in the summer …..… 39 30 Radiance representation of the atrium 2nd floor under a clear sky in the summer ….…….. 40 31 Radiance representation of the atrium 3rd floor under a clear sky in the summer ….……… 41 32 Falsecolor Radiance representation of the atrium ground floor under a clear sky in the
summer ….……….… 42 33 Falsecolor Radiance representation of the atrium 2nd floor under a clear sky in the
summer ….……….… 43 34 Falsecolor Radiance representation of the atrium 3rd floor under a clear sky in the summer
….………. 44
35 Measured and Radiance simulated indoor horizontal illuminance in the center of the atrium
ground floor for December 8, 1995 ………... 46
36 Measured and Radiance simulated indoor horizontal illuminance for December 8, 1995 at various test-points located at the base of the atrium skylight ……….………... 46 37 Measured and Radiance simulated indoor horizontal illuminance for a clear sky in the
winter at various test-points located at the atrium perimeter ……….…… 47 38 Measured and Radiance simulated indoor horizontal illuminance for a clear sky in the
winter at various test-points located at 3.5 meters away from the atrium perimeter ….……. 48 39 Radiance representation of the atrium ground floor under a clear sky in the winter ….……. 49 40 Radiance representation of the atrium 2nd floor under a clear sky in the winter ….…….…. 50 41 Radiance representation of the atrium 3rd floor under a clear sky in the winter ….………… 51 42 Falsecolor Radiance representation of the atrium ground floor under a clear sky in the
winter ….……….…… 52 43 Falsecolor Radiance representation of the atrium 2nd floor under a clear sky in the winter 53
44 Falsecolor Radiance representation of the atrium 3rd floor under a clear sky in the winter 54
45 Measured and Radiance simulated indoor horizontal illuminance in the center of the atrium
ground floor for December 15, 1995 ………..… 56
46 Measured and Radiance simulated indoor horizontal illuminance for December 15, 1995 at
various test-points located at the base of the atrium skylight ……….………..… 56
47 Measured and Radiance simulated indoor horizontal illuminance for an overcast sky at various test-points located at the atrium perimeter ………. 57 48 Measured and Radiance simulated indoor horizontal illuminance for an overcast sky at
various test-points located at 3.5 meters away from the atrium perimeter ….….…………... 58 49 Radiance representation of the atrium ground floor under an overcast sky ….….…………. 59 50 Radiance representation of the atrium 2nd floor under an overcast sky .….…….………….. 60 51 Radiance representation of the atrium 3rd floor under an overcast sky…….……….. 61 52 Falsecolor Radiance representation of the atrium ground floor under an overcast sky ….... 62 53 Falsecolor Radiance representation of the atrium 2nd floor under an overcast sky ….….... 63 54 Falsecolor Radiance representation of the atrium 3rd floor under an overcast sky ….……. 64
List of Tables
Table Title Page
1 Fenestration glass systems ………. 5
2 Lamps and lighting control system ………. 6
3 On-site monitored skylight visible transmittance ……….. 13
4 Measured versus Superlite simulated indoor horizontal illuminance for June 6, June
8 and June 14, 1995 ………. 19
5 Measured versus Superlite simulated indoor horizontal illuminance for December 4,
December 8 and December 15, 1995 ……… 27
6 Lighting energy savings resulted from the use of daylighting in combination with an
on/off lighting control system ……… 33
7 Measured versus Radiance simulated indoor horizontal illuminance for a clear sky on
June 8, 1995 ………. 36
8 Measured versus Radiance simulated indoor horizontal illuminance for a clear sky on
December 8, 1995 ……… 46
9 Measured versus Radiance simulated indoor horizontal illuminance for an overcast
Summary
This official IEA report is a deliverable of the IEA SHC Task 21 / IEA ECBCS Annex 29: Daylight in Buildings. The task focuses on daylighting systems and strategies which can be applied in new and existing buildings with high electricity saving potential such as offices, schools, commercial and institutional buildings. The daylighting performance of these strategies is tested in laboratory facilities, through modeling, and in real case study buildings. This report is a deliverable of the Subtask C research projects. The main objective of Subtask C, as stated in the Implementing Agreement of IEA SHC Task 21 / IEA ECBCS Annex 29 is “to improve the capability, accuracy and ease-of-use of daylighting design and analysis tools for building design practitioners. The practitioners will be able to predict the performance of different daylighting systems and control strategies and to evaluate the impact of the integration of daylighting in the overall building energy concept by using these design tools“. Subtask C work included the development of the Adeline lighting software, along with the assessment of its capabilities and accuracy.
This report investigates the accuracy and limitations of the Adeline 1.0 lighting software in
simulating the illuminance distribution from daylighting and the electrical lighting energy savings of an existing atrium building. The purpose of the study was to compare the Superlite, Superlink and Radiance computed outputs against data collected in a real building.
The case study is an enclosed atrium space located in Ottawa, Canada. The atrium is a three-storey octagonal construction roofed by a pyramidal skylight made of several glazing systems. The space is equipped with an automatic on/off lighting control system operated by a daylight photosensor located in another atrium space part of the same facility. Field work was conducted for both summer and winter conditions and included measurements of horizontal indoor and outdoor illuminance, solar radiation and electrical lighting system time-of-use. The computer simulation phase consisted in the creation of two computer models, a Superlite/Superlink simple model and a Radiance model used to simulate the daylighting performance of the atrium space. The accuracy of the Superlite and Radiance programs in simulating interior daylight levels was evaluated based on comparisons between the predicted and the on-site measured illuminance. In addition, the Superlite simulated outdoor illuminance was compared with the measured outdoor illuminance. The amount of electrical lighting displaced by daylighting via the automatic on/off lighting control system was also compared in order to evaluate the prediction of lighting energy savings.
Data shows that the Superlite predicted outdoor illuminance was closer to the measured outdoor illuminance for clear sky conditions than for overcast sky. Despite the fact that the distribution profiles of simulated illuminance followed closely the profiles of measured illuminance under both sky conditions, the instantaneous illuminance was significantly underpredicted especially under overcast sky. Under a summer clear sky, the outdoor illuminance was slightly overpredicted and the discrepancy between the measured and the simulated instantaneous illuminance was between 1 and 16%. Under a winter clear sky, the outdoor illuminance was slightly underpredicted and the difference between the measured and the simulated instantaneous illuminance was between 12 and 29%. The range of measured illuminance differed greatly from the predicted range for
overcast sky conditions, the outdoor illuminance being in this case notably underpredicted by up to 60%.
The discrepancy between the outdoor measured and simulated illuminance reflected on the simulated indoor illuminance, which was underpredicted by 50% for both a winter clear sky and an overcast sky. This underprediction was likely to affect the subsequent Superlink long-term energy calculations and suggested that annual savings from daylighting may in reality be higher than predicted. Summer data showed a good agreement in overall range and distribution pattern between the measured and the simulated indoor illuminance under a clear sky. However, despite this good overall agreement, the instantaneous illuminance differed sometimes by 3 to 10 times from the measured value. This high instantaneous discrepancy was attributed to the geometrical differences between the real and the simulated space, and was not likely to alter the long-term energy calculations since both the measured and the simulated illuminance were considerable above the space design illuminance.
The comparison between the measured and the Radiance computed data showed that, for any particular sky condition, the computer model has the potential to accurately model the daylighting performance of a space if relevant input data, such as precise space geometry, construction materials properties and actual sky description are available. For the case study, the range and distribution pattern of the simulated horizontal indoor illuminance were in good agreement with the predicted illuminance under diffuse daylight for both a summer and a winter clear sky. However, the instantaneous simulated illuminance differed at times by as much as 100% from the measured values under direct sun. Indoor illuminance was very well predicted by Radiance for an overcast sky. The instantaneous discrepancy between the measured and the simulated illuminance was in this case below 20%, confirming the fact that diffuse daylight was simulated more accurately than the direct component. The occasional high discrepancy between the measured and the simulated illuminance under direct sun was partly attributed to the overall average transmittance used to account for the three glazing systems of the atrium skylight. It is believed that with more time invested in reproducing the exact configuration of the atrium fenestration, more accurate results could be obtained.
The discrepancy between the measured and the Superlink computed lighting energy savings was 22% for June 1995. On-site lighting control problems caused measured savings to be 3 times lower than predicted for December 1995. The small discrepancy obtained for the summer month was attributed to the overprediction of daylight availability in the weather file. The significant difference between the measured an the simulated data for the winter month was attributed to the snow and frost that covered the skylight during the entire month and the abnormal operation of the lighting control system under these conditions. It is believed that the measured savings would have been much closer to the predicted values, had the control system functioned properly. The poor winter performance of the lighting control system affected greatly the discrepancy between the measured and the simulated annual energy savings. While the predicted annual savings were about 28700 kWh/year, the savings estimated from measurements were only 17830 kWh/year, which is 61% lower than predicted.
Acknowledgements
The authors would like to acknowledge the financial contribution of Natural Resources Canada; Panel for Energy Research & Development Canada (PERD); and the National Research Council Canada. IEA SHC Task 21 Subtask C participants in particular, and IEA SHC Task 21
participants in general, have provided valuable feedback and comments towards this report. Hans Erhorn, Jan de Boer, and Michael Dirksmoller have provided valuable input with respect to the use of the Adeline software. The list of Subtask C participants is provided below.
Maurice Aizlewood Morad Atif Magali Bodart Jan de Boer William Carroll Michael Dirksmöller Ulla Dissing
Hans Erhorn (Subtask C leader) Marc Fontoynont Anca Galasiu Karl Grau Nicole Hopkirk Sven Olssen Bernard Paule Jean-Louis Scartezzini Nils Svendenius
Kjeld Johnsen and Marc Fontoynont have also provided feedback that helped improve the content of this document.
APPLICABILITY OF DAYLIGHTING COMPUTER MODELING IN REAL CASE STUDIES: COMPARISON BETWEEN MEASURED AND SIMULATED DAYLIGHT AVAILABILITY AND
LIGHTING CONSUMPTION
Anca D. Galasiu Morad R. Atif
INTRODUCTION
Problem
Energy savings from daylighting in buildings have always been predicted using computer simulation. Yet, daylight prediction models and computer software have rarely been validated against real case studies with real occupancy. The degree of accuracy and behavior profile of daylighting performance indicators using computer simulation are also not known. Several daylighting and lighting software have been developed and are often used without enough knowledge about their accuracy or limitations. Validation studies are usually limited to test cells that do not include all the operation aspects of normal building activity. For these software to be applied as design tools, it is important to know not only their limitations and applicability, but also their prediction capabilities.
This report presents the validation of the Adeline 1.0 lighting design and analysis software. This work was initiated by the need to use the Adeline software in a future study that has the aim to develop design guidelines for atrium buildings. This report outlines the software accuracy and limitations in predicting specific lighting parameters in a real atrium space. Computed outputs are compared against data collected in a real case study with real occupancy.
Objectives
The objectives of the study are directed towards testing the accuracy of the Adeline 1.0 software in simulating the illumination levels and electric lighting energy consumption of an existing atrium building. These objectives are:
• to verify the accuracy of the Superlite program in calculating indoor horizontal illuminance
levels from daylighting;
• to determine the accuracy of the Superlink program in predicting the impact of daylighting on
the lighting energy balance of the building;
• to verify the accuracy of the Radiance program in calculating the illuminance from daylighting
on several horizontal planes in the atrium building.
These objectives are intended to address the degree of accuracy and the limitations that could realistically be expected when predicting specific lighting parameters in a given space with real occupancy and complex geometry, and when using the Adeline 1.0 software as a design tool for such complex daylighting systems.
Case Study Description
The monitored atrium building is located in the center of a large empty land, in the western suburb
of Ottawa, Canada. The site is at a latitude of 45.24°, a longitude of 75.43° and an altitude of 125
m (416 ft). The atrium, which is one of seven atria of a large office\research facility, is a three-storey octagonal construction located at the main entrance of the research complex. Figure 1 shows a plan and a section of the building.
The atrium space is surrounded by walkways leading to adjacent offices and meeting rooms. Main occupancy occurs between 7 AM to 7 PM. Primary activities include standing, walking and occasional reading, or similar work. A linear corridor connects the atrium to the rest of the
building. The first floor houses the main building entrance and reception desk and has a floor area
of 151 m2 (1625 ft2). The second and third floors contain offices and conference rooms adjacent to
the atrium and have floor areas of 91 m2 (980 ft2) each. The adjacent rooms were not designed to
receive light from the atrium and have their own exterior fenestration.
Description of Daylighting Features
Daylight features of the space include a skylight and an automatic on/off daylight-linked lighting control system.
Fenestration
The top-fenestration has an area of 161 m2 (1732 ft2). The atrium skylight has a pyramidal shape
and was designed to provide abundant daylight in the winter, while minimizing the solar load in the summer. Figure 2 shows a plan and cross-section of the fenestration. As shown, the glazing system along the skylight area is not uniform and consists of three glazing systems. Table 1 summarizes the material on each layer of the three glazing systems. Each system is triple-glazed, consisting of two air spaces and a heat mirror sandwiched between an inner and outer layer of glass. The patterned glass has opaque horizontal lines applied across it (ceramic frit). This pattern reduces the overall glazing area by 20% (80% open, 20% patterned). There are two different types of heat mirrors used in the fenestration glass systems: HM66/clear and
HM55/green. Manufacturer’s specifications state that HM66/clear has a transmittance of 53% and an exterior reflectance of 24%, while HM55/green has a transmittance of 38% and an exterior reflectance of 28%. No similar information was available about the transmittance of the clear and laminated layers of glass. Consequently, both clear and laminated glass were estimated from the literature to have a transmittance of about 78% and a reflectance of 7%. Similarly, the green-tinted glass was estimated to have a transmission of 46% and a reflectance of 5%.
Electrical Lighting System
Recessed incandescent fixtures, 150PAR38, mounted at a height of 3.8 m from the floor, provide primary artificial illumination in the atrium. There are sixteen of these fixtures identically arranged on each of the three floors. Every second fixture provides emergency lighting and remains always on. A single daylight sensor controls the remaining fixtures. This sensor is located just below the fenestration of another atrium. Upon initial installation, the daylight sensor was adjusted iteratively until occupant complaints in the building were minimized. The sensor also controls eight
500PAR56 recessed incandescent fixtures located on the second floor, that are directed towards the center of the atrium floor at ground level. Figure 3 shows the location of the lighting fixtures for all three floors of the atrium, and Table 2 summarizes the lamps and lighting control system in the atrium. The lighting system also includes eight manually operated MH175 mercury vapor fixtures for floodlighting of the roofline glazing (architectural accent lighting used at twilight and night time), five continually powered recessed incandescent MR75 tasklighting fixtures above each of the two
reception counters on the ground floor, and twelve incandescent A19 wallwash lighting in the ground floor reception area.
Internal Reflectances
The reflectance of the walls and ceilings inside the atrium has been estimated to be between 60 and 70% (IESNA Handbook, 1993). The metallic frame of the skylight is light-colored. The walkways surrounding the atrium are covered with a textile carpet, patterned with red and green strips, with an estimated reflectance between 20 and 35%. The atrium floor is partly covered by a central octagonal textile carpet with an average reflectance of 20%, surrounded by a polished marble surface with an estimated reflectance between 30 and 45%.
Figure 2 Plan and section of the atrium fenestration
Table 1
Fenestration Glass Systems
Glass Type Layer 1
(Exterior)
Layer 2 Layer 3 Layer 4 Layer 5
(Interior) A Low reflectance 6 mm heat strengthened clear glass 13 mm air space HM66 clear polyester film 13 mm air space 6 mm clear glass A1 Low reflectance 6 mm heat strengthened clear glass 13 mm air space HM66 clear polyester film 13 mm air space 6 mm thick clear laminated glass D1 (Green) Low transmittance 6 mm heat strengthened tinted and patterned
glass 13 mm air space HM55 green polyester film 13 mm air space 6 mm thick clear laminated glass
Figure 3 Location of atrium light sources
Table 2
Lamps and Lighting Control System
Lamp Type Purpose Location Number Control
150PAR38 Corridor Lighting All Floors 8 per floor Photo - Auto. On/Off 150PAR38 Emergency Lighting All Floors 8 per floor Always On
MR75 Lamps above Reception Desk 1st
Floor 10 Always On
500PAR56 Decorative Lighting for 1st Floor 2nd Floor 8 Photo - Auto. On/Off
MH175 Roofline Floodlighting 3rd
Description of the Adeline Computer Software
Adeline 1.0 includes 5 inter-linked programs (Adeline User’s Manual, 1994):
• Scribe is a CAD-program used to describe the dimensional characteristics of spaces using
3D-computer modeling. It models the architectural design of the building and generates the skeleton input file for the Superlite and Radiance programs.
• Plink converts models designed in Scribe into a Radiance or Superlite input file. Material
properties such as reflectance, chromaticity and visible transmittance are assigned to surfaces and objects.
• Superlite calculates hourly values of illuminance and daylight factors on any given planes that
describe the space which is being modeled. This program enables the modeling of interior daylight levels for four sky conditions: overcast, clear sky with direct sun, clear sky without sun, and uniform sky. The calculation technique used is based on the radiation flux exchange between surfaces (radiosity method) in which space surfaces are divided into a mesh of small elements and the amount of light distributed from one mesh element to another is calculated. All surfaces are assumed to be perfectly diffuse and the reflectance is assumed to be that of gray surfaces. The program takes into account the variation of the fenestration transmittance with the angle of incidence, the effect of the direct solar radiation and the reflected light component.
• Superlink evaluates the energy savings potential of replacing electric lighting by daylighting
based on typical weather data and hourly sunshine probability. Using three hourly standard sky conditions, the program calculates the illuminance distribution from daylighting on the workplane (using the Superlite module) and compares the illuminance levels at defined reference points with the workplane target illuminance. Subsequently, based on several electric lighting control schemes such as continuous dimming or on/off systems, the program estimates the energy needed from artificial lighting to maintain the workplane target
illuminance. The program also links the Superlite program to energy programs such as DOE or TRNSYS, generating the input (lighting energy that converts in internal heat gains) needed by these programs to calculate the heating and cooling energy.
• Radiance creates a three-dimensional photo-realistic representation of a space and allows for
glare and visual comfort studies. Illuminance values and daylight factors can be obtained as well, but no energy calculations are possible with Adeline 1.0. The program does not simulate electric lighting control systems. Radiance uses the backward ray-tracing technique (the path of light is traced from its presumed destination to other surfaces and light sources to calculate the luminance values needed for visualization of illuminated spaces).
METHODOLOGY
The methodology included two phases: on-site monitoring and computer simulation. The on-site monitoring phase consisted of measurements of indoor illuminance at 30 locations throughout the building, measurements of outdoor illuminance and solar radiation, and monitoring of the electrical lighting system time-of-use. The computer simulation phase consisted in the creation of two computer models (one for Superlite and Superlink, and the other for Radiance) used to model the lighting performance of the atrium building. Measured data from the building were compared with results from the computer simulation runs in order to determine how close the computer
predictions are to the field-monitored values. Description of both phases is provided below.
ON-SITE MONITORING
Measurements of Indoor Illuminance
Horizontal and vertical indoor illuminance measurements were collected manually, at specific locations on each floor, using a hand-held Graseby single-channel photometer model G0352 and
a Graseby 286P illuminance sensor. The photometer had an accuracy of ±0.1%. Measurements
were collected on each floor, at a height of 1.14 meters (3.8 ft) from the floor, at two selected points in each of the north, south, east and west directions to address the daylighting contribution in the corridor, next and away from the atrium. An additional test-point was located in the center of the atrium floor. A total of 25 test-points were selected for measurements. Figure 4 shows the locations of the test-points on each floor. For accuracy of measurements, a wheeled tripod was used to hold the illuminance sensor.
All manual measurements were collected hourly, during daylight hours, for 10 days in June and 6 days in December, 1995. Two sets of measurements were collected during night-time with all lights on and with emergency lighting only. The night-time measurements were used to calculate the real contribution of daylighting to the space, by subtracting the illuminance provided by the electrical lighting (emergency and on/off lighting) from the daytime measured values of illuminance.
Measurements of Indoor Illuminance below the Skylight
Horizontal indoor illuminance measurements were collected at five points just below the atrium skylight using five Graseby 268P illuminance sensors. Figure 5 shows the locations of the
illuminance sensors. Three sensors were uniformly distributed in the center, east and west side of an aluminum I-beam positioned at a height of 14.4 meters (48 ft) above the atrium floor. The remaining sensors were secured at the same height to custom mounts located on the northern and the southern side of the skylight. The I-beam apparatus was built for this experiment only and was removed at the end of the monitoring phase. The sensors were connected to an
eight-channel Graseby C390 photometer with an accuracy of ± 0.2%, connected to a data acquisition
system. Measurements were collected every minute and stored at one-minute and 10-minute averages for the entire month of June, 1995 and for a two-week period in December, 1995.
Measurements of Outdoor Illuminance
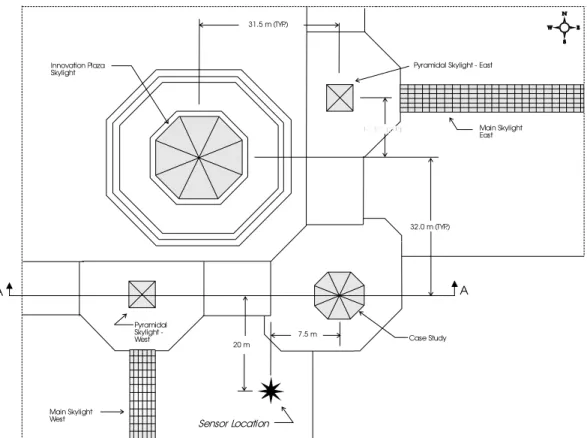
Global and diffuse horizontal outdoor was collected every minute and averaged at 10-minute intervals by a Yankee SDR-1 data acquisition system, connected to three outdoor illuminance sensors (for accuracy purposes), positioned horizontally on the roof, approximately 20 m (66 ft) south of the atrium glazing. From this location, the photosensors were exposed to more than 95% of diffuse sky, and to 100% of direct sunlight. Figures 6 and 7 show a roof plan and a section related to the daylight monitoring station located on the roof. The ideal location for the outdoor monitoring station would have been above the atrium skylight but this was not practical. The station was therefore located so that it could simulate, as close as possible, the outdoor global horizontal illuminance on the top of the skylight.
The following models of photosensors were used:
• one multi-filter rotating shadowband radiometer, model Yankee SDR-1 with an accuracy of ±
3%, to collect global and diffuse horizontal outdoor illuminance;
• one LMT photometric sensor, model BAP with an accuracy of ± 2.2%, to collect global outdoor
illuminance (reference);
• one Licor 210SB photometric sensor with an accuracy of ± 5%, to collect global outdoor
illuminance (reference).
The sky condition at the time of monitoring was also continuously recorded.
Measurements of Outdoor Solar Radiation
Global and diffuse solar radiation was collected outdoors, at 10-minute intervals, with six pyranometers as follows:
• one multi-filter rotating shadowband pyranometer, model Yankee SDR-1 with an accuracy of ±
3%, positioned on the roof at the same location with the illuminance sensors and connected to the same Yankee SDR-1 system mentioned above, to collect global and diffuse solar radiation;
• one Eppley pyranometer Model PSP, positioned on the roof at the same location with the
illuminance sensors and connected to the Yankee SDR-1 system, to collect global solar radiation (reference);
• four pyranometers, Model Licor 200SA with an accuracy of ±5%, secured to the tilted glazing of
the atrium skylight in each of the north, south, east and west directions and connected to a PC-data acquisition system, to collect global radiation falling on each sloped orientation.
32.0 m (TYP.) 31.5 m (TYP.)
Plan View of Sensor Location
Case Study Pyramidal Skylight - East
Pyramidal Skylight -West Innovation Plaza Skylight 20 m 7.5 m Main Skylight East Main Skylight West Sensor Location A A
Figure 6 Plan view of the atrium roof and location of the daylighting monitoring station
4.8 m 4.8 m 4.8 m 1.2 m 1. 1 m 5.4 m 21 m 45 7.3 m 2.3 m 6 m 5 m 2.2 m 9 m 2 m 0.7 m Sensor Location 7.5 m 1.2 m Section A-A Case Study Pyramidal Skylight - West
Innovation Plaza Skylight
Figure 7 Section view through the atrium building and location of the daylighting monitoring station
Measurements of Electrical Lighting Consumption
The time-of-use of the electric lighting system was continually monitored for the entire months of June and December, 1995 by eight CT (current transformer) loggers installed at the breaker panels serving the lighting circuits. The on/off state of the lighting system was monitored for both, emergency lighting and photosensor controlled circuits. Several lighting circuits were also monitored using a BMI Powerprofiler to record voltage, current and power consumption. The circuits monitored were the photocontrolled 150PAR38 corridor lights, the 500PAR56 tilted accent lighting, the continually powered 150PAR38 emergency lighting, the MR75 lamps above the reception desks and the MH175 roofline floodlighting.
Electrical lighting energy consumption was calculated based on measurements, under the following assumptions:
1. The power rating of the lighting fixtures represented the power consumed (this assumption was verified by comparing the theoretical power consumption with the measured power consumption from the BMI Powerprofiler);
2. The wallwash lighting in the ground floor reception area was not included in the calculations; 3. The tilted lamps on the second floor contribute with a proportion of 2/3 to the lighting of the
first floor area, and a proportion of 1/3 to the lighting of the second floor area;
4. The roofline floodlighting was not designed to contribute to the lighting of any floor and was not included in the analysis;
The mean on-time (Mon-time) of the photocontrolled lighting for both monitoring periods was used to
calculate the daily average electric energy consumption (Eave). The following formula was used:
Eave = [(Mon-time x Eon/off) + Eperm] x 24 hours (1) where:
Eon/off - represents the total power consumed by the photocontrolled lighting fixtures;
Eperm - represents the total power consumed by the emergency lighting and the tasklighting above
the reception counters on the ground floor.
COMPUTER SIMULATION
Superlite Simulation Model
Due to the limitations of the Superlite program, this computer model simulates a central pyramidal atrium within a quadrilateral shaped building. However, parameters such as area of fenestration, reflectance and transmittance of construction materials, and orientation of surfaces, were kept similar to the real ones. The model also contains information about the site-measured visible transmittance of the fenestration, calculated by dividing the average horizontal illuminance recorded by the five photosensors installed bellow the atrium skylight to the corresponding outdoor global horizontal illuminance. Table 3 shows the range of measured visible transmittance based on season and sky condition. An average transmittance of 28% was used in the
simulation.
Table 3 On-site monitored skylight visible transmittance
Month Overcast Clear sky Partly cloudy
June 1995 26-34% 18-41% 21-37%
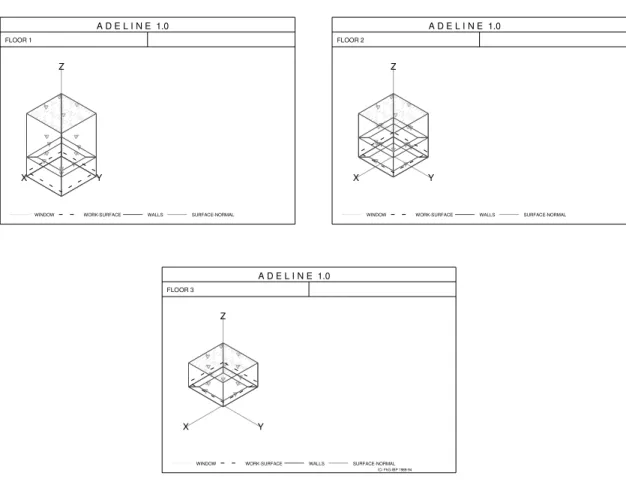
Limitations of the software did not allow for the model even simplified like that to be studied as a whole and therefore the floors of the atrium building were simulated separately. This obviously eliminated from the calculations the interreflections between floors. Figure 8 shows the three floors as simulated by Superlite.
A D E L I N E 1.0
FLOOR 1
X Y
Z
WINDOW WORK-SURFACE WALLS SURFACE-NORMAL
A D E L I N E 1.0
FLOOR 2
X Y
Z
WINDOW WORK-SURFACE WALLS SURFACE-NORMAL
A D E L I N E 1.0
FLOOR 3
(C) FhG-IBP 1989-94
X Y
Z
WINDOW WORK-SURFACE WALLS SURFACE-NORMAL
Figure 8 Superlite simulation model - Atrium 1st, 2nd, and 3rd Floors
The on-site measured illuminance was compared with simulation results. The test-points where the field measured horizontal illuminance was recorded were shown previously in Figures 4 and 5. On all three floors comparison was done only for the test-points located at the atrium perimeter (locations N1, E1, S1, W1 and C). Taking into account the changes made in the shape of the simulated building model, these locations were assumed to correspond to the points shown in Figure 9 [North (N) = 47, South (S) = 53, East (E) = 14, West (W) = 86, Center (C) = 50].
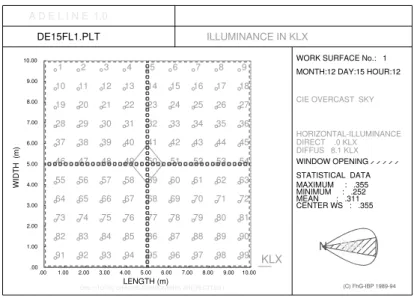
A D E L I N E 1.0 DE15FL1.PLT
ONLY TOTAL DIFFUSE COMPONENTS ARE PLOTTED ! .00 1.00 2.00 3.00 4.00 5.00 6.00 7.00 8.00 9.00 10.00 .00 1.00 2.00 3.00 4.00 5.00 6.00 7.00 8.00 9.00 10.00 LENGTH (m) W ID T H ( m ) 1 2 3 4 5 6 7 8 9 10 11 12 13 14 15 16 17 18 19 20 21 22 23 24 25 26 27 28 29 30 31 32 33 34 35 36 37 38 39 40 41 42 43 44 45 46 47 48 49 50 51 52 53 54 55 56 57 58 59 60 61 62 63 64 65 66 67 68 69 70 71 72 73 74 75 76 77 78 79 80 81 82 83 84 85 86 87 88 89 90 91 92 93 94 95 96 97 98 99 KLX ILLUMINANCE IN KLX
WORK SURFACE No.: 1 MONTH:12 DAY:15 HOUR:12
WINDOW OPENING STATISTICAL DATA MAXIMUM : .355 MINIMUM : .252 MEAN : .311 CENTER WS : .355 N SUN
CIE OVERCAST SKY
HORIZONTAL-ILLUMINANCE DIRECT .0 KLX
DIFFUS 8.1 KLX
(C) FhG-IBP 1989-94
Figure 9 Layout of test-points on the simulated horizontal plane where comparisons between measured and simulated data were performed
Superlink Simulation Model
The Superlite model described above was used to evaluate the energy savings potential of replacing electric lighting with daylighting. Due to computer program limitations, which do not permit the simultaneous simulation of two types of lighting systems (continually powered lighting and daylight-controlled lighting), the following assumptions were made:
• target illuminance was calculated based on field measurements of illuminance collected
manually, at night-time, under “full electric lighting” and “emergency lighting only” conditions. The average illuminance measured under “full electric lighting” was about 350 lux. The average illuminance measured under “emergency lighting only” conditions was about 100 lux. The difference between these two illuminance values was assumed to be the design illuminance of the daylight-linked electrical lighting system, in this case 250 lux.
• electric lighting is controlled on each floor by photosensors located at reference points at the
workplane level. The photosensors compare the light level at the reference points with the target illuminance level. The available daylight must be equal or greater than the target illuminance for the natural light to replace artificial light.
• all calculations were done based on hourly sunshine probability data for the city of Ottawa,
created within Adeline using "typical meteorological year" weather files for energy calculations provided by Environment Canada
The accuracy of the computer program in simulating the energy savings from the use of the existing on/off lighting control system was verified. The measured time-of-use of the
photocontrolled lighting system was compared to the simulated time-of-use for the months of June and December 1995. The mean daily off-time of the photocontrolled lighting was used to calculate the average daily savings of electrical lighting energy.
Radiance Simulation Model
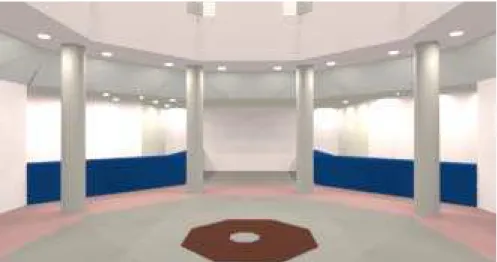
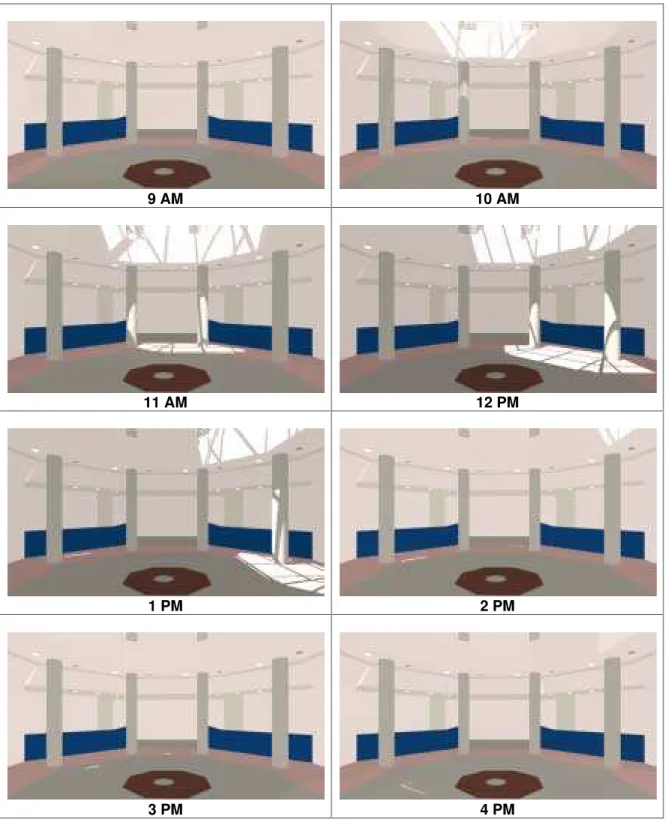
This computer model creates a three-dimensional visual representation of the atrium building and generates information about the lighting within the building under a given electric or daylighting illumination system. The input model describes the shape, size, location and composition of each surface and predicts the distribution of visible radiation in the illuminated space. Figures 10 to 12 are typical examples of the Radiance computer model during night-time.
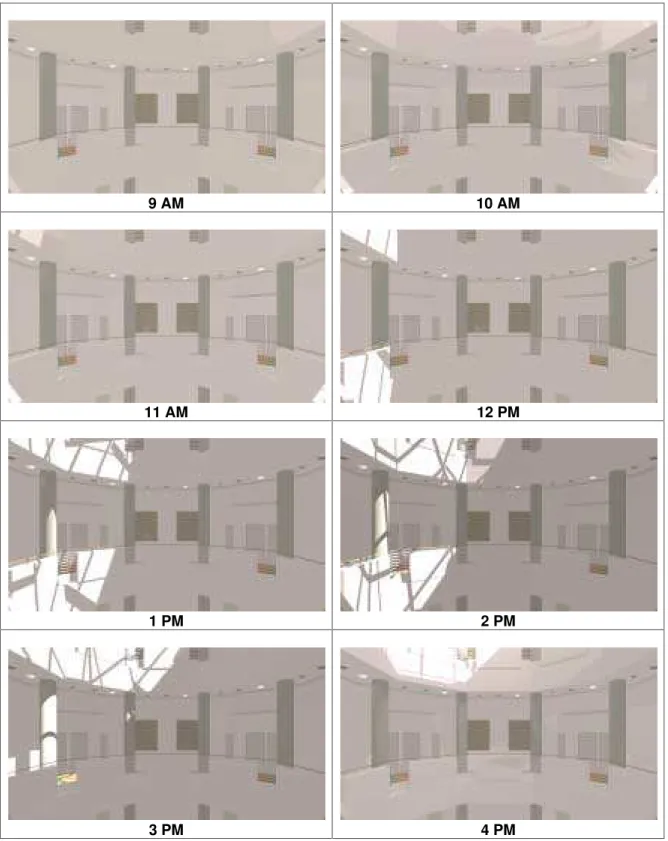
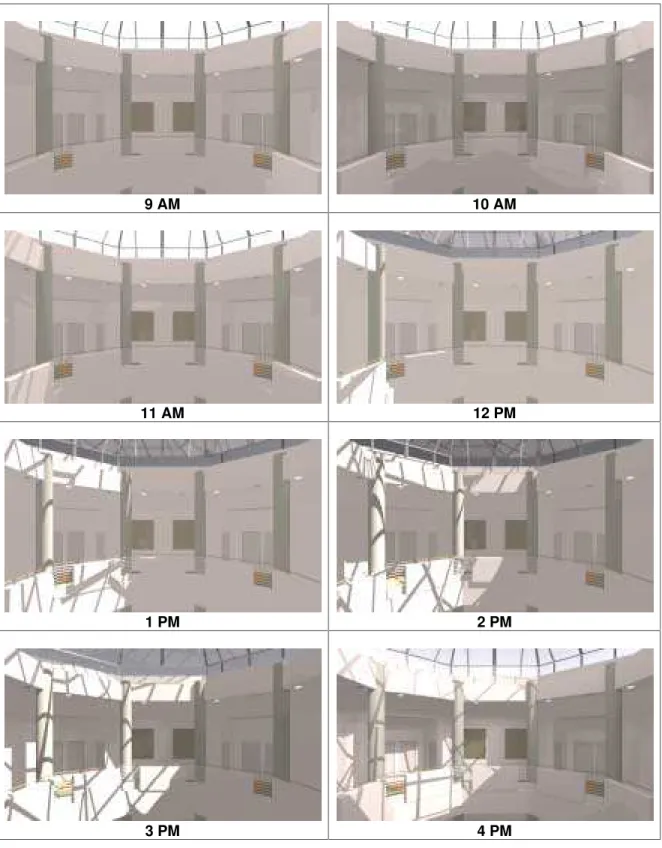
The model’s accuracy was verified for daytime only. Measured illuminance was compared with simulated illuminance at the test-points shown in Figures 4 and 5. Data on the actual sky condition, on-site measured direct and diffuse solar radiation, and on-site measured visible transmittance of the skylight were used as simulation input. The atrium skylight was described in the simulation as a compound unit with an average visible transmittance of 28%, rather than a unit composed of three different glazing systems.
Figure 10 Radiance simulation model - Atrium 1st Floor (night time, north-west view)
Figure 11 Radiance simulation model - Atrium 2nd Floor (night time, south-east view)
RESULTS
The results presented below are directed towards the analysis of the degree of accuracy of the Adeline 1.0 software when applied for real buildings with complex geometry. As stated before, they are intended to present the degree of accuracy and the limitations that could be expected when predicting specific light parameters in atria with real occupancy and when using the software as a design tool for such complex daylighting systems. Therefore, instead of comparing measured and simulated instantaneous illuminance levels based on time of day and test-point location, the analysis will be directed more towards investigating the overall pattern distribution and range of predicted illuminance levels in the space and the impact they might have on the long-term lighting energy calculations. The comparison results will be presented individually for Superlite, Superlink and Radiance.
COMPARISON BETWEEN MEASURED AND SIMULATED DATA USING THE SUPERLITE MODEL
This section presents the results of the Superlite computer model analysis.
Comparison between Measured and Simulated Outdoor Illuminance for June 1995
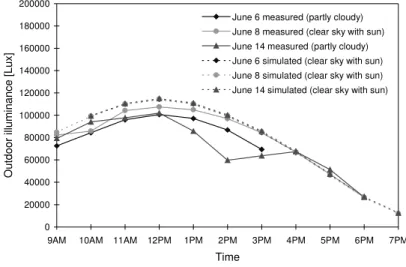
Three summer days were selected for comparison: June 6, June 8, June 14, 1995. The sky was partly cloudy on June 6 and June 14, and clear on June 8. Due to software limitations, the sky was simulated as clear sky for both partly cloudy days. Figure 13 shows a comparison between the computer-predicted outdoor illuminance and the field-measured horizontal outdoor
illuminance. Measured illuminance was shifted one hour behind the local time when the measurements were collected to compensate for the daylight-savings time. As shown, for all three days the simulated illuminance followed closely the distribution pattern of the measured illuminance, and this was especially true for June 8, which was a completely clear sunny day. From 9 AM to 6 PM, the instantaneous discrepancy between measured and simulated illuminance at any particular time of the day was between 1 and 25%, and the average deviation was about 10%. For June 8, the discrepancy was even lower, being between 1 and 16% and averaging a very low 4%. It is interesting to notice that for all the three summer days analyzed, the profiles of the computer-predicted outdoor illuminance overlap.
0 20000 40000 60000 80000 100000 120000 140000 160000 180000 200000
9AM 10AM 11AM 12PM 1PM 2PM 3PM 4PM 5PM 6PM 7PM Time
Outdoor
illuminance [Lux]
June 6 measured (partly cloudy) June 8 measured (clear sky with sun) June 14 measured (partly cloudy) June 6 simulated (clear sky with sun) June 8 simulated (clear sky with sun) June 14 simulated (clear sky with sun)
Figure 13 Measured and Superlite simulated horizontal outdoor illuminance for June 6, June 8 and June 14, 1995.
Comparison between Measured and Simulated Indoor Illuminance for June 1995
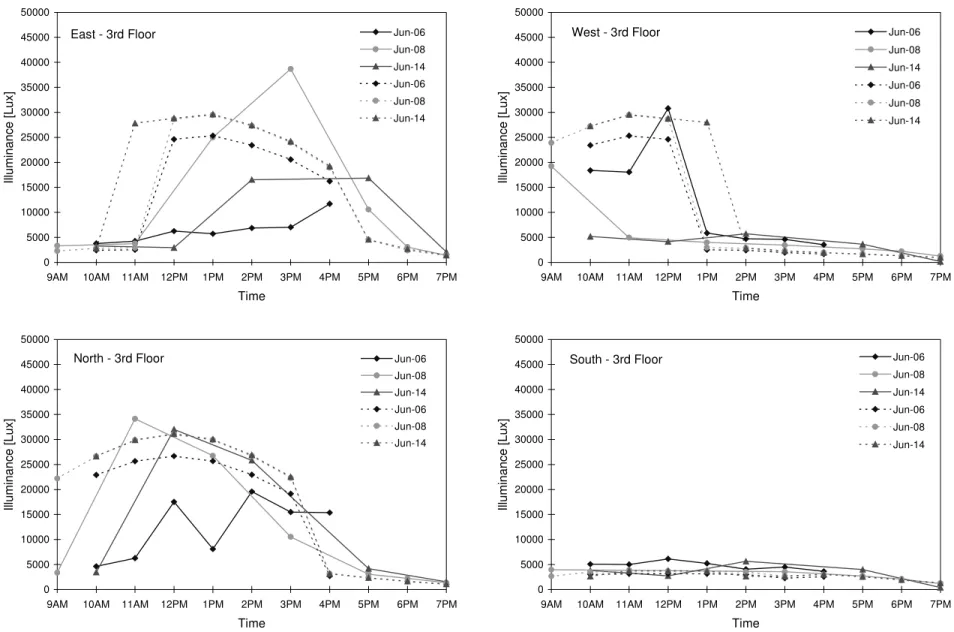
Figures 14 through 17 show the measured and the computer-predicted indoor horizontal illuminance at the east, west, north and south test-points on each floor and below the skylight. Figure 18 shows the measured and the simulated indoor illuminance in the center of the atrium floor, and the center test-point below the skylight. In all the following Figures, the continuous illuminance profiles represent measured values, and the dotted ones represent simulated values. All plots account for the daylight-savings time.
On the atrium ground floor, at all the five investigated test-points, the simulated illuminance pattern followed closely the distribution pattern of measured illuminance. As shown in Table 4, on all three clear sky summer days, the illuminance measured on this floor from 9 AM to 5 PM varied between 400 lux and 29300 lux and the simulated illuminance ranged from 600 lux to 28700 lux. At the test-point located in the center of the atrium ground floor, during the same period of time, the measured illuminance ranged from 1000 to 3700 lux and the simulated illuminance was between 700 and 2700 lux.
Table 4 Measured versus Superlite simulated indoor horizontal illuminance for June 6, June 8 and June 14, 1995 (Lux)
Atrium perimeter (clear sky) Measured illuminance Simulated illuminance Ground floor 400-29300 600-28700 Second floor 700-48400 1000-29700 Third floor 2700-38700 1700-31200 Base of skylight 6500-54800 3300-32800
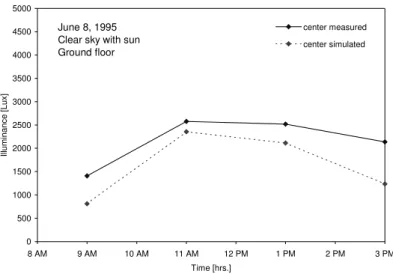
On the second and third floors of the atrium space, as well as at the base of the atrium skylight, the simulated illuminance followed also closely the trend of measured illuminance. The only major pattern discrepancy occurred at the eastern test-point of the second floor, simulated to be under direct sun from 12 PM until 3 PM. In reality, on all three days no measurements were taken under direct sun at this location. This is probably due to the deviation of the computer model input from the actual building geometry, allowing the interior space to see more direct sun than in reality. A reasonably low discrepancy between measured and simulated illuminance was found at the center test-point just below the skylight where from 9 AM to 5 PM, the measured illuminance was
between 10500 and 36800 lux and the simulated illuminance ranged from 13100 to 32800 lux (Figure 18). The minimum illuminance recorded at this location at 11 AM, as well as the peak recorded at 5 PM, are probably due to the fact that the sun patterns at these test-points under measurement and simulation were not identical.
Despite an overall good agreement between the trends and the ranges between measured and simulated values, there were however situations when, at certain hours and locations, the
simulated illuminance was 3 to 10 times lower or higher than the instantaneous measured values. This was expected due to Superlite’s limitations in simulating the geometry of the real space. First, the three glazing systems that form the skylight and which affect greatly the way daylight is admitted into the building, were accounted for as one overall transmittance. The substitution of a pyramidal-shaped skylight to represent the real octagonal-shaped skylight altered also the skylight visible transmittance. Second, the fact that the three floors of the building were treated separately eliminated the interreflections between space surfaces. In addition, on all three floors, the
measurements were collected manually due to the impractical installation of a fixed measuring system on each floor and, occasionally, the time of day when they were recorded did not always
correspond perfectly with the simulated time. This evidently has also increased the instantaneous discrepancy between measured and simulated values.
It is noteworthy to mention that for all three summer days analyzed the predicted illuminance distributions were very similar from 9 AM to 7 PM. At all test-points, the profiles of simulated illuminance depended only on the test-point location and did not vary significantly from one day to another. At each test-point, the only difference between the illuminance predicted for these three days consisted in a 2 to 15% variation of absolute illuminance values. However, considering the difficulty of simulating the daylight availability in buildings with real occupancy and complex geometry, summer data shows a fairly good overall agreement between measured and simulated illuminance, in both range and distribution pattern. The occasional high discrepancy between measured and simulated instantaneous illuminance does not appear to impact significantly on the long-term energy calculations subsequently done by Superlink, since at all test-points, from 9 AM to 5 PM, both the measured and the simulated illuminance were much above any reasonable target illuminance that might be considered for the analyzed space.
0 1000 2000 3000 4000 5000 6000 7000 8000 9000 10000
9AM 10AM 11AM 12PM 1PM 2PM 3PM 4PM 5PM 6PM 7PM
Time Illuminance [Lux] Jun-06 Jun-08 Jun-14 Jun-06 Jun-08 Jun-14 East - 1st Floor 0 1000 2000 3000 4000 5000 6000 7000 8000 9000 10000
9AM 10AM 11AM 12PM 1PM 2PM 3PM 4PM 5PM 6PM 7PM
Time Illuminance [Lux] Jun-06 Jun-08 Jun-14 Jun-06 Jun-08 Jun-14 West - 1st Floor 0 1000 2000 3000 4000 5000 6000 7000 8000 9000 10000
9AM 10AM 11AM 12PM 1PM 2PM 3PM 4PM 5PM 6PM 7PM
Time Illuminance [Lux] Jun-06 Jun-08 Jun-14 Jun-06 Jun-08 Jun-14 North - 1st Floor 0 1000 2000 3000 4000 5000 6000 7000 8000 9000 10000
9AM 10AM 11AM 12PM 1PM 2PM 3PM 4PM 5PM 6PM 7PM
Time Illuminance [Lux] Jun-06 Jun-08 Jun-14 Jun-06 Jun-08 Jun-14 South - 1st Floor
Figure 14 Measured and Superlite simulated indoor horizontal illuminance for June 6, June 8 and June 14, 1995 - 1st Floor - east, west, north and south test-points.
0 3000 6000 9000 12000 15000 18000 21000 24000 27000 30000
9AM 10AM 11AM 12PM 1PM 2PM 3PM 4PM 5PM 6PM 7PM
Time Illuminance [Lux] Jun-06 Jun-08 Jun-14 Jun-06 Jun-08 Jun-14 East - 2nd Floor 0 3000 6000 9000 12000 15000 18000 21000 24000 27000 30000
9AM 10AM 11AM 12PM 1PM 2PM 3PM 4PM 5PM 6PM 7PM
Time Illuminance [Lux] Jun-06 Jun-08 Jun-14 Jun-06 Jun-08 Jun-14 West - 2nd Floor 0 3000 6000 9000 12000 15000 18000 21000 24000 27000 30000
9AM 10AM 11AM 12PM 1PM 2PM 3PM 4PM 5PM 6PM 7PM
Time Illuminance [Lux] Jun-06 Jun-08 Jun-14 Jun-06 Jun-08 Jun-14 North- 2nd Floor 0 3000 6000 9000 12000 15000 18000 21000 24000 27000 30000
9AM 10AM 11AM 12PM 1PM 2PM 3PM 4PM 5PM 6PM 7PM
Time Illuminance [Lux] Jun-06 Jun-08 Jun-14 Jun-06 Jun-08 Jun-14 South - 2nd Floor
Figure 15 Measured and Superlite simulated indoor horizontal illuminance for June 6, June 8 and June 14, 1995 - 2nd Floor - east, west, north and south test-points.
0 5000 10000 15000 20000 25000 30000 35000 40000 45000 50000
9AM 10AM 11AM 12PM 1PM 2PM 3PM 4PM 5PM 6PM 7PM
Time Illuminance [Lux] Jun-06 Jun-08 Jun-14 Jun-06 Jun-08 Jun-14 East - 3rd Floor 0 5000 10000 15000 20000 25000 30000 35000 40000 45000 50000
9AM 10AM 11AM 12PM 1PM 2PM 3PM 4PM 5PM 6PM 7PM
Time Illuminance [Lux] Jun-06 Jun-08 Jun-14 Jun-06 Jun-08 Jun-14 West - 3rd Floor 0 5000 10000 15000 20000 25000 30000 35000 40000 45000 50000
9AM 10AM 11AM 12PM 1PM 2PM 3PM 4PM 5PM 6PM 7PM
Time Illuminance [Lux] Jun-06 Jun-08 Jun-14 Jun-06 Jun-08 Jun-14 North - 3rd Floor 0 5000 10000 15000 20000 25000 30000 35000 40000 45000 50000
9AM 10AM 11AM 12PM 1PM 2PM 3PM 4PM 5PM 6PM 7PM
Time Illuminance [Lux] Jun-06 Jun-08 Jun-14 Jun-06 Jun-08 Jun-14 South - 3rd Floor
Figure 16 Measured and Superlite simulated indoor horizontal illuminance for June 6, June 8 and June 14, 1995 - 3rd Floor - east, west, north and south test-points.
0 10000 20000 30000 40000 50000 60000 70000 80000
9AM 10AM 11AM 12PM 1PM 2PM 3PM 4PM 5PM 6PM 7PM
Time Illuminance [Lux] Jun-06 Jun-08 Jun-14 Jun-06 Jun-08 Jun-14 East
Base of atrium skylight
0 10000 20000 30000 40000 50000 60000 70000 80000
9AM 10AM 11AM 12PM 1PM 2PM 3PM 4PM 5PM 6PM 7PM
Time Illuminance [Lux] Jun-06 Jun-08 Jun-14 Jun-06 Jun-08 Jun-14 West
Base of atrium skylight
0 10000 20000 30000 40000 50000 60000 70000 80000
9AM 10AM 11AM 12PM 1PM 2PM 3PM 4PM 5PM 6PM 7PM
Time Illuminance [Lux] Jun-06 Jun-08 Jun-14 Jun-06 Jun-08 Jun-14 North
Base of atrium skylight
0 10000 20000 30000 40000 50000 60000 70000 80000
9AM 10AM 11AM 12PM 1PM 2PM 3PM 4PM 5PM 6PM 7PM
Time Illuminance [Lux] Jun-06 Jun-08 Jun-14 Jun-06 Jun-08 Jun-14 South
Base of atrium skylight
Figure 17 Measured and Superlite simulated indoor horizontal illuminance for June 6, June 8 and June 14, 1995 - east, west, north and south test-points at base of skylight.
0 1000 2000 3000 4000 5000 6000 7000 8000 9000 10000
9AM 10AM 11AM 12PM 1PM 2PM 3PM 4PM 5PM 6PM 7PM
Time Illum inance [Lux] Jun-06 Jun-08 Jun-14 Jun-06 Jun-08 Jun-14 Center - 1st Floor 0 10000 20000 30000 40000 50000 60000 70000 80000
9AM 10AM 11AM 12PM 1PM 2PM 3PM 4PM 5PM 6PM 7PM
Time
Illum
inanc
e [Lux
]
Jun-06 Jun-08 Jun-14 Jun-06 Jun-08 Jun-14Center
Base of atrium skylight
Figure 18 Measured and Superlite simulated indoor horizontal illuminance for June 6, June 8 and June 14, 1995 - Center of atrium ground floor and base of skylight
Comparison between Measured and Simulated Outdoor Illuminance for December 1995
Three days in December 1995 were selected for the analysis. Comparisons were done on an hourly-basis for December 4, December 8 and December 15, 1995. The sky was overcast on December 4 and December 15, and clear with sun on December 8.
Figure 19 shows with dotted lines the computer-predicted, and with continuous lines the field measured outdoor horizontal illuminance. Under clear sky, the absolute discrepancy between measured and simulated values was between 12 and 29%. From 9 AM to 3 PM, the outdoor illuminance under clear sky ranged from 18000 to 41000 lux and the simulated illuminance was between 14000 to 34000 lux. A greater difference occurred in the simulation of overcast sky, for which the difference ranged from 47 to 76%. In this case from 9 AM to 3 PM, the measured outdoor illuminance varied between 7000 and 26000 lux and the simulated illuminance was between 4000 and 8500 lux. Under both sky conditions, the measured and the simulated illuminance followed similar distribution patterns, but the outdoor illuminance was mostly
underpredicted, especially under overcast sky. The peak shown at 2 PM on December 4 was due to frequent changes in sky condition recorded on this particular day. This will also reflect in the indoor illuminance profiles presented further in the report.
0 20000 40000 60000 80000 100000 120000 8 AM 9 AM 10 AM 11 AM 12 PM 1 PM 2 PM 3 PM 4 PM Time Ill umi nanc e [Lux ]
Dec 4 measured (overcast) Dec 8 measured (clear sky with sun) Dec 15 measured (overcast) Dec 4 simulated (overcast) Dec 8 simulated (clear sky with sun) Dec 15 simulated (overcast)
Figure 19 Measured and Superlite simulated outdoor horizontal illuminance for December 4, December 8 and December 15, 1995.
Comparison between Measured and Simulated Indoor Illuminance for December 1995
Figures 20 through 23 show the measured and the computer-predicted indoor horizontal
illuminance for the east, west, north and south test-points, on each floor of the building and below the skylight. Figure 24 shows the measured and the simulated indoor illuminance in the center of the atrium floor, and the center test-point below the skylight. For all three winter days, from 9 AM to 3 PM, the measured indoor illuminance mostly exceeded the predicted illuminance with sometimes up to twice or three times the simulated values, regardless of the sky condition. Under clear sky, from 9 AM to 3 PM , the illuminance in the center of the atrium ground floor varied between 400 and 1000 lux, while the predicted illuminance was between 300 and 500 lux, resulting in an underpredicted maximum space illuminance of 50% the measured value. Under overcast sky in the center of the atrium ground floor, the measured illuminance was between 150