HAL Id: hal-01743892
https://hal.insa-toulouse.fr/hal-01743892
Submitted on 26 Mar 2018HAL is a multi-disciplinary open access archive for the deposit and dissemination of sci-entific research documents, whether they are pub-lished or not. The documents may come from teaching and research institutions in France or abroad, or from public or private research centers.
L’archive ouverte pluridisciplinaire HAL, est destinée au dépôt et à la diffusion de documents scientifiques de niveau recherche, publiés ou non, émanant des établissements d’enseignement et de recherche français ou étrangers, des laboratoires publics ou privés.
Influence of the MASONRY VAULTS building process
on their stiffness: Numerical analysis using a
homogenised DAMAGE MODEL including mortar joint
shrinkage and induced crack re-closure effect
Thomas Stablon, Alain Sellier, Nathalie Domede, Bernard Plu, Luc Dieleman
To cite this version:
Thomas Stablon, Alain Sellier, Nathalie Domede, Bernard Plu, Luc Dieleman. Influence of the MA-SONRY VAULTS building process on their stiffness: Numerical analysis using a homogenised DAM-AGE MODEL including mortar joint shrinkage and induced crack re-closure effect. Materials and Structures, Springer Verlag, 2012, 45 (6), pp.881-898. �10.1617/s11527-011-9805-y�. �hal-01743892�
Influence of the MASONRY VAULTS building process on their stiffness:
Numerical analysis using a homogenised DAMAGE MODEL including mortar joint
shrinkage and induced crack re-closure effect
Thomas STABLON, Alain SELLIER, Nathalie DOMEDE
Université de Toulouse ; UPS, INSA ; LMDC (Laboratoire Matériaux et Durabilité des Constructions) ; 135, avenue de Rangueil ; F-31 077 Toulouse Cedex 04, France
Bernard PLU, Luc DIELEMAN, SNCF, 6 avenue François Mitterrand, 93574 La Plaine Saint Denis, France
ABSTRACT
The assessment of masonry structures is more and more useful to characterize the behaviour of masonry walls, tower and bridges. The owner of these constructions would like to understand the mechanical performance of their structures. Experiments and computational methods are two essential elements to accurately study and determine the sensitive points of the edifices. This paper presents the numerical modelling of a vault in undamaged and damaged domain with a macro-homogenisation analysis. The importance of considering the building phases in order to determine the actual stiffness of the structure is highlighted. The numerical tool is a continuous finite element model based on an original anisotropic damage model considering the masonry as a homogenised continuous media. The model is implemented in a massive finite element for three dimensional formulation. It computes the localized damage and allows indicating zones of privileged crack opening in the structure. It is able to predict the cracking zones in large masonry constructions without pre-positioning joint elements. It uses a regularization method ensuring an independence of the numerical response from the mesh. The model includes also a re-closure function for cracks. This re-re-closure function allows simulating the progressive stiffness restitution during the crack re-closure process. The paper focuses on this aspect in relation with the crack induced by restrained shrinkage of joint mortar during the building history. First, a state of the arts is proposed, then the damage model is presented. In order to validate the model and to propose a global methodology, the damage model is applied to analyse a thin masonry vault previously tested in a laboratory. The numerical results are discussed regarding the experimental ones.
KEYWORDS: Masonry arch bridge, FEM, damage theory, smeared crack model, localized cracks, crack re-closure, shrinkage, mortar, bricks, homogenisation techniques.
INTRODUCTION
Masonry is widely used in the construction field for its simplicity to assemble and durability over the time. Because of the large number of masonry structures, understand the masonry behaviour is more and more a necessity. Assessment of existing structures and design of new construction need efficient and reliable models. The aim of this research, in association with the SNCF, the French railway company, is to develop a methodology and a numerical tool in order to analyze large masonry structure as bridges, towers and buildings. A review of the state of the arts is presented in section 1 and then the proposed numerical damage model, implemented in a finite element code is presented. The damage model has been adapted to study large masonry structures without resorting to a refined mesh or pre-propositioned joint
elements. The model uses homogenized mechanical characteristics of the masonry and involves a module to treat localized crack opening and their progressive re-closure. In section 2, the damage model is precisely examined. In this model, an original method combines the localization and the anisotropic size of the finite elements and allows the determination of localized cracks independently from the mesh. In section 3, a case study is examined. This analysis is performed on a masonry thin vault subjected to a point load proposed by Sanchez (Sanchez, 2007). In this section it is shown that, to obtain a realistic stiffness of the masonry vault, the damage model has to be applied to the structure during its whole history. In fact, in this application, the homogenised elastic parameters obtained with the linear homogenisation theory become compatible with experimental observations only if building phases are taken into account. The building phases cover boundary conditions, mortar shrinkage and dead load application before applying the testing loads.
STATE OF THE ART
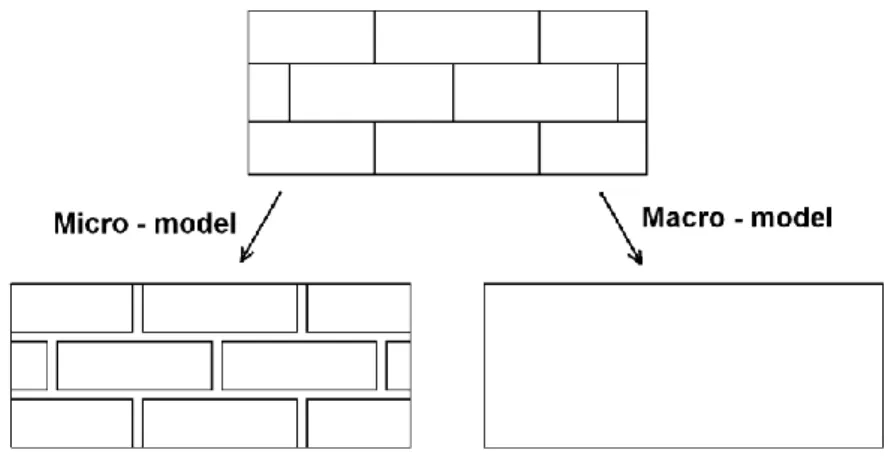
Depending on the structure size and the required precision, the investigation of masonry structures may rely on different numerical tools. Several kinds of models exist and considering the scale, different approaches can be used. Lourenço, in his thesis, (Lourenço, 1996) and Papa (Papa, 2001) described the different methods to analyze the masonry behaviour. Depending on the needed accuracy and the time allowed to calculation, the masonry structure can be treated at a micro-scale or a macro-scale (Figure 1).
Figure 1: Micro and macro model to describe the masonry
Micro-modelling consists on the precise description of every constituents of the masonry (bricks, joints and interfaces) and their interaction. The masonry can be, theoretically, perfectly described and the results very accurate. This method is used to precisely understand the behaviour of small representative elementary volume of masonry. This fact limits this approach to the analysis of small structures such as laboratory specimens in order to understand the detailed behaviour of masonry.
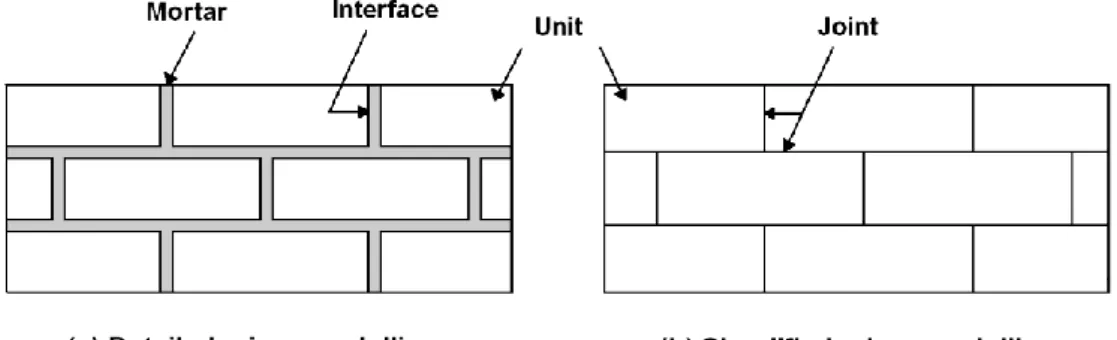
In the micro-modelling approach, units, mortar and interface are considered individually. Each material is differentiated with its own constitutive law. The blocks (bricks or stones) can be characterized with a simple elastic behaviour law (Page, 1978) but also with a very accurate damage law (Reyes et al., 2009). The mortar can be regarded as a joint continuum media with discontinuous interface elements, it is called the detailed micro-modelling (Figure 2 - a). Another way to describe the joint is to consider directly the mortar as a discontinuous element (Sutcliffe et al., 2001, Cruz Diaz et al. 2002), it is the simplified micro-modelling (Figure 2 - b). In both cases, the bricks and the mortar are modelled. With the micro-micro-modelling, the cracks can develop in the interfaces illustrating the fact that these interfaces are generally the weakest part in the masonry.
Figure 2: Detailed and simplified micro-modelling
One of the first users of the micro-modelling concept in the masonry field is Page (Page, 1978). He considered the masonry composed of blocks as elastic elements linked with interface elements. Later, Rahman (Rahman, 1994) analyzed laboratory specimens until failure with the micro-modelling method using a Mohr Coulomb failure criterion for the interfaces. Lourenço (Lourenço, 2004) also used a Coulomb failure criterion for the interfaces between bricks and modeled them with inelastic behaviour and a surface roughness parameter, to investigate dry masonry with a micro-modelling approach. In both cases, the aim is to represent the behaviour of the interface between the unit and the mortar. Lourenço (Lourenço, 1997), in his model, considered the blocks as elements and the joints as interface elements. The interfaces were considered as zero thickness and allowed the cracks to develop. This approach leads to different types of failure: crack development in the joint, crack in the blocks in tension, sliding along the joint and crack in the blocks due to mortar dilatancy. Based on the plasticity theory, this model was improved by using two yield surfaces (unloading surfaces) in order to model cyclic loading in tension and compression (Oliveira, 2004) and for rubble masonry (Senthivel, 2009). Colliat and Davenne (Colliat & al., 2002) worked on the mechanical behaviour of masonry walls submitted to in-plane loading. They modelled individually mortar joints and bricks. The crushing of the blocks was taking into account and the joints were modelled with a perfect plastic behaviour with mortar dilatancy. From experimental characteristics of each component, they obtained both the stiffness and the maximum load capacity of two experimental walls.
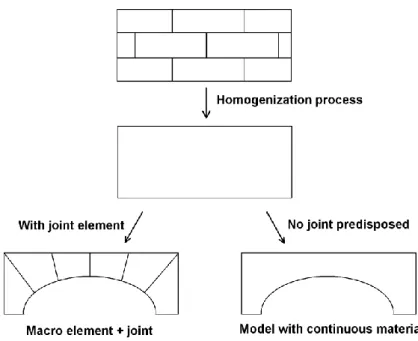
The downside of the micro analysis approach is that the numerical micro-modelling method is often a huge time consuming analysis. Larger is the structure, much longer is the model preparation duration and the numerical micro-modelling time calculation. For large masonry structures, it is necessary to use a macro analysis where masonry structure is considered as a unique material with homogenized properties (Figure 3). A macro model is a good agreement between result accuracy and numerical time consummation to analyze large masonry structures and approximate accurately the deformations at low stress levels (Ghosh et al., 1994). Few researchers worked on this field in order to understand the whole behaviour of full-size masonry structures such as walls (Berto et al. 2004), buildings, bridges (Domède, 2006), towers (Bayraktar, 2009).
Figure 3: Macro models with or without joint elements
Fanning (Fanning, 2001) employed a commercial 3D model (Ansys) with a non linear damage model for the analysis of 3 bridges in Ireland and in the US. He separated the bridges in 3 parts: the masonry, the fill and the interface between them. The masonry was modelled with an existing smeared crack model in Ansys which modify the stiffness of material when cracking appears. For the fill, a Drucker-Prager material was used and the interfaces were modelled as frictional contact surfaces. The bridges are examined under service loads. Frunzio (Frunzio, 2001) exploited also the commercial 3D finite element code Ansys to study a Roman stone arch bridge. He divided the structure in 4 parts: the vault, the spandrel walls, the fill (roughly a concrete) and the foundations. He chose to apply for all materials a Drucker-Prager criterion and the elastic modulus is calculated with the homogenization process proposed by Aboudi (Aboudi, 1991). He noticed that the result is highly dependent on the material parameters, hard to evaluate in most of the cases. Domede (Domede, 2006) analyzed in 3D a railway bridge using macro elements with homogenized behaviour laws associated with joint elements (Coulomb criterion). The vault, the ring stone, the spandrel walls and the fill were differentiated with their own specific characteristics. Three different homogenized behaviour laws were compared: elastic-plastic with a Von Mises criterion, damage model from Mazars, elastic-plastic with a Drucker-Prager criterion. In order to open cracks, numerical joint elements, able to open and slide, were positioned in the structure. Recently, a XI century Chinese Pagoda was modelled (Abruzzese, 2009) using simply homogenised mechanical material properties obtained by experimental tests. The mechanical model was a very simple linear elastic behaviour considering no tensile stress. The tower has a 6.5° inclination and the analysis was conducted under dead load in order to assess the static risk. Lately, Bayraktar (Bayraktar, 2009) applied a non linear 3D finite element model to a bell tower in Turkey. He submitted numerically the tower to dead and wind loads in static analysis but also to a dynamic analysis to reproduce a 1992 earthquake. The model was a damage model where cracking and crushing were examined. He obtained the damage evolution and the crack distribution and compared the numerical results to the real crack pattern on the structure. The results of the damage analysis correspond to the actual crack pattern of the structure. For Massart (Massart, 2004), the “assumption of fixed damage principal directions and orthotropic damage used in most macroscopic damage models is not acceptable because full anisotropy plays an important role for many relevant loading directions”. So a rotating crack model can be a good way to describe the full anisotropy of the material.
The macro-approach allows understanding the structural mechanisms of large masonry structures. The joint elements lead the cracks to develop in a predisposed zone of the structure. The cracks will follow a non natural path. On the contrary, with the association of a smeared crack model and a continuous material in the structure, the crack can develop in a natural and non predisposed path. The crack will
develop in the zones where stresses are excessive comparing to a specified criterion. The global aim of our research is to analyze large masonry structures as bridges and buildings. So the model we developed is a macro-model considering a homogenized continuum material and using controlled crack energy. It uses a particular independence from the mesh. The proposed model pays also a particular attention to the crack re-closing modelling, which can have, as illustrated hereafter, a major influence on the masonry stiffness. So it can be a way to conciliate homogenization theories and experimental results.
The damage model
The damage model used is an orthotropic based one. It is a variant of the initial model described in details by Sellier (Sellier & al., 2002) and completed recently (Sellier & al. 2010) to consider crack re-closure possibility. This presentation is done adopting the 6 dimensions vector representation of the classical
3
3 symmetric tensors.
First, an effective stress ~ is computed (equation 1) according to the strain , using stiffness matrix
0
S of the homogenised healthy material (un-cracked): (1) ~ S0.
The effective stress is split in tension t
~ and compression~c
, according to the sign of the main stress. The positive part is used in Rankine criteria (maximal stress criteria - Equation 2-a) to assess the tensile damage tensor Dt. The negative part of the effective stress is used to assess a Drucker-Prager equivalent stress (equation 2-b) which will be used to assess the compressive damage tensorDc:
(2-a) sup
sup
~ ~It
0 R I I R I R f f (2-b) 0 3 6 ~ 2 1 J I f d DP DP With J2d the second invariant of the deviator of c
~ , 1
I the trace of c
~ and the Drucker-Prager
constant, describing the sensitivity of the material to the containment. It depends on the internal friction angle (Equation 3). The multi criterion is illustrated in Figure 4 for a cut in the plane III 0 when the
maximal strength in tension ( t
R ) or in compression (R ) are reached. c (3) sin 3 sin 3 2
Drucker Prager criterion Rankine criterion Rt Rt Rc Rc I II
Both Dt and Dcaffect the effective stress ~ (equation 4) to obtain, the stress to be used at integration
points of the finite element code. (1 is the identity tensor in the equation 4 and 5 ): (4) (1Dc).((1Dt).~Dt(~~p)) (5)
1Dc
.1Dt
.S0.1
Dc
.Dt.S0.
f
p
~ is a plastic stress following a crack re-closure yield function described hereinafter. It is equal to ~
during the damage process, such as (~ ~p)
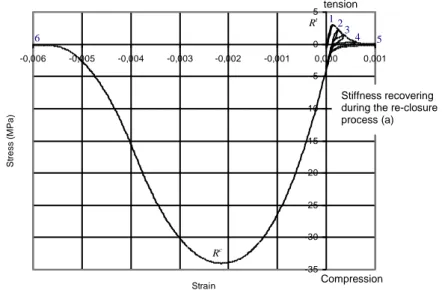
stays equal to zero. But it depends on the crack opening as soon as a crack re-closure is activated. In equation 5, f S01.~p. This particularity of the model, inspired from the work of Jefferson (Jefferson, 2003), allows a progressive stiffness recovering during the re-closure processes (cf. uniaxial cyclic loading illustrated in Figure 5).
-35 -30 -25 -20 -15 -10 -5 0 5 -0,006 -0,005 -0,004 -0,003 -0,002 -0,001 0,000 0,001 Strain St re ss (MPa ) Rc 1 2 3 4 5 6 Rt tension Compression Stiffness recovering during the re-closure process (a)
Figure 5: Behaviour model under cyclic axial loading (cycle order numbered 1 to 6).
The evolution laws used to link the criteria and the damage have to model the softening phase of the behaviour laws as illustrated in Figure 5. The damage tensor components (equations 6 and 7) are assessed according to internal variables called crack density functions (dIt, t
J d ,dKt in Equation 6 and 9). (6)
)) , max( 1 ( ~ ~ ~ ) 1 ( 1 2 1 ~ 2 t J t I IJ IJ KK JJ t I t I I I I I d d G E d E d c 1~ S (7) Dt 1 S0.S-1In equation 6, subscripts (I, J, K) stands for the main directions of Rankine criteria (equation 2-a). ~ II stands for the normal effective stresses applied in these main directions. The free energy potential corresponding to this constitutive law is given by equation 8. It allows defining the dissipation conditions to be verified to choose the damage tensor form and the damage evolution laws.
(8)
F H f t c f t t c t . . . 2 1 . . . 2 1 1 D 1 D .S0 .1 D D S0The crack density functions are chosen as monotonic increasing functions of the Rankine criteria in tension (equation 9) and of the equivalent Drucker Prager criteria in compression (equation 10).
(9) t m t u R I t t I m d 1 exp
1 with I
1,2,3
a main direction of R(10) c m c u DP c c I m d
~ 1 exp1 with I
1,2,3
a main direction of DPIn equations 9 and 10, m and u are material parameters linked to the brittleness of materials and to their strengths (equation 11 and 12 where E stands Young modulus, Poisson ratio, t
R tensile strength and
c
R compressive strength for the homogenised masonry).
(11) 2 2 2 1 2 t t peak t peak t u R E E and t u t t R m ln 1 (12) uc
3
Epeakc 3 1 and
c u c c R m 3 3 1 ln 1As demonstrated in (Sellier & al, 2010), these choices, combined with the damage form (equation 6), ensure a positive dissipation during the cracking process (terms (c) and (d) in equation 13 stay unconditionally positive): (13) . . : : 0 ) ( ) ( ) ( 0 ) ( d c c c t t b f f a D Y D Y
Terms (c) and (d) in equation 13 are the thermodynamic forces associated to the damage tensor, they are defined by equations 14 and 15 according to the free energy potential (equation 8) which is built to verify term (a). (14) t t D Y (15) c c D Y
(16)
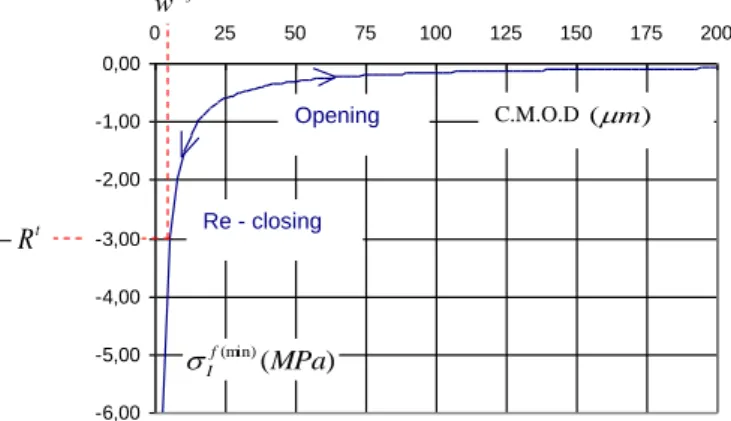
.~ . 0 f f t c f D D 1This condition is verified using a convex multi-criterion for the plastic threshold used for stresses in the cracks and a return mapping algorithm to manage the plastic flow, please see (Sellier & al 2010) for more details. The plastic threshold is such as a re-closure function linking the crack opening to the normal stress in the cracks as illustrated in Figure 6. The re-closure function is given by equation (17).
-6,00 -5,00 -4,00 -3,00 -2,00 -1,00 0,00 0 25 50 75 100 125 150 175 200 Opening Re - closing C.M.O.D ( m ) ) ( (min) MPa f I ref w t R Opening
Figure 6 : Crack re-closure function (stress in the crack vs. crack opening)
(17) ref I ref t f I w w w R . (min)
In equation 17, the parameter noted wref allows to consider the roughness of the crack edges. It is conventionally defined so that stress If(min)corresponds to the stress
t f II R
~ on the crack edges when a residual opening of wref is reached. is a small value, close to zero (in relation to R ), chosen t conventionally to avoid a division by zero when the crack is totally re-closed. Equation 17 allows modelling easily a progressive recovering of stress intensity during the re-closing process. The crack opening, wIin equation 17 and Figure 6, is assessed according to the following expression proposed by Sellier in (Sellier et al 2010): (18)
peak t I peak t I t I I I c peak t I peak t I t I I E t I t I I I c I d d d H H d d d l d E d w t II 1 ) ~ ( 1 . . ) 1 ( 1 2 1 ~ / ~ 2 In equation 18, H stands for the Heaviside function defined as H(X)1if X>0, 0 otherwise. The Heaviside function is applied to the effective stress to consider that a crack can be opened only if the finite element is in tension in the corresponding direction.
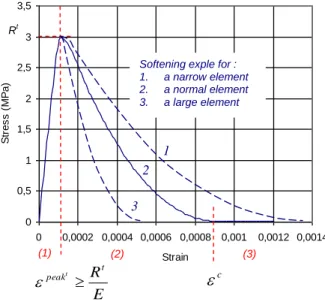
To avoid a dependence of the finite element solution to the mesh size (due to the localization induced by softening), the damage evolution law has to depend on the finite element size, as originally suggested in (Hillerborgh et al 1976). In fact, the energy dissipated to create a crack in a given main direction eI (One of the Rankine multi-criterion eigen direction) has to be equal to the experimental fracture energy Gf . Due to the softening shape of the behaviour law, this energy localizes on the more loaded finite elements of the mesh. So the dissipation could depend on the size of these elements if no precaution is kept. In order to correct this calculation problem, it has to be used a volumic cracking energy g depending on the f
orientation of the crack (eI), and chosen in such a way that the energy under the tensile curve remains equal to Gf whatever the size of the element ( )
I e l in the direction I e , (equation 19). (19)
( ) 2 . . ) 1 ( 2 ) ( I I e c p ea k e gf t I t l d D E E R Gf
In equation 19, Rt is the tensile strength, E the Young modulus, peak the strain at the peak of the tensile curve and c the fracture strain (Figure 7). In order to verify equation 19, the length of an element ( )
I e
l
has to be determined in the main cracking directioneI.
0 0,5 1 1,5 2 2,5 3 3,5 0 0,0002 0,0004 0,0006 0,0008 0,001 0,0012 0,0014 Strain S tr e s s ( M P a ) E Rt peakt c (1) (2) (3) Rt
Softening exple for : 1. a narrow element 2. a normal element 3. a large element 1 2 3
Figure 7 : Behaviour law evolution according to the finite element size
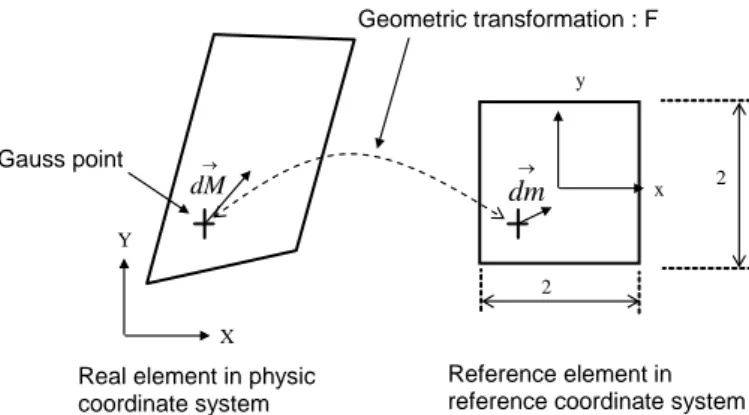
The length determination method is based on the shape function of the considered finite element. At a given integration point (Gauss point in Figure 8), the Jacobian matrix J X/xof the geometric transformation X F(x) used to pass from reference coordinate system (x in Figure 8) to the real coordinate system ( X in Figure 8). As illustrated in Figure 8, the transformation of an elementary vector
dm becomes
dM according to equation 20. As the length of the reference finite element is known, the inverse transformation allows assessing the equivalent length of the element in a direction. For an eight nodes cubic element, the edge of the reference element is equal to 2, and corresponds to its isotropic size. Consequently, the real element has a size which can be approximated by the inverse transformation of this isotropic size in the directioneI. In equation 19, a scalar value is needed for the length of finite element, so the projection of l(eI)
on eI
is chosen (equation 21) as an approximated size of the real element in the directioneI. Figure 9 illustrates the evolution of this length for a real anisotropic finite element.
dM X Y x y 2 2 Reference element in reference coordinate system Real element in physic
coordinate system
Geometric transformation : F
Gauss point
dm
Figure 8 : Geometric transformation of a reference finite element
(20) I I I I e e J e e J e J J l dm J dM I 1 1 1 ) ( . 2 2 (21) I e e J l I 1 ) ( 2 I
e
) (eIl
X Y Real anisotropic finite element Size approximation function proposed 1 2 3 Figure 9: Evolution of ( ) I el according toeI for a parallelogram element (length numbered 1,2 and 3 corresponds the three softening curves in Figure 7).
Once the size ( )
I e
l is known, equation 19 allows determining ( )) ( Ie c
l
. So the softening phase of the behaviour law depends anisotropically on the finite element size, which allows ensuring energy dissipation Gf whatever is the orientation of the crack in the finite element. On purpose, the damage evolution law (Equation 9) has to be adapted, and is replaced in the post peak phase of the behaviour law by a polynomial approximation (Equation 22), in which the parameter a, b and c are computed to verify the softening phase at ( ))
( Ie c
l
(cf. Figure 7, where several softening phases are illustrated, each of them corresponds to a size and an orientation in Figure 9).
(22)
R I R I R I t I c b a d 21 with I
1,2,3
a main direction of RFinally, this technique allows meshing the structure independently of the foreseeable cracking pattern. In the next section, the model is applied, after a homogenization process, to a thin masonry arch built and loaded by Sanchez (Sanchez, 2007).
Sanchez’ unreinforced vault
After a general description of the vault, methods used to obtain homogenized parameters are discussed and simplified methods are proposed. Next, two types of calculus are performed. The first one neglects the building history. It leads to a correct prediction of the failure load but to an erroneous value of the initial stiffness of the vault. The second calculus takes into account the building method and the effect induced by this method. Among them is the constrained shrinkage of mortar joints, which leads to a crack opening before the load application. This crack is re-closed progressively during the loading, so the apparent stiffness of the vault is affected by the mechanism. Consequently, results depend not only on elastic and strength parameters of the material but also on their shrinkage in relation with the boundary conditions evolution since the building period.
General description
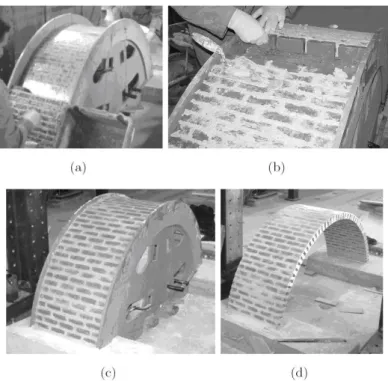
In 2007, Sanchez built few thin masonry vaults (Figure 10). He tested them with and without Fibre Reinforced Polymer (FRP). He inspected the elastic response, the failure and the post peak behaviour of these unreinforced and FRP reinforced vaults. In this paper, we will model the unreinforced vaults with our damage model and compare the numerical results to the experiments.
Figure 10: Different phases involved in the construction of masonry arches (Sanchez, 2007).
Sanchez focused his attention to the FRP – masonry bond and modelled the vault with a micro-model. In his model, the masonry is as a combination of bricks and interfaces. The blocks were modelled with eight-node plane stress elements. For the blocks, the associated behaviour law was elastic linear. The mortar was represented as six-node interface elements with a zero thickness. In the framework of plasticity, the non linearity of the joints was depicted with a cut off in tension for mode I failure and a Coulomb friction envelop in mode II failure.
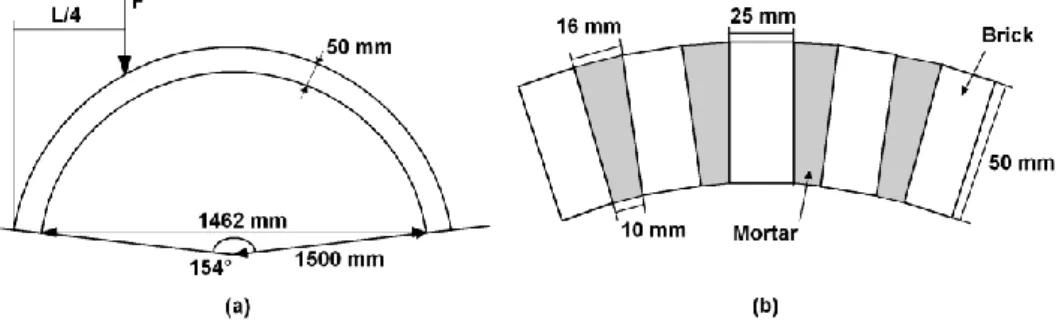
The experimental unreinforced thin masonry arches built by Sanchez were 50 mm thick. The semicircular vaults were assembled with 59 blocks. The diameter was 1500 mm for a span of 1462 mm considering an opening angle of 154° (Figure 11 (a)). In order to give the circular curvature to the vault, the mortar joint thickness is 10 mm in the intrados and 16 mm in the extrados (Figure 11 (b)). The bricks dimensions remained constant with 25 mm large, 50 mm height, and 100 mm long.
The vaults were tested with an axial loading placed at the first quarter span. The load was progressively applied until the collapse of the structure. The point load displacement was recorded during the test.
Figure 11: (a) Masonry vault description, (b) Detailed bricks - mortar layout
Before the vault building, Sanchez characterized each constitutive material. He carried out compression tests on both clay brick and mortar in order to obtain the compressive strength and the young’s modulus. He also performed this compression test on masonry sandwiches composed of clay bricks and mortar. The obtained results are shown in table (1).
Table (1): Material parameters determined by Sanchez
Material Compressive strength Young’s modulus
Clay brick 8.7 MPa 4890 MPa
Mortar 7.3 MPa 1800 MPa
Masonry 9.1 MPa 2040 MPa
Homogenised parameters obtainment
As Frunzio explained (Frunzio, 2001), the material parameters influenced a lot the numerical results. Moreover, he underlined that in most cases, it is hard to evaluate these homogenized parameters. In order to shift from the brick - joint approach to the continuum approach, the method is either to perform test on representative volume of masonry or to develop an accurate homogenization procedure. The goal is to merge blocks and joints in a unique homogenized material. In our macro-model, elastic properties, strengths and fracture energies have to be determined.
If no test on representative volume of masonry is available, the best way to obtain the homogenised parameters properly from elementary material characteristics consists to model numerically a representative elementary volume of masonry, as suggested in (Domede 2006). This method is able to supply the whole parameters of the model.
Nevertheless, if neither experimental tests nor finite element tests are possible, resorting to a simplified analytical homogenisation technique is a last recourse. The homogenized elastic modulus can be determined using several methods. The simplest technique is to consider the masonry as a spring system
so the equivalent elastic modulus E can be calculated as a combination of the brick’s and mortar’s eq
elastic. This method, used by few authors (Abruzzese, 2009), gives an approximation based on a serial system and must be applied only for masonry loaded in plane perpendicularly to the main joints. Another method to find out the homogenized elastic modulus is proposed by Cecchi and Sab (Cecchi and Sab 2002). They recommend calculating the stiffness matrix of a representative volume of masonry (Figure 12) with a formula based on homogenisation theory.
Figure 12: Elementary pattern in the running bond masonry (Cecchi and Sab 2002).
We performed the analytical homogenization process recommended by Cecchi and Sab (Cecchi and Sab, 2002). This process requires dimensions, young modulus and Poisson ratio for bricks and joint material in order to obtain the homogenized young modulus and Poisson ratio. Using this procedure, we found an elastic modulus around 3700 MPa which differs significantly from experimental result on sandwiches supplied in Table 1 (2040 MPa), but also from the Young modulus needed to find the proper stiffness of the vault (1000 Mpa). Note these different results are not as contradictory as it seems. In fact the homogenisation supplies an upper limit, neglecting the possible imperfection at the interface between joints and bricks. On another hand, the modulus measured on sandwiches could be different from the real homogenised one because sandwiches are not representative volumes. Finally only the modulus assessed from the inverse analysis of the vault could be the right. Nevertheless, even this last one is difficult to define because it depends as explained hereafter on the material evolution of the vault, including the building period and the loading level.
For the other parameters, several empirical and simple formulas can be proposed. Some of them are proposed below to find rapidly missing homogenized parameters for the envisioned application.
Concerning Poisson ratio, tension and compression strengths and fracture energy in compression, values given by Sanchez (Sanchez, 2007) are adopted and exploited as follow. Deformation at the compression strength has been fixed at 3.5 e-3 m/m to have compression curve with a shape in accordance with Eurocode 6. is calculated with equation 3 according to the internal friction angle 30° supplied by Sanchez. The deformation at the peak in tension is figured out with
E Rt
t
considering that the material is undamaged until the peak.
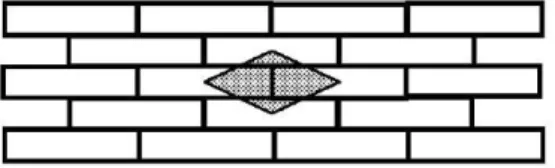
The tensile strength used as homogenised parameter is the result of the proposed approximation (equation 9). In this equation, Rt
int is the tensile strength of the interface,
lvstands for the sum of the verticallength and
lhis the sum of the horizontal length. This equation represents an approximation of the horizontal joint contribution in the homogenised tensile strengthRt. It considers implicitly that the crack will follow the joint without crossing the bricks as schematized in Figure 13. The first underlying assumption is that bricks can not break in tension because their own resistance is greater than the mortar one, so the crack follow a path which is the smallest way in order to release the minimum amount of energy. Another assumption is that the shear strength in horizontal joints remains close to the tensile strength in vertical joints.(23) t v v h t R l l l R int
Figure 13 : Equivalent vertical length to assess tensile strength
In the same way, it is proposed to assess the equivalent fracture energy
eq ft G calculating as a combination of tension energy I ft
G and shear energy
II ft
G as shown in Equation 24. This equation describes the equivalent fracture energy
eq ft
G as a contribution of the mode I fracture energy
I ft
G in the total vertical length
lvand a contribution of the mode II fracture energyII ft
G in the total horizontal length
lh. This equation leads to release an amount energy equivalent to the amount of energy released on the vertical and the horizontal parts.(24)
v f h f v ft l G l G l G I II eqUsing the experimental parameters given by Sanchez and few simple formulas lastly described, the material properties used in the model are presented in table (2). They are deduced either from Sanchez experimental data either from the proposed homogenization methods.
Table (2): Parameters used for the damage model
Parameters Values Obtainment method
Elastic modulus
3700 MPa 2040 MPa 1000 MPa
Cecchi and Sab homogenization Sanchez’ test on sandwiches Inverse analysis from Sanchez’ results Poisson ratio 0.2 Given by Sanchez
Maximum tension resistance 0.18 MPa Calculated with Equation 23 Deformation at the maximum
tension resistance 1.8 e-4 m/m Calculated with Equation E
Rt t
Fracture energy in tension 1.7 e-6 N/mm Calculated with equation 24
Maximum compression resistance 7.3 MPa Minimum value of the constitutive material Deformation at the maximum
compression resistance 3.5 e-3 m/m Usual value proposed by Eurocode 6 Fracture energy in compression 90 N/mm Given by Sanchez
Delta 0.99 Calculated with Equation 3 wref 5 μm Usual value used for mortar
Once the homogenized parameters for the continuous material are determined, the numerical damage model can be used to analyse the vault.
Numerical simulation without considering building history
Based on geometrical specification and homogenised material properties presented before, a 3 dimensional finite element model of the thin masonry vault was built. The complete structure was designed using 720 (30 radial x 8 ortho-radial x 3 in the width) massive cubic 8-nodes finite elements called “Solid185” in ANSYS. This specific element allows using the “usermat” Fortran subroutine in which the damage model is implemented. Even if the proposed formulation is explicit no sub-stepping at local level (Gauss point) is needed due to the analytical dependence of all internal variables on the actual strain state.
The numerical geometry of the structure is presented in Figure 14. The two abutments are fixed and the load is applied at the fourth of the span. The load application is numerically modelled using an imposed displacement.
Figure 14: Finite element modelling for the unreinforced vault.
Based on the damage model describes in section 2 and the material parameters described in table (2), two non linear finite element analysis are performed, considering first the Young modulus provided by Cecchi and Sab homogenization solution, and next the experimental value supplied by Sanchez with sandwich tests. The damage pattern of the numerical model using the Cecchi and Sab homogenisation process is presented in Figure 15. Where the damage parameter is 1, there is a crack. A crack appears just below the loading application point where the vault is in tension. Moreover, the right support of the vault presents also a significant damage. Actually, these damaged zones correspond to four “hinges” in the structure (numbered from 1 to 4 in Figure 15, according to their apparition order). The load displacement curves are shown in Figure 16 and compared to the experimental results from Sanchez (Sanchez, 2007).
Figure 15: (a) Damage parameter (undamaged “0” - totally damaged “1”) (b) Crack Mouth Opening distance for the numerical model using the Cecchi and Sab homogenized young modulus.
0 0,5 1 1,5 2 0 0,5 1 1,5 2 2,5 3
Loading point displacement (mm)
Applied forc e (k N )
(a) Sanchez experimental curve 1 (b) Sanchez experimental curve 2 (c) E = 3700 Mpa (d) E = 2000 Mpa (a) (b) (c) (d)
Figure 16: Comparison between experimental Sanchez load displacement curves and numerical damage model results using elastic modulus from the sandwich compression test or the homogenization process.
Figure 16 shows that numerical results are relatively matching the experimental results considering the maximum load peak. This shows that the proposed approximations to assess Rt and G from elementary ft results on material are sufficient to obtain the vault resistance. However, considering the initial stiffness, it has to be noted that the numerical results are significantly different from experiments. The real stiffness of the vault seems to be effectively less than the values expected from material characteristics. In the following section, it is proposed to explain the difference searching the possible causes of this difference in the building method of the vault. On purpose, history of the structure is modelled by taking into account, in particular, crack opening due to the shrinkage of mortar joints during the building phase.
Numerical modelling considering building history
Sanchez built a wood formwork to support the bricks and mortar layers. The blocks and the joint were progressively set at the same time starting from both ends until the vault was totally built. Then a one week period was allowed for curing before the frame was removed (Figure 10). Two weeks after the
building phases, the arches were tested under a point load at the fourth of the span. In order to approximate the real stiffness of the vault, starting with homogenized elastic modulus provided by Cecchi and Sab formula, simulation of the history of the vault is performed.
Indeed, during the building phase, mortar shrinkage occurred, so damage and perhaps cracks appear in the structure what reduce the stiffness of the vault. Next, when the framework is removed, cracks can re-close and the global stiffness can re-increase, nevertheless without reaching its initial value. Considering these building phases, modelling the history of the vault is attempted in order to estimate its initial rigidity.
Framework setting
First, the framework setting is modelled using a contact element allowing an unilateral contact (contac52 element in Ansys) (Figure 17). Contac52 element represents two surfaces which may maintain or break physical contact and may slide relative to each other. The element has three degrees of freedom at each node: translations in the local x, y, and z directions. One of the nodes is attached to the vault and the other is blocked in all directions. Thanks to this contact element, a rigid framework is supporting the structure so it is possible to apply self weight and shrinkage, what is done in the next step.
Figure 17: Framework setting and contact element.
Self weight and shrinkage on the framework
The framework is a support for the material. Regarding the early age of the mortar, its shrinkage has to be taken into account. The autogenous shrinkage is homogenized on the structure using a simple formula (Equation 25) assuming the serial arrangement of bricks and joint along the vault, with
l
m andl
bthedeveloped length of mortar and bricks in the vault and
mand
bthe autogenous shrinkage of mortar andbricks. Considering the bricks were already cured when they were laid on the formwork,
b
0
. Also, at 20°C, the autogenous shrinkage of mortar was taken as 1 mm/m, according to experimental results obtained on a similar mortar (Loukili, 2000). The homogenised shrinkage is then applied in the model using an equivalent temperature field on the structure and simultaneously with the self weight: homogenized density was 2300 kg/m³. The finite element analysis is carried out with the material parameters given in Table (2) with an elastic modulus calculated with the analytical homogenization process (3700 MPa, Cecchi and Sab method). The parameter evolution during the hardening phase is not considered here since the calculation corresponds to the vault state at the end of the first week of the experiment.(25) b m b b m m og
l
l
l
l
homThe results of this second step of the history simulation are shown in Figure 18 with the tensile damage (a) and the crack mouth opening distance (b). Tensile damage is localized symmetrically on the structure. Crack appears in the middle of the vault and its opening is around 0.35 mm.
Figure 18: Tension damage (a) and crack mouth opening distance (b) for the simulation of self weight and mortar skrinkage.
Self weight, shrinkage and framework removing
A week after the vault building, the formwork was taken away by Sanchez. So the next step for the model is to remove the boundary condition corresponding to the formwork and let the vault going on its own structure. Removing the numerical formwork consists on moving the fixed nodes of the contac52 element down (Figure 19).
Figure 19: Framework removing.
Removing the formwork is the third step of the vault life simulation and the results are given in Figure 20 with the tensile damage (a) and the crack mouth opening distance (b). Tensile damage is the same as in the previous step since it can not decrease due to the thermodynamic conditions in the damage evolution law. So the crack is situated at the same location as before but it has to be noticed that the crack re-close. The weight of the structure leads to this re-closure. Now the opening distance is around 0.24 mm (instead of 0.35 mm in the last step).
Figure 20: Tension damage (a) and crack mouth opening distance (b) for the simulation of formwork removing.
Load application
Finally, starting from the last step, the load can be applied at the fourth of the span. A displacement is progressively applied on the nodes located at the load application point. The tensile damage (a) and the crack opening distance (b) are shown in Figure 21, this figure corresponds to the maximum load. At this stage, new tensile damages appear on the structure, principally under the load application point and at the hinges points mentioned in the Figure 15. The main crack is located under the load application point and its wide is around 4.3 mm, but the initial crack due to the shrinkage on the framework is now totally re-closed. Secondary, cracks also appear near the hinges points. The load displacement curve obtained is given in Figure 22. It has to be noted that even with the Young modulus provided by the homogenisation theory, the stiffness of the vault is correctly assessed. In fact, this good result is due to a competition between crack re-closure effect, which increases the global stiffness in the first stage of loading, and the damage of the vault under the applied load which tends to decrease it. Finally it is worth to say that the stiffness of this vault is a combination of several non linear phenomena which have to be considered for a proper modelling: re-closure of crack induced by partially constrained shrinkage on one hand and damage induced by loading on the other hand. Note also that the un-damaged stiffness of the vault can be assessed by the homogenisation theory.
0 0,5 1 1,5 2 0 0,5 1 1,5 2 2,5 3
Loading point displacement (mm)
Applied forc e (k N )
(a) Sanchez experimental curve 1 (b) Sanchez experimental curve 2 (c) E = 3700 Mpa
(e) Vault History
(a)
(b) (c)
(e)
Figure 22: Comparison between direct calculus with homogenized Young modulus, homogenized young modulus with history consideration and experimental results
CONCLUSION
The homogenised damage model proposed allows an automatic management of localization, totally independently from the mesh. It is also able to treat properly stiffness recovering when cracks re-close. The model was used on a thin unreinforced masonry vault previously tested by Sanchez. Using the experimental results on material, homogenised parameters are obtained with several methods. Among them was a linear homogenisation technique to assess the Young modulus of the masonry. The first finite element calculation of the vault, performed with these values, was able to find the failure load but highlights the apparent inefficiency of the linear homogenisation technique to assess the global stiffness of the vault. So, a second numerical calculation was performed including boundary conditions, material shrinkage before the test. This methodology shows that a cracking state of the vault was induced by this scenario. The consequence of this initial cracking state was a reduction of the global stiffness of the vault in accordance with experimental observations. Finally the proposed numerical damage model, using a classical linear homogenisation method to assess stiffness of the undamaged masonry, is able to consider these different aspects and the obtained results are consistent with the experimental results from Sanchez. The restrained shrinkage leads to cracks opening and self weight application and formwork removing to a partial re-closing of previous cracks then to a partial stiffness recovering. So, to have a realistic modelling of the masonry stiffness, it is significant, not only to give homogenized data representing the real characteristics of the structure, but also to model the history of the structure: research goes on in this way. A real multi arch masonry bridge has been instrumented by SNCF to extend the methodology to different types of structure histories. The instrumented bridge in this SNCF research program concerns specifically the history of foundation movements.
ACKNOWLEDGEMENTS
The financial support by the Société Nationale des Chemins de fers Français (SNCF) and Réseaux Ferrés de France (RFF) awarded to T. Stablon is gratefully acknowledged.
REFERENCES
Aboudi, J. (1991), Mechanics of Composite Materials - A Unified Micromechanical Approach, Elsevier.
Abruzzese, D., Miccoli, L., Yuan, J. (2009), “Mechanical behavior of leaning masonry Huzhu Pagoda”, Journal of Cultural Heritage, Vol. 10, Issue 4, 480-486.
Bayraktar, A., Sahin, A., Ozcan, D. M. and Yildirim, F. (2009), “Numerical damage assessment of
Haghia Sophia bell tower by nonlinear FE modelling,” Applied Mathematical Modelling, Vol. 34, Issue 1, 92-121.
Berto, L., Saetta, A., Scotta, R. and Vitaliani, R. (2004), “Shear behaviour of masonry panel: parametric FE analyses,” International Journal of Solids and Structures, Vol. 41, Issues 16-17, 4383-4405.
Cecchi, A. and Sab, K. (2002), “A multi-parameter homogenization study for modelling elastic masonry,” European Journal of Mechanics, Vol. 21, Issue 2, 249-268.
Colliat, J.B., Davenne, L., Ibrahimbegovic, A. (2002), “Modélisation jusqu'à rupture de murs en maçonnerie chargés dans leur plan, ” Revue Française de Génie Civil, Vol. 6, 593-606.
Cruz-Diaz, J.I., Sellier, A., Capra, B., Delmotte, P., Rivillon, P., Mebarki, A. (2002), “Resistance of masonry infill walls to racking loading: Simplified model and experimental validation,” Masonry International, Vol. 15, No 3, 59-86, 73- 79.
Domède, N. (2006), “Méthode de requalification des ponts en maçonnerie,” PhD thesis, INSA de Toulouse, 202 p.
Eurocode 6 (2006), Design of Masonry Structures – Part 1-1: Common rules for reinforced and unreinforced masonry structures, NF EN 1996-1-1.
Fanning, P. J., Boothby, T. E. (2001), “Three-dimensional modelling and full-scale testing of stone arch bridges,” Computers & Structures, Vol. 79, Issues 29-30, 2645-2662.
Frunzio, G., Monaco, M. and Gesualdo, A. (2001), “3D F.E.M. Analysis of a Roman Arch Bridge,” Historical Constructions, In P.B. Lourenço and P. Roca, Editors, Guimarães, 591–598.
Ghosh, A.K., Made, A.M. and Colville, J. (1994), “Finite element modelling of unreinforced masonry,” Proceedings of the 10th international brick/block masonry conference, Calgary, 61 p.
Hillerborg, A., Modeer, M., Peterssonn, PE. (1976), “Analysis of crack formation and crack growth in concrete by means of fracture mechanics and finite elements,” Cement and Concrete Research, 773-782. Jefferson, T. (2003), “Craft–a plastic-damage-contact model for concrete. I. Model theory and
thermodynamic considerations,” International Journal of Solids and Structures, Vol. 40, 5973–5999. Loukili, A, Chopin, D, Khelidj, A, Le Touzo, J.Y. (2000), “A new approach to determine autogenous shrinkage of mortar at an early age considering temperature history,” Cement and Concrete Research, Vol. 30, 915-922.
Lourenço, P.B. (1996), “Computational strategies for masonry structures,” PHD thesis, Delft University of Technology, 210 p.
Lourenço, P.B., Rots, J.G. (1997), “A multi-surface interface model for the analysis of masonry structures,” J. Engrg. Mech., ASCE, 123(7), 660-668.
Lourenço, P.B., Ramos, L.F. (2004), “Characterization of Cyclic Behaviour of Dry Masonry Joints,” J. Struct. Engrg., 130, 779.
Massart, T.J., Peerlings, R.H.J., Geers, M.G.D. (2004), “Mesoscopic modeling of failure and damage-induced anisotropy in brick masonry,” European Journal of Mechanics - A/Solids, Vol. 23, Issue 5, 719-735.
Oliveira, D. V., Lourenco, P. B. (2004), “Implementation and validation of a constitutive model for the cyclic behaviour of interface elements,” Computers & Structures, Vol. 82, Issues 17-19, 1451-1461.
Page, A.W. (1978), “Finite element model for masonry,” Journal of Structures, ASCE 104 ST8, 1267– 1285.
Papa, E. (2001), “Damage and failure models,” Computational modelling of masonry brickwork and blockwork structures, Saxe-Coburg Publications, 1–26.
Rahman, A. and Anand, S. C. (1994), “Empirical Mohr-Coulumb Failure Criterion for Concrete Block-Mortar Joints,” Journal of Structural Engineering, ASCE, Vol. 120, No 8.
Reyes, E., Galvez, J.C., Casati, M.J., Cendon, D.A., Sancho, J.M. and Planas, J. (2009), “An embedded cohesive crack model for finite element analysis of brickwork masonry fracture,” Engineering Fracture Mechanics, Vol. 76, Issue 12, 1930-1944.
Sanchez, I. B. (2007), “Strengthening of arched masonry structures with composite materials,” PHD thesis, University of Minho, 232p.
Sellier, A. and Benoit, B. (2002), “Coupled damage tensors and weakest link theory for the description of crack induced anisotropy in concrete,” Engineering Fracture Mechanics, Vol. 69, Issue 17, 1925-1939.
Sellier, A., Cazaux-Ginestet, G., Buffo-Lacarriere, L. (2010), “Crack opening assessment throughout concrete structures: a continuum three dimensional finite element model based on orthotropic damage concept and cracks re-closure function”, submitted to Fracture Engineering mechanics.
Senthivel, R., Lourenco, P.B. (2009), “Finite element modelling of deformation characteristics of historical stone masonry shear walls,” Engineering Structures, Vol. 31, Issue 9, 1930-1943.
Sutcliffe, D.J., Yu, H.S. and Page, A.W. (2001), “Lower bound limit analysis of unreinforced masonry shear walls,” Computational Structure, Vol. 79, 1295–1312.