Publisher’s version / Version de l'éditeur:
Physical Review A, 39, 8, pp. 3992-3997, 1989-04
READ THESE TERMS AND CONDITIONS CAREFULLY BEFORE USING THIS WEBSITE.
https://nrc-publications.canada.ca/eng/copyright
Vous avez des questions? Nous pouvons vous aider. Pour communiquer directement avec un auteur, consultez la première page de la revue dans laquelle son article a été publié afin de trouver ses coordonnées. Si vous n’arrivez pas à les repérer, communiquez avec nous à [email protected].
Questions? Contact the NRC Publications Archive team at
[email protected]. If you wish to email the authors directly, please see the first page of the publication for their contact information.
NRC Publications Archive
Archives des publications du CNRC
This publication could be one of several versions: author’s original, accepted manuscript or the publisher’s version. / La version de cette publication peut être l’une des suivantes : la version prépublication de l’auteur, la version acceptée du manuscrit ou la version de l’éditeur.
For the publisher’s version, please access the DOI link below./ Pour consulter la version de l’éditeur, utilisez le lien DOI ci-dessous.
https://doi.org/10.1103/PhysRevA.39.3992
Access and use of this website and the material on it are subject to the Terms and Conditions set forth at
Experimental test of the optical Bloch equations for solids using
free-induction decay
Szabo, A.; Muramoto, T.
https://publications-cnrc.canada.ca/fra/droits
L’accès à ce site Web et l’utilisation de son contenu sont assujettis aux conditions présentées dans le site LISEZ CES CONDITIONS ATTENTIVEMENT AVANT D’UTILISER CE SITE WEB.
NRC Publications Record / Notice d'Archives des publications de CNRC:
https://nrc-publications.canada.ca/eng/view/object/?id=fb4a82ab-7708-4fd5-b138-7075a743a021
https://publications-cnrc.canada.ca/fra/voir/objet/?id=fb4a82ab-7708-4fd5-b138-7075a743a021
PHYSICAL REVIEW A VOLUME 39, NUMBER 8 APRIL 15,1989
Experimental
test of
the
optical
Bloch
equations
for solids
using
free-induction
decay
A.Szabo and
T.
Muramoto*Division ofPhysics, National Research Council ofCanada, Ottawa, Ontario, Canada K1AOR6
(Received 28 November 1988)
Recent studies byDeVoe and Brewer [Phys. Rev.Lett. 50, 1269(1983)]have shown that the
con-ventional optical Bloch equations markedly fail to describe the optical saturation behavior oftheD,
line in the solid Pr'+:LaF&. In this paper we extend these studies to another solid, ruby, using free-induction-decay observations obtained by pulse excitation of the
R,
line at 693.4 nm with anultranarrow-linewidth dye laser. Comparison of the results with Gauss-Markov and random-telegraph-dephasing theories shows approximate agreement for a fluctuation correlation time
~,
=
T2, the dephasing time. This result isremarkably similar to that obtained forPr':LaF3
How-ever, for theoretical and experimental reasons, we conclude that the theories do not consistentlyex-plain the current as well as other data. A qualitative discussion ofanother dephasing model is given.
I.
INTRODUCTIONRecent free-induction-decay
(FID)
studies by DeVoeand Brewer' have shown that the conventional optical
Bloch equations (OBE's) fail to describe the saturation behavior
of
theD,
line (592.5 nm) inPr:LaF,
. This isa surprising and important result both for scientific and technological reasons.
For
hole-burning optical memories'
the effectsof
power broadening will play a cr'itical role in the designof
such systems. Scientifically, the studyof
linewidth and dephasing mechanisms innu-clear and electron magnetic resonance has been actively pursued for some 40years. In particular, various models
of
host spin-flip-induced dephasing have been studied and recently extended to optical transitions. In addition tothe latter Monte Carlo calculation, several theoretical studies using Markovian" ' and non-Markovian'
mod-els for dephasing have appeared, all attempting to fit the
Defoe-Brewer
data. As discussed by Herman' and Javanainen, however, noneof
the numerical calculations presented so far consistently describe the data for Pr +:LaF& which includes photon echo as well asFID
observations.In this paper we extend these high-resolution
FID
studies to another solid,Cr:Al203,
in order to confirm the generalityof
the anomalous saturation behavior ob-served for Pr+:LaF3
as well as to subject to theories tofurther comparison with experiment.
II.
THEORYresources. Also, these two models have been studied
pre-viously in some detail and compared ' with the first ex-periments with Pr
+:LaF3.
Here we extend these studiesto calculate the shape
of
the free-induction decay(FID)
for the finite excitation time (200@sec)used in the experi-ments.
Both models as well as the conventional
OBE
are de-scribed by amatrix equationdgldt
=MP+L,
y 0 0
0
—
6
0m= —
oy
0+a
on
—
r„
0 0 2y 0
—
A 0 0 0 0(2)
where the first matrix accounts for lifetime damping, the second is the driving matrix, and the third is a general-ized damping matrix. We consider three cases for the damping parameters.
(1) The conventional optical Bloch equations are the following:
where
p
is the three-component Bloch vector,p(1)=u,
P(2)
=
v, andP(3
)=
tv using the usual notation, andL(1)=L(2)=0
andL(3)=2yW,
. We assume a closed two-level system so that 2y=
1/T,
whereT,
is the upper-state lifetime. We set the equilibrium value8',
=
—
1. The 3X3matrixM
can be written asA review
of
various Markovian modelsof
sudden-jump, frequency-fluctuation-induced dephasing has beengiven by Berman. ' These are, under general conditions, rather complex and would require extensive numerical calculations to provide quantitative results for compar-ison with experiments. In this paper we restrict our
theoretical discussions to two particular models, Gauss-Markov ' (GM) and random telegraph" (RT) which can be numerically calculated with modest computer
and
where T2 isthe dephasing time.
(2)Gaussian-Markov (y
'r,
,&(
1):r„=r„=y
[I+(a&,
)']y[i+(n
r,
)'],
I
„=
y'Abr,
/[
I+
(ft'r,
)'],
39 EXPERIMENTAL TEST OF THE OPTICAL BLOCH EQUATIONS. . . 3993
r„=
—
yn~,
/[I+(n
~,)],
z=I
z,=0,
(4)
L
1 1CBIc Tz
where
y'=(5w)
~„Q'=(6
+II
)',
0/2ir
is the Rabifrequency,
5/2~
is the detuning frequency, and 5te,~,
are parameters
of
the frequency fluctuation mode1. (3)The third case is the random telegraph:"a
(1/~,
+y)(1/~, +2y)
I„=
I
zz=I
]/+a
&/~
b,
(1/~, +2y
)r
12=
—
r
21= —
a'
p
a(I/r,
+y)
b=y+
(1/~,
+y)'+a'
ands=A
1+
(I/r,
+y)
+b,
The amplitude
S(t)
of
theFID
for a plane-wave model and infinitely wide inhomogeneous line is simplyS(t)
—
f
u(t,
b,}db,.
For
a Gaussian-shaped beam and a 0Gaussian inhomogeneous width b,o (taken as 1 GHz in
the calculations) we have
S(t)
—
J
f
u(t,b,)exp[—
(b, /Ao)]
0 0
Xexp[
(r/ro) ]r
dr dh—, (10) where r, and ro are beam radii. Equation (10)wasnumer-ica11y integrated for a range
of
Rabi frequencies to givethe theoretical time dependence
of
theFID
decay. In general the decays are nonexponential, partly becauseof
the finite excitation period which leads to oscillatoryFID,
'i.e.
,there are zero-field crossings. The theoretical linewidth,
L,
[half width at half maximum (HWHM)], isobtained from the expression
z3
0
P=[(1/r,
+y)
+5
](I/r, +2y)+II (I/r,
+y),
where for exponential photon-echo decay we must have
a~, &(1
in which case the parameter a is related to the dephasing time Tz byTz
=/+a
7~A matrix solution
of Eq.
(1)has been obtained'allow-ing numerical calculation
of
the Bloch vector formation during an excitation timeT
followed by decay when the driving field is turned oA'.lf
the time variable t=0
at the endof
the excitation, then the solutionof
Eq. (1)givesduring the decay time
u(t,
h)=[u(T,
E)cos(st)+u(T,
b,}sin(st)]e
',
(7)where for the conventional
OBE
andGM,
b=
Tz ' ands=A,
while forRT
where
r„,,
is the1/e
decay timeof
the theoreticalFID
amplitude.III.
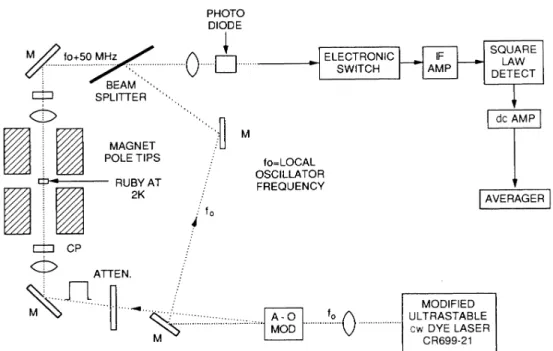
EXPERIMENTA. Apparatus
The experimental setup is shown in
Fig. 1.
FID
is ob-served following the applicationof
a 200-@sec pulseof
resonant laser light gated by an acousto-optic modulator.
Following the modulator, the linearly polarized laser beam is converted to circular polarization by a
quarter-wave plate and focused into the sample. This allowed selective excitation
of
the overlapping inhomogeneously broadened 0 -polarized R& lines terminating in theground state A
z(+
—,') levels. The transmitted light wasthen recollimated and directed onto an EG&,
G
FX-100
silicon photodiode terminated by 50 Q. TheFID
signalwas heterodyne detected at 50 MHz using the
bypassed-local-oscillator configuration' shown in
Fig. 1.
Thisconfiguration avoids potential
problems"
associatedwith setups in which the local oscillator is transmitted through the sample. A fast
rf
switch (Minicircuits ZAD-1-1) was used to suppress the large transient signals which appeared on applicationof
the light pulse. The 50-MHzrf
signal was amplified by a low-noise amplifier with a 3-db bandwidthof
10 MHz(RHG
ModelEVT50A03DM} and then rectified by a square-law
detec-tor.
The resultingFID
intensity signal was furtheramplified (Princeton Model 115 preamplifier) before
averaging with a Data Precision
6100
digital oscilloscopewith a model 620plug in. Finally the data was stored on a floppy disc along with the run parameters for later
analysis.
The sample was a
1.
6-mm-thick slabof
Cochralski-grown ruby with concentration
0.
0034 wt.%
Crz03.
Thisvery dilute sample was used to avoid complications from
Cr-Cr interactions' and necessitated signal averaging,
unlike Pr
+:LaF3
(O.l%%uo concentration) which could bemeasured with high signal-to-noise ratio (SNR) with a
single shot. A magnetic field
of
—
3.
5 kG was applied along the c axis along which the laser beam waspro-pagated. In this work the Az(
—
—,')~E(
—
—,')
transitionwas studied. As is well known from photon-echo modu-lation studies ' ' for this transition and field, the Al spin
mixing due to dipolar and exchange Cr-Al interactions is
small and hence this transition is a good approximation
to a two-level system. The sample was maintained at a temperature
of
-2
K
by pumping on liquid He whoselevel was maintained below the sample. This procedure
was found to greatly reduce the noise in the heterodyned signal caused by wave-front fluctuations generated by
superfluid He. Nevertheless, wave-front fluctuations in
the separate signal and local oscillator paths were
trou-blesome leading to a fairly large scatter
of
the measure-ments as described later. From this pointof
view, usingidentical paths for the signal-local oscillator beams is ad-vantageous.
3994 A. SZABO AND
T.
MURAMOTO 39PHOTO DIODE
fo+5
0
ELECTRONICSWITCH AMPSQUARE LAW DETECT SPLITTER dc AMP MAGNET POLETIPS RUBYAT 2K fo= LOCAL OSCILLATOR FREQUENCY AVERAGER CP ATTEN.
A-0
MOD'0
MODIFIED ULTRASTABLE cw DYE LASER C R699-21FIG.
1. Schematic of apparatus used for high-resolution free-induction-decay measurements. The bypassed-local-oscillator configuration is shown which uses an acousto-optic (AOj modulator to both pulse the laser beam and provide the local oscillator.B.
Narrow-band dye laser(a)
An essential requirement for high-resolution
FIB
stud-ies is a laser linewidth much less than theR,
opticalhomogeneous linewidth
of
—
20 kHz (at fieldsof
-4
kG).
Since the linewidth
of
our Coherent 699-21ring dye laseris
—
1 MHz peak to peak (P.P.
) [Fig. 2(a)],modificationsto the laser were necessary to reduce this width. The
frequency-modulation (FM) method
of
stabilization, which employs an intracavity phase modulator(AD*P),
was used. The system was simultaneously locked to the Coherent low finesse Fabry-Perot (FP) interferometerof
width
of
-3
GHz and an additionalFP
interferometerof
width 1.5 MHz. The latter
FP
interferometer as well as another one used for linewidth measurements were wrapped in a lead-lined foam sheet and placed in hermet-ically sealed enclosures. The lock-upFP
was a Burleigh ModelCFT-100,
constructedof
super Invar and tempera-ture stabilized within0.
01'C.
All components were mounted on a Newport air-mounted table. The servoelectronics resembled that
of Ref.
23except that thelow-frequency circuitry was not used. Instead the
low-frequency error signal was fed into the first operational amplifier
of
the Coherent 699-21 lock-up circuit. This double-lock scheme was especially resistant to external perturbations. A measurementof
the resulting laser linewidth is shown in Fig. 2(b) which gives aP.P.
linewidth
of
(2
kHz for the 1-ms periodof
observation.For
longer times (—
100ms), theP.P.
linewidth increasedto
—
100 kHz. This was due to remaining vibrational eAects on the observation and/or locking cavities in the frequency range &20 Hz. However, this longer-termji-tter was presumably
of
no significance for the measure-ments in which an individual pulse preparation andFID
decay sequence were completed in atime-200
psec.
200kHz VERT.MAGNIFICATION =1 FM LOCK 100Nsec vu WH
~
DIG IT IZAT ION +
AMPLITUDE NOISE 8kHz
10kHz
VERT. MAGNIFICATION =20
FIG.2. Time dependence ofthe laser frequency obtained by measurement of the intensity transmitted through a Fabry-Perot (FP) interferometer with the laser tuned to the 50%
transmission point ofthe FPinterferometer. A Coherent ampli-tude stabilizer model 307was used to reduce amplitude
fluctua-tions to a frequency-equivalent value of 4 kHz. (a) Normal Coherent 699-21 ring dye laser. (b) FM-stabilized Coherent 699-21ring dye laser.
39 RIMENTAL TEST OF THEOPT1CAL BLOCH EQUAT1ONS .
C. Measurement and analysis methods RABIFREQ. =20kHz
3995
2'
2T
b 1T2
where T2 is the dephasing time
of
15psec measured bp n echoes.
For
low excitation intensity, we foundOBE
result.t at
T,»
T,
/4 and hence6~1/2~T
the norma 1At the highest available dye-laser power (50—100mW), the Rabi frequency, 0,
/2~,
was measured by observationof
the nutation wiggles at the leading edgeof
theexcita-tion pulse. The intensity in the sample was adjusted to
the desired maximum (
—
100 kHZ) Rabi frequency by weakly focusing the beam to a diameterof
1—2 mm.These values are consistent with calculations using the
Rabi equation 0,
/2vr=2pF
/h wherep=
=4.
2X
10 D isthe
x
or y componentof
the dipole moment andE
is the circularly polarized field.FID
decays were then aver-aged and recorded for a numberof
excitation powers determined by calibrated attenuators.For
each Rabi fre-quency, 256 traces were averaged at 20Hz with the laser tuned to theR,
line and also off the line allowingsub-traction
of
a small background arising fromrf
switching transients. This subtraction as wellwe as a regression analysis fit to a three-parameter exponential decay curve2
+8
exp(—
t/T„b,
),were done separately on aHP9000model 520 computer.
For
a measured decay timeT,
b,of
theFID
intensity, the power-broadened hole linewidth6
(HWHM) is given by I— CO Z'. LU I— Z' Q LL o1—
O 0 0 U3 Z: LU Z'9
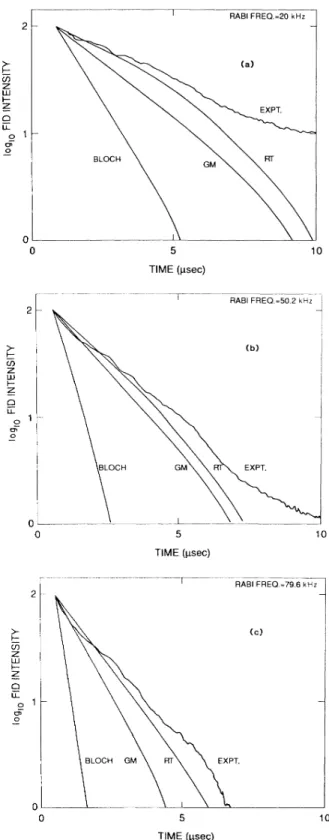
LL o O TIME(@sec) 10 RABIFREQ. =50.2kHz D. ResultsFigure 3shows examples
of
the data obtained for vari-ous Rabi frequencies. Also plotted are numerical calcula-tions for the normal Bloch, GM andRT
theories assum-curves decay approximately exponentially showing a slight modulation about the mean decay calculatcua
edf
rome nonlinear regression analysis. A summary
of
the inewidth dependence on Rabi frequency is given inFig.
4.
The data scatter is in part due to the problemof
fittingon exponential curve to the data as well as due to the fluctuations introduced by the local-oscillator
configuration as discussed earlier. Finally, we found that single-shot data agreed with those averaged at 20 Hz within
30%;
however, the SNR was rather poor.0 0 Cf) LU I— Q o 1 TIME(@sec) 10 RABIFREQ.=79.6k Hz
IV. DISCUSSION AND CONCLUSION
Thehe free-induction
f
decay measurementsof Fig.
4indi-cate a hole width variation with intensity similar to that departure from the saturation behavior predicted by the conventional Bloch equations. This saturation is, in both
cases, approximately described by the GM or
RT-modified
OBE,
with acorrelation time ~=
T
. However suchuch a correlation time is outside the limitsof
the GM theory (which re'
quires
r,
((
T2)or predictsnonexponen-tial photon and rotary echo decays' t t 2O'2'
cays contrary to experi-ments. '
For
example, photon echoes display
exponen-0
0 10
TIME(psec)
FIG. 3. Experimental and theoretical plots of free-induction-decay intensity vs time. Forthe Gauss-Markov (GM)
and random telegraph (RT) theoretical plots, a (limiting, see text) correlation ti
curve isobtained from the standard optical Bloch equations. A
ec is use in t e calculations.
pulse excitation time of 200 psec is us d th 1 1
The experimental curve is the result of256 averages. (a) Rabi
frequency
=20
kHz, (b} Rabi frequency=50.
2 kHz, and (c) Rabi frequency=
79.6 kHz.3996 A. SZABO AND
T.
MURAMOTO 39 100+
3/2~+
1/2 ——dc LEVEL N 50 Cl UJz
I— CO Z,' LLj I— z'0
1Oz
(3 LLI O O 0 0 I PULSE SPACING ( p.s) 20 40 60 RABIFREQUENCY (kHz) I 80FIG. 5. Calculated photon-echo time dependence (Ref. 21) for the
3,
(+
—,')~E(+
—,' )transition in ruby for a field of 4.0kG applied along the c axis. Dephasing time is infinite. The dc
level indicates the time-independent part ofthe echo intensity.
FIG.
4. Optical linewidth (HWHM) ofthe prepared hole vsRabi frequency
0/2~
for the 3&(—
—')
E(
—
—')
transition in dilute ruby (0.0034 wt.% Cr203) with a field of—
3.5 kG ap-plied along the c axis. Theoretical curves for the normal Bloch,Gauss-Markov (GM), and random telegraph (RT) models are also shown assuming ~,
=
T2=15
@sec for GM and RT. The point designated by an X at zero Rabi frequency is obtained from a photon-echo measurement.tial decays over three to four orders. Our conclusion is
that these particular Markovian dephasing models can-not consistently explain the
FID
and echo data. Howev-er, more general Markov models with various frequency-fluctuation kernels' remain to be numericallyinvestigat-ed.
Finally we speculate on whether modeling
of
the de-phasing process by "sudden-jump,"
spin-flip-induced fre-quency shifts is avalid physical picture forsolids. Alter-native pictures ' '- viewdephasing as a modulation or
quantum-interference process which, because ofthe com-plexity
of
the large numberof
interactions, never resultsin return
of
an initially induced coherence. An indicationof
this kindof
behavior has appeared in earlier ' calcula-tionsof
echo modulation for the3
z(+
—)~E(+
—,' )transition in ruby. We reproduce the result
of
thiscalcu-lation in Fig. 5. Generally echo modulation due to
hyperfine (or superhyperfine) interactions is described by
a dc or time-independent term ' and a time-dependent one which contains sum and difference frequencies
of
the ground- and excited-state hyperfine frequencies. Thetime-dependent terms describe a modulation
of
the echo around the dc level. Becauseof
the large spin mixing for this transition, the dc term in Fig. 5is some ten ordersof
magnitude below the zero-time-echo value. While this
appears to lead to dephasing
of
the echo in the first—
100nsec, it should be stressed that this is a deterministic quantum interference effect unrelated to stochastic de-phasing. The calculation
of
Fig. 5 does not include anystochastic mechanisms. The Hamiltonian for the system is written as
Ho
Hcr+
g
(HA[+Her
Ai+HAi A—i),
A1
where the Cr-Al interaction arises from exchange and di-polar effects and the Al-Al interaction is dipolar. In echo
modulation calculations, the H~~ A~ terms are omitted which permits an analytical solution
of
the problem.Of
course it is these terms which give rise to the host spin
flipping. In the quantum interference picture, inclusion
of
these terms would presumably push the dc echo termto zero. Alternately, we could imagine that the dc term
would undergo an exponential decay which is the ad hoc procedure used ' to compare theoretical and experimen-tal modulated echo decays.
In conclusion, we have found that the Gauss-Markov
or random-telegraph modifications
of
the optical Blochequations do not consistently describe free-induction and
echo-decay measurements with a single correlation time for the assumed stochastic frequency fluctuations. It is
suggested that a nonstochastic model involving chaotic
quantum-interference effects may be useful to study. ACKNOWLEDGMENTS
Helpful discussions with Professor
T.
Hashi andPro-fessor
T.
Endo are gratefully acknowledged as is the ex-pert technical assistanceof
J.
Froemel.39 EXPERIMENTAL TESTOF THEOPTICAL BLOCH EQUATIONS. . . 3997
'Permanent address: Shiga University, Otsu 520,Japan.
R. G. DeVoe and
R.
G. Brewer, Phys. Rev. Lett. 50, 1269(1983).
A.Szabo, U.S.Patent No. 3896420 (22 July 1975);G.Castro,
D. Haarer,
R.
M. Macfarlane, and H. P. Trommsdorf, U.S.Patent No. 4101976 (18July 1978).
W.
E.
Moerner,J.
Mol. Electron. 1,55 (1985),and references therein.4W.
B.
Mims, in Electron Paramagnetic Resonance, edited by S.Geschwind (Plenum, New York, 1972), pp. 263—351.
5R. G. DeVoe, A. %"okaun, S. C. Rand, and
R.
G. Brewer, Phys. Rev.B 23, 3125 (1981).E.
Hanamura,J.
Phys. Soc. Jpn. 52, 2258(1983).M.Yamanoi and
J.
H.Eberly, Phys. Rev.Lett. 52, 1353(1984);J.
Opt. Soc.Am B1,751(1984).8J.Javanainen, Opt. Commun. 50,26(1184).
A. Schenzle, M.Mitsunaga,
R.
G.DeVoe, andR.
G. Brewer, Phys. Rev.A30,325{1984).' P.
R.
Herman and R. G.Brewer, Phys. Rev.A32,2784(1985).K.
Wodkiewicz andJ.
H.Eberly, Phys. Rev.A32, 992 (1985).P.
R.
Berman,J.
Opt.Soc.Am B3,564(1986); 3,572(1986).' M.Yamanoi and
J.
H.Eberly, Phys. Rev. A34,1609(1986). '4A. Szabo andT.
Muramoto, Phys. Rev. A37,4040(1988).' P.A. Apansevich, S.Ya. Kilin, A. P.Nizovtsev, and N. S.
Onishchenko, Opt. Commun. 52, 279(1984).
' A.Schenzle, N. C.Wong, and
R.
G.Brewer, Phys. Rev.A21, 887{1980).' P.
E.
Jessop and A.Szabo, Phys. Rev.B 26,420(1982).'
R.
M.MacFarlane,R.
M.Shelby, and R. L.Shoemaker, Phys.Rev. Lett. 43,1726(1979).
'
T.
Muramoto and A.Szabo, Phys. Rev. A38,5928(1988).OS.Meth, Ph.D.dissertation, Columbia University, New York, 1977.
A.Szabo,
J.
Opt. Soc.Am B3, 514 (1986).R.
W.P.Drever,J.
L.Hall,F.
V.Kowalski,J.
Hough,G.
M. Ford, A.J.
Munley, and H. Ward, Appl. Phys. B 31, 91 (1983).J.
Helmcke, S.A. Lee, and J~ L.Hall, Appl. Opt. 21, 1686(1982)~
24Calculated from the data in P.
E.
Jessop and A. Szabo, inLaser Spectroscopy V, edited by A.
R.
W. McKellar,T.
Oka, and B. P.Stoicheff (Springer-Verlag, Berlin, 1981),p. 408. An earlier estimate gave p=
4.8X10 'D for theA2(+~)~E{+
—,')
o transition. SeeS.L.McCall andE.
L.Hahn, Phys. Rev. 183,457(1969).
25J. P.Hurrel and
E.
R.
Davies, Solid State Commun. 9,461(1961).