HAL Id: hal-02396286
https://hal.archives-ouvertes.fr/hal-02396286
Submitted on 5 Dec 2019HAL is a multi-disciplinary open access archive for the deposit and dissemination of sci-entific research documents, whether they are pub-lished or not. The documents may come from teaching and research institutions in France or abroad, or from public or private research centers.
L’archive ouverte pluridisciplinaire HAL, est destinée au dépôt et à la diffusion de documents scientifiques de niveau recherche, publiés ou non, émanant des établissements d’enseignement et de recherche français ou étrangers, des laboratoires publics ou privés.
Diana Zindel, Claire Vol, Odile Lecha, Isabelle Bourquignon, Merve Bilgic,
Marion Vereecke, Fabienne Charrier-Savournin, Maité Romier, Eric Trinquet,
Jean-Philippe Pin, et al.
To cite this version:
Diana Zindel, Claire Vol, Odile Lecha, Isabelle Bourquignon, Merve Bilgic, et al.. HTRF® total and phospho-YAP(Ser127) cellular assays. The Hippo pathway: Methods and Protocols, 1893, pp.153-166, 2019, Methods in Molecular Biology, �10.1007/978-1-4939-8910-2_13�. �hal-02396286�
COVER PAGE
Corresponding author: Name:
Laurent Prézeau Affiliation :
Institut de Génomique Fonctionnelle (IGF), CNRS, INSERM, Univ. Montpellier, Montpellier, France. Email:
HTRF® total and phospho-YAP(Ser127) cellular assays
Diana Zindel1, Claire Vol1, Odile Lecha1, Isabelle Bequignon1, Merve Bilgic1, Marion Vereecke1, Fabienne Charrier-Savournin2, Maïté Romier2, Eric Trinquet2, Jean-Philippe Pin1, Julie Pannequin1, Thomas Roux2, Elodie Dupuis2, Laurent Prézeau1
1 Institut de Génomique Fonctionnelle (IGF), CNRS, INSERM, Univ. Montpellier, Montpellier, France.
2 Cisbio, Codolet, France.
Key words: YAP phosphorylation, YAP-S127-Phosphorylation-directed antibodies, Antibody-based assay, Resonance energy transfer, HTRF®
Abstract
The YAP protein is a co-transcription factor increasing the expression of genes involved in cell proliferation and repressing the expression of genes important for cell differentiation and apoptosis. It is regulated by several inputs, like the Hippo pathway, through the action of kinases that
phosphorylate YAP on several residues. The level of phosphorylation of the residues Serine 127 (S127) of YAP is generally assessed in cellular models, native tissues, and organs, as a marker of YAP activity, location, and is regulated by numerous partners. This phosphorylation event is classically detected using a western blot technical approach. Here, we describe a novel approach to detect both the relative amount of total YAP (T-YAP assay) and the phosphorylation of the residue S127 of YAP (S127-P-YAP assay) using a HTRF®-based method. This easy-to-run method can easily be
miniaturized and allows for a high throughput analysis in 96/384 well plate format, requiring less cellular material, and is more rapid than other approaches.
1. Introduction
The Hippo-YAP-TAZ pathway is a potent regulator of physiological processes controlling organ size as well as cellular proliferation and differentiation. Deregulation of this pathway is frequently
associated with anomalous cellular growth leading to cancer [1]. Thus, accurate assessing of the activity of this pathway is crucial to better understanding of its function and to perform screening of compounds and setup strategies to control it. The Hippo pathway comprises a kinase module and a transcriptional module. The kinase module is the major regulator of YAP/TAZ transcriptional module activity [2–4]. By phosphorylation mostly through LATS 1/2 kinases YAP and TAZ co-transcription factors are retained in the cytosol and degraded and thereby the transcriptional module is inactivated (Figure 1). Thus, there is a crucial need to identify inputs and screen bio-active molecules that could modulate the Hippo-YAP/TAZ pathway in pathological processes like cancer, leading to generating innovative therapeutic anti-tumoral strategies. In the present chapter we present an innovative HTS-applicable HTRF® approach to determine YAP expression and YAP activity by its phosphorylation status of the residues S127 (Figure 1) [5], generally assessed in cellular models, native tissues, and organs, as a marker of YAP activity, location, and regulation by numerous partners.
Resonance energy transfer (RET)-based biophysical methods like FRET and BRET (for Förster- and Bioluminescence Resonance Energy Transfer, respectively) have been used by many laboratories to generate signaling assays. The physical principle states that an excited donor fluorophore that displays compatible spectra with another fluorophore (called acceptor) can transfer its energy to the latter in a non-radiative manner by dipole-dipole interaction. FRET requires (I) that the integral of the excited donor´s emission spectrum overlaps with the integral of the acceptors absorption spectrum, (II) that both fluorophore are in close distance to one another in the range of a few nm, and (III) that the transition dipole orientation of the donor and the acceptor are approximately parallel to each other [6]. Thus, signaling assays are built on variation of distance or orientation of two fluorophore attached to the signaling proteins of interest (for example, G protein BRET assays, EPAC cAMP FRET assays,
systems, these methods display several limitations. Indeed, the BRET or FRET donor and acceptor fluorophore are generally luminescent and fluorescent proteins (Luciferase, Green Fluorescent Protein (GFP) variants, etc.) that need to be fused to the proteins of interest and then expressed by the cells after transfection of the encoding plasmids. Second, the absorption and emission spectra of the donor and acceptor fluorophore are not very well separated, meaning that excitation of the donor will lead to a background excitation of the acceptor (cross excitation). Moreover, the emission spectrum of the acceptor is contaminated by the emission of the donor (bleed through).
To overcome these issues, we used the Homogenous Time Resolved FRET (HTRF®) (Figure 2), based on RET between a rare earth Europium [10] or Terbium cryptate as a donor fluorophore and a Cy5-like dye (D2) as an acceptor fluorophore[11–13] . As an advantage, this type of donor displays a long fluorescence emission lifetime in the millisecond range (in comparison to the nanosecond range of standard fluorophores) (Figure 2), allowing a recording of FRET signal in a time-gated manner (Time-Resolved FRET or TR-FRET). Indeed, recording the TR-FRET signal 50µsec after the excitation of the donor allows the removal of the background arising from both the auto-fluorescence of the cells and the fluorescence of the acceptor, as their fluorescence is rapidly negligible. As such, TR-FRET signal can be measured without washing out the reagents, then in a homogenous way (HTRF®). In addition, considering that this pair of donor-acceptor displays optimal compatible spectral properties, that the D2 acceptor emits light at wave lengths where the donor emission if barely detectable, TR-FRET provides a good signal-to-noise ratio compared to most other RET methods. Thus, HTRF® is used to generate signaling assays suitable for HTS (
https://www.cisbio.com/drug-discovery/htrf-technology) [14,15]. Four main advantages can be pointed out: first HTRF® displays a
good signal to noise ratio due to its properties explained above; second, HTRF® assays are easy-to-run assays, avoiding purification or washing steps, allowing miniaturizing, and thus are ideal for HTS; third, for most of the assays, great specificity is given by a coincidence detector principle; and fourth, such assays are ideally suited to record endogenous signaling events in native systems. Furthermore, classical FRET assays are limited by the relative orientation of the fluorophores, whereas there is minimal orientation constraint as terbium has multiple electronic transitions [16]. For many assays, the coincidence detection is due to the use of two different antibodies, one recognizing a general state of
the signaling protein of interest, and the other one recognizing an active state (e.g. phosphorylated state) of the signaling protein of interest. By using these antibodies being labelled by either donor or acceptor TR-FRET fluorophore, the TR-FRET signal is recorded only when both antibodies are bound to the signaling protein of interest thereby highly reducing any non-specific signal due to binding to non-specific targets of each antibody. This is typically the case for the S127-P-YAP assay. Note that, for T-YAP assay, the coincidence detector is due to the binding of both antibodies to the same protein whatever its active-inactive state (see below). In such sandwich assays [15], normalized TR-FRET signal is generated through energy transfer between two labelled antibodies, and the larger the amount of target produced, the higher the normalized FRET signal. The TR-FRET signal measured
ratiometrically is then proportional to the quantity of target produced.
In the present chapter, we describe the HTRF® protocol for two assays, one detecting the total amount of YAP protein (T-YAP assay), and one detecting the Serine127 phosphorylation state of the protein YAP (S127-P-YAP assay) (Figure 3). T-TAP assay will then be used 1- to determine the relative amount of YAP in different samples and its regulation over time, and 2- to help normalizing the level of phosphorylation of YAP in samples, especially when regulated by drugs or other experimental conditions.
2. Materials
Some of the material is common for both T-YAP or S127-P-YAP assays except the antibodies. 2.1. Sample preparation (HEK293 cells)
1- Phosphate-Buffered Saline (PBS) (Lonza, Basel, CH).
2- 96 wells black plate with black bottom (CellStar®; Greiner, Kremsmünster, AUT). Note that 384-well plates could also be used depending on the type of cells and the level of YAP expression (Note 1).
3- HEK293 cells. In the present chapter/section, the protocol will be described for HEK293 and can be adapted to any other cell types, heterologous or primary cells (cultured or freshly isolated), and even pieces of tissue (Note 1).
4- Culture medium for HEK293 cells: Complete Dulbecco’s Modified Eagle’s Medium (DMEM) medium: DMEM supplemented with 10% foetal bovine serum, 1% penicillin/streptomycin and 1% non-essential amino acids. All the products used for cell culture are purchased from Gibco/BRL-Life Technologies/Thermo Fisher Scientific (Waltham, MA, USA).
2.2. YAP detection
1- Stimulation agents, agonists and inhibitors as required by the scientific project
2- Antibodies raised against YAP and labelled with donor or acceptor HTRF® fluorophore (Cisbio, Codolet, FR). Two antibodies recognizing all forms of YAP but with non-overlapping epitopes for the T-YAP assay. For the S127-P-YAP assay, one antibody recognizing all forms of YAP and one
antibody recognizing the S127-phosphorylated form of YAP. 3- HTRF® detection buffer (Cisbio, Codolet, FR)
4- Lysis buffer 4X concentrated (Cisbio, Codolet, FR) 5- Deionized water
6- Blocking reagent (Cisbio, Codolet, FR) 7- Control cell lysate (Cisbio, Codolet, FR) 8- Low volume 384w plates
2.3. FRET measurements
1- HTRF® compatible reader, e.g., PHERAStarFS® plate reader (BMG Labtechnologies, Ortenberg, GER)
3. Methods
In this chapter, we will focus on the two-plate protocol for adherent cells (Figure 4). Few steps of the protocol for HTRF® YAP assays will differ when cells are grown in suspension, as only one plate will be used (One-plate protocol), and they will be briefly described at the end of the methods Part 3.7. For accurate total YAP and phosphorylated YAP detection, it is crucial to determine the optimal amount of sample to use (Note 1 & 2), and the process to follow will be described in Part 3.6. below, after the description of the different steps to run the protocol for the assays. T-YAP and S127-P-YAP assays can be run separately. Indeed, T-YAP is dedicated to the assessment of the relative amount of
total YAP in samples and its regulation over time or upon treatment, on a time-scale different than that of YAP phosphorylation (Note 3). On the other side, S127-P-YAP assay by itself detects the
phosphorylation state of YAP and its modulations by drugs and experimental conditions. But both T-YAP and S127-P-T-YAP assays can also be run in parallel, and this will be used to normalize the data obtained with the S127-P-YAP assay with that obtained with the T-YAP assay (Note 4). The protocols are the same for both assays except for the required antibodies.
3.1. Preparing and dissolving the reagents
Allow all reagents to thaw before use and centrifuge the vials gently before pipetting the stock solutions. Prepare the working solutions from stock solutions by following the instructions below. 1- Dilute the stock solution of Phospho-YAP-d2-antibody/ phospho-YAP-Europium cryptate antibody (20-fold concentrated antibody stock solution) 1:20 with detection buffer: e.g. dilute 0.05 ml of d2-antibody or phospho-YAP-cryptate d2-antibody solution in 0.95 ml of detection buffer.
2- Dilute the 4X-concentrated lysis buffer 1:4 in deionized water: e.g. add 1.25 ml of 4X lysis buffer to 3.75 ml deionized water, mix gently.
3- The blocking reagent is provided as 100X concentrated. Dilute the 100X blocking reagent 1:100 in 1X lysis buffer: e.g. add 0.05 ml of blocking reagent to 4.95 ml of 1X lysis buffer. Mix gently. 4- The control lysate is ready to use. It is provided as an internal positive control to determine the assay quality.
3.2. Cell preparation in 96w plates
Cells are plated in 96w plates (but could also be plated in 384w plates, see Part 3.7. on non-adherent cells), but the detection and reading of the HTRF® signal will be performed in low volume 384w plates, to minimize the volume of reagents to be used (donor- and acceptor- fluorophore bearing antibodies).
2- Seed 5-8 x 10⁴ HEK293 cells/well in appropriate (usually black plate with black bottom) 96w plates and incubate them in DMEM supplied with 10 % FCS at 37 °C and 5 % CO2 for 6-8 h until they are well attached. For each cell line, optimization of cell seeding densities is recommended (Note 1 & 2 and Part 3.6.).
2- Depending on the signaling input you intend to study, a starvation step with serum free medium can be included (Note 5). Wash the cells 1-2 times carefully with serum free DMEM and starve them several hours or overnight in serum free DMEM, 50 µl/well.
3.3. Cell stimulation and lysis
Steps 1 & 2 are required when one wants to assess the effect of exogenous added compounds acting on receptors, enzymes, etc., on YAP phosphorylation and level of expression. Otherwise, directly start at Step 4.
1- Add 50 µl/ well containing or not compounds to be tested, diluted at the desired concentration in serum free DMEM.
2- Incubate at 37 °C and 5 % CO2. A time course study to determine the optimal stimulation time is recommended for each compound or target stimulated. Note that the stimulation incubation time is different when running the T-YAP assay (4h to OVN) separately from the S127-P-YAP assay (usually 30min, but ranges from 10 min to 2 h) (Note 3, Figure 5).
3- Remove the stimulation buffer from the cells, and immediately add 50 µl of lysis buffer/ well. Lysis buffer volume can be decreased down to 25µl if higher volume of lysate is required.
4- Incubate for 30 min at room temperature under gentle shaking (Note 6). 5- Homogenize the lysate by gently pipetting it up and down, avoiding bubbles.
6- Transfer 16 µl of each test condition well from the 96w cell-culture plates, onto a low volume 384 w white plate. Depending on the cell line used, it may be necessary to dilute the cell lysate to ensure samples are within the assay linear detection range (Note 1 & 2 and Part 3.6.).
7- Transfer 16 µl of the control lysate for S127-P-YAP or total T-YAP assays, for positive control conditions.
3.4. Conjugate-Antibody addition and signal detection
1- For T-YAP detection, mix 2 µl of diluted anti total YAP-d2 antibody with 2 µl of diluted anti-total YAP-Europium cryptate antibody. Add 4 µl of the mix to the 16 µl of lysate for a final volume of 20 µl / well for the detection of the total endogenous YAP proteins in the test condition or in the positive/negative control condition, respectively.
2- For S127-P-YAP detection, mix 2 µl of anti-phospho-d2 antibody with 2 µl anti-total YAP-Europium cryptate antibody. Add 4 µl of the mix to the 16 µl of lysate for a final volume of 20 µl /well to detect the fraction of phosphorylated YAP proteins in the test condition or in the
positive/negative control condition respectively.
2- Incubate at least 2h (up to overnight) at room temperature in the dark.
4- Read the fluorescence emission at 665 nm and 620 nm with an appropriate plate reader displaying an HTRF® detection module (e.g. PHERAstar FS, BMG Labtech, Ortenberg, GER).
3.5. Data evaluation and normalization
HTRF® ratio must be calculated for each individual well. The mean and standard deviation can then be worked out from ratio replicates. Normalization of the data obtained with S127-P-YAP vs T-YAP assays is most of the time required for proper analysis (Note 4, Figure 6).
1- Calculate the ratio between the emission at 665 nm and the emission at 620 nm from raw data obtained with the plate reader:
HTRF® ratio = [(Signal 665nm) / (Signal 620nm)] x 104
2- Normalize the HTRF® signal for phospho YAP to the HTRF® signal of total YAP (Note 4). The normalization value can be used to monitor changes in YAP expression versus changes in YAP phosphorylation. This relative value represents the proportion of phosphorylated YAP compared to the total YAP present within the sample, and is then calculated for each well as follows:
Normalization value (P/T) = [(Phospho YAP HTRF® ratio)/(Total YAP HTRF® ratio)] x 100
3.6. Determination of the amount of lysate required for optimal detection with T-YAP and S127-P-YAP (Note 1 & 2)
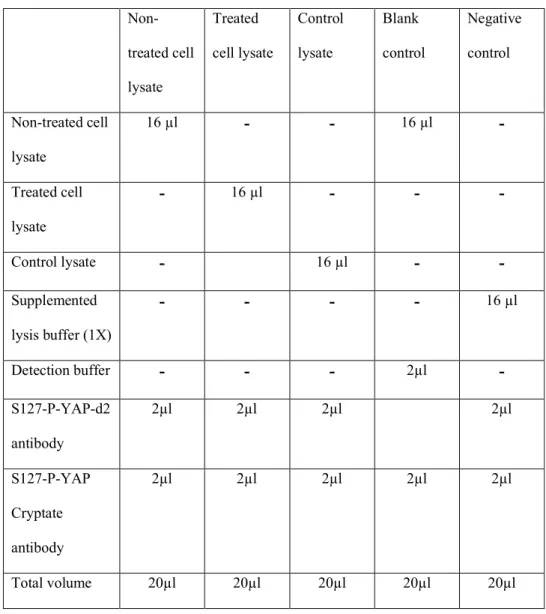
When starting with new cellular model, samples, conditions, etc., it is recommended to determine the amount of lysate necessary to obtain a HTRF ratio lying within the linear range of the assay (Note 2). 1- Transfer a range of 1 to 16 µl of cell lysate (out of the 50 µl in 96w plate) into a 384w plate, add the respective amount of lysis buffer to a volume of 16µl lysate/well. Add the antibody conjugates (Part 3.4. and Table 1) to a total volume of 20 µl/ well.
2- Determine the HTRF values for the negative control by pipetting 16 µl of supplemented lysis buffer (1x) per well, add 2 µl of d2 antibody and 2 µl of
europium cryptate antibody to the final volume of 20 µl per well (Table 1).
3- Determine the HTRF values for the positive control by pipetting 16 µl of control lysate, add 2 µl of d2 antibody and 2 µl of europium cryptate antibody to the final volume of 20 µl per well (Table 1). The ratio of positive control lysate signal/ non-specific signal from the negative control should be ≥ 2 (see step 3.5 for data evaluation).
3.7. One-plate protocol for cells grown in suspension
1- Transfer 8 µl of cells in small volume white 384w plates in appropriate medium (culture medium, for example, depending on the cells) 3.3x10⁵ are generally sufficient but optimal density needs to be determined experimentally (Note 1).
2- Dispense 4 µl of compound (3X) in appropriate medium (culture medium, for example, depending of the cells) and incubate between 10 and 30 min at 37°C. I order to determine the optimal stimulation time, perform a time course study.
3- Add 4 µl of supplemented lysis buffer (4X) and incubate for 30 min at room temperature. The optimal lysis time may vary depending on the cell line (Note 6).
4- Add 4 µl of premixed antibodies prepared in detection buffer. Cover the plate with a sealer and incubate overnight at room temperature.
5- Read the fluorescence emission on a compatible HTRF reader as described in Part 3.4. and 3.5.
4. Notes
Note 1: It is generally required to probe different cellular densities to determine the amount or volume of cell lysate to use. Indeed, cell lines express various level of YAP proteins, and then will generate various level of HTRF® signal. Moreover, the confluency greatly influences the expression and activity of Hippo-YAP/TAZ pathway. High cell density induces YAP phosphorylation in position S127 [17] via contact inhibition [5], resulting in cytosolic sequestration of YAP whereas low cellular density results in nuclear YAP accumulation [18]. This is correlated to the fact that YAP/ TAZ inhibition is the key mechanism of contact inhibition through Hippo kinase activation, that in turn
inhibits and induces degradation of YAP [5,19]. Thus, there is more YAP protein in proliferating cells. That is the reason why the cells types, the conditions of culture and treatment, the confluence,
meaning the cell seeding density, have to be taken into account for optimal conditions of detection. The determination of the amount or volume of cell lysate to be used is described in Part 3.6.
Note 2: It is crucial to obtained values in the linear range of each of both assays to be able to compare data. This is crucial to precisely detect any regulation of YAP expression or YAP phosphorylation upon stimulation by drugs, upon conditions of culture, etc., as the variation of signal has to stay in the optimal linear range detection of the assay. The linear range values vary depending the biological models, the amount of endogenous YAP, the way the cells or samples are treated, etc. Thus, in order to work properly and get data in the linear range of detection, it is recommended to check the linearity of the data obtained with a range of diluted samples, in addition to the negative controls. This will give the range of variation of signal optimally detected for a given sample model and help adjusting the volume of samples to use for detection.
Note 3: Modulation of total YAP amount and of S127 phosphorylated YAP display a different time-course as illustrated in Figure 5. Indeed, T-YAP is mostly dedicated to assess the relative expression of YAP itself, in different samples, in different conditions, or upon drug actions. In the case of a modulation of YAP expression, the time-course needed to record this variation is in the range of 4h to OVN. By comparison, the time-course for S127 phosphorylation of YAP is in the 10min-2h range. Time-course has to be taken into account when assessing the dynamics of either the YAP protein amount or the YAP phosphorylation regulation.
Note 4: YAP phosphorylation in position S127 and S381 has been shown to activate a phosphodegron resulting in poly-ubiquitination and degradation [20]. Compounds inducing YAP phosphorylation consequently can induce YAP degradation. Hence, measuring S127-P-YAP before and after compound incubation may possible result in an apparent decrease in phosphorylation, due to a reduction of the total protein level. In order to avoid false negative results for detection of S127-P-YAP it is advantageous to normalize the HTRF® result of S127-P-YAP to the HTRF® result determined for T-YAP.
Note 5: Serum-derived factors such as the lipids S1P or LPA are known to be potent small molecule activators of YAP [21]. It has been demonstrated that serum deprivation for several hours induces YAP cytoplasmic retention accompanied by an increase of YAP phosphorylation in position S127. The addition of serum to starved cells leads to a concentration dependent decrease in pS127 YAP phosphorylation resulting in nuclear YAP localization and target gene expression [21,22]. It is therefore recommended to test different serum concentrations or to apply a serum starvation step before probing for YAP activity in cellular systems.
Note 6: Optimal lysis time may be cell line dependent and it is recommended to carefully determine it experimentally by performing a time-course experiment.
Acknowledgements
The work described was made possible thanks to Cisbio and the technological Pharmacology facilities (Plateform ARPEGE Pharmacology Screening Interactom) of Biocampus (IGF). This work has been supported by CisBio (Cooperative research team Eidos, CNRS N°039293 /CBB DRD-09-04 avenant 4), by the Labex EpiGenMed, an « Investissements d’avenir » program (ANR-10-LABX-12-01), the Fondation pour la Recherche Médicale (DEQ20170336747), CNRS, INSERM, and the University of Montpellier.
REFERENCES
1 Cordenonsi, M., Zanconato, F., Azzolin, L., Forcato, M., Rosato, A., Frasson, C., Inui, M., Montagner, M., Parenti, A. R., Poletti, A., et al. (2011) The hippo transducer TAZ confers cancer stem cell-related traits on breast cancer cells. Cell 147, 759–772.
2 Dupont, S., Morsut, L., Aragona, M., Enzo, E., Giulitti, S., Cordenonsi, M., Zanconato, F., Le Digabel, J., Forcato, M., Bicciato, S., et al. (2011) Role of YAP/TAZ in mechanotransduction. Nature 474, 179–183.
3 Azzolin, L., Panciera, T., Soligo, S., Enzo, E., Bicciato, S., Dupont, S., Bresolin, S., Frasson, C., Basso, G., Guzzardo, V., et al. (2014) YAP / TAZ Incorporation in the b -Catenin Destruction Complex Orchestrates the Wnt Response. Cell 158, 157–170.
4 Hansen, C. G., Moroishi, T. and Guan, K.-L. (2015) YAP and TAZ: a nexus for Hippo signaling and beyond. Trends Cell Biol. 9, 499–513.
5 Zhao, B., Wei, X., Li, W., Udan, R. S., Yang, Q., Kim, J., Xie, J., Ikenoue, T., Yu, J., Li, L., et al. (2007) Inactivation of YAP oncoprotein by the Hippo pathway is involved in cell contact inhibition and tissue growth control. Genes Dev. 21, 2747–2761.
6 Shrestha, D., Jenei, A., Nagy, P., Vereb, G. and Szöllősi, J. (2015) Understanding FRET as a Research Tool for Cellular Studies. Int. J. Mol. Sci. 16, 6718–6756.
7 Jares-Erijman, E. A. and Jovin, T. M. (2003) FRET imaging. Nat. Biotechnol. 21, 1387–1395. 8 Comps-Agrar, L., Maurel, D., Rondard, P., Pin, J.-P., Trinquet, E. and Prézeau, L. (2011)
Cell-Surface Protein--Protein Interaction Analysis with Time-Resolved FRET and Snap-Tag Technologies: Application to G Protein-Coupled Receptor Oligomerization. In Signal Transduction Protocols (Luttrell, L. M., and Ferguson, S. S. G., eds.), pp 201–214. 9 Zindel, D., Engel, S., Bottrill, A. R., Pin, J.-P., Prézeau, L., Tobin, A. B., Bünemann, M.,
Krasel, C. and Butcher, A. J. (2016) Identification of key phosphorylation sites in PTH1R that determine arrestin3 binding and fine-tune receptor signaling. Biochem. J. 473, 4173–4192. 10 Lehn, J.-M. and Roth, C. O. (1991) Synthesis and Properties of Sodium and Europium(III)
Units. Helv. Chim. Acta 74, 572–578.
11 Bazin, H., Trinquet, E. and Mathis, G. (2002) Time resolved amplification of cryptate
emission: a versatile technology to trace biomolecular interactions. Rev. Mol. Biotechnol. 82, 233–250.
12 Maurel, D., Kniazeff, J., Mathis, G., Trinquet, E., Pin, J.-P. and Ansanay, H. (2004) Cell surface detection of membrane protein interaction with homogeneous time-resolved fluorescence resonance energy transfer technology. Anal. Biochem. 329, 253–262.
13 Mathis, G. (1995) Probing Molecular Interactions with Homogeneous Techniques Based on Rare Earth Cryptates and Fluorescence Energy Transfer. Clin Chem 41, 1391–1397.
14 Ayoub, M. A., Trebaux, J., Vallaghe, J., Charrier-savournin, F., Al-hosaini, K., Moya, A. G., Pin, J., Pfleger, K. D. G. and Trinquet, E. (2014) Homogeneous time-resolved fluorescence-based assay to monitor extracellular signal-regulated kinase signaling in a high-throughput format. Front Endocrinol 5, 1–11.
15 Scholler, P., Zwier, J. M., Trinquet, E., Rondard, P., Pin, J.-P., Prézeau, L. and Kniazeff, J. (2013) Chapter Seven - Time-Resolved Förster Resonance Energy Transfer-Based
Technologies to Investigate G Protein-Coupled Receptor Machinery: High-Throughput Screening Assays and Future Development. In Prog Mol Biol Transl Sci, pp 275–312. 16 Selvin P, Hearst, J. (1994) Luminescence energy transfer using a terbium chelate :
Improvements on fluorescence energy transfer. PNAS 91, 10024–10028.
17 Meng, Z., Moroishi, T., Mottier-Pavie, V., Plouffe, S. W., Hansen, C. G., Hong, A. W., Park, H. W., Mo, J.-S., Lu, W., Lu, S., et al. (2015) MAP4K family kinases act in parallel to MST1/2 to activate LATS1/2 in the Hippo pathway. Nat. Commun. 6, 8357.
18 Juan, W. C. and Hong, W. (2016) Targeting the Hippo Signaling Pathway for Tissue Regeneration and Cancer Therapy. Genes (Basel). 7, 1–25.
19 Aragona, M., Panciera, T., Manfrin, A., Giulitti, S., Michielin, F., Elvassore, N., Dupont, S. and Piccolo, S. (2018) A Mechanical Checkpoint Controls Multicellular Growth through YAP/TAZ Regulation by Actin-Processing Factors. Cell 154, 1047–1059.
and tumorigenesis : an updated version 862–874.
21 Miller, E., Yang, J., Deran, M., Wu, C., Su, A. I., Bonamy, G. M. C., Liu, J., Peters, E. C. and Wu, X. (2012) Identification of serum-derived sphingosine-1-phosphate as a small molecule regulator of YAP. Chem. Biol. 19, 955–962.
22 Yu, F. X., Zhao, B., Panupinthu, N., Jewell, J. L., Lian, I., Wang, L. H., Zhao, J., Yuan, H., Tumaneng, K., Li, H., et al. (2012) Regulation of the Hippo-YAP pathway by G-protein-coupled receptor signaling. Cell 150, 780–791.
https://www.cisbio.com/drug-discovery/phospho-yap-ser127-total-yap-cellular-assay-kits https://www.cisbio.com/drug-discovery/guideline-htrfr-cell-based-phospho-protein-data-normalization
Table 1
Non-treated cell lysate Treated cell lysate Control lysate Blank control Negative control Non-treated cell lysate 16 µl - - 16 µl - Treated cell lysate - 16 µl - - - Control lysate - 16 µl - - Supplemented lysis buffer (1X) - - - - 16 µl Detection buffer - - - 2µl - S127-P-YAP-d2 antibody 2µl 2µl 2µl 2µl S127-P-YAP Cryptate antibody 2µl 2µl 2µl 2µl 2µl Total volume 20µl 20µl 20µl 20µl 20µlFigure 1
Figure 1: Multiple upstream inputs regulate the Hippo-YAP-TAZ axis through phosphorylation. When phosphorylated, YAP/TAZ are retained in the cytosol. Non-phosphorylated YAP/TAZ translocate into the nucleus, act as transcriptional coactivators and induce target gene expression to control cellular proliferation, differentiation and apoptosis.
Figure 2
Figure 2: HTRF® (Homogeneous Time Resolved FRET) donor, e.g. Eu3+Cryptate, is excited at 337 nm and shows long luminescence lifetime in the range of several hundred µs. After initial excitation the signal is cleared from unspecific short-lived emissions through a delay (50-100µs) between donor excitation and recording of acceptor fluorescence emission. During the measurement, only the stably emitting donor fluorophore and the subsequent activated acceptor fluorophore will be fluorescent. The donor emission signal peaking at 620 nm and acceptor emission signal peaking at 665 nm are
monitored simultaneously. HTRF® values are calculated from 665 nm /620 nm ratios enabling the data to be normalized with respect to between-assay variations.
Figure 3
Figure 3: Overview of the HTRF® assay to detect YAP-S127 phosphorylation in 96w or 384w format based on Förster Resonance energy transfer (FRET). For total YAP detection with the T-YAP assay, the antibody recognizing the S127 phosphorylated form of YAP in the S127-P-YAP assay is replaced by another antibody recognizing all forms of YAP. Cells in suspension or in adherence are exposed to an appropriate stimulus, lysed and incubated with Eu3+Cr -donor labeled and d2-acceptor labeled antibodies raised against total YAP and S127 phosphorylated YAP. After 2 (up to 24 h) incubation with the antibodies, HTRF signal is detected using a plate reader.
Figure 4
Figure 4: Overview of both One-plate and Two-plate assay protocols for non-adherent and adherent cells, respectively.
Figure 5
Figure 5: Time-course for S127 phosphorylated and total YAP detection.
HEK 293 cells stably expressing PAR1 were starved and treated with 100µM of TRAP-6 over a large range of time at 37°C. Cells were lysed for 30 min at room temperature and assessed for YAP
phosphorylated in position S127 and total YAP by HTRF®. Results are displayed as the mean ± S.E.M. performed in triplicates.
S127-P-YAP
T-YAP
HT
RF
ra
tio
(x
10
00
)
S/
B (
m
ax
)
S/
B (
m
ax
)
5 0 10 15 20HT
RF
ra
tio
(x
10
00
)
5 0 10 15 20 1 0 2 3 4 1.2 0 1.4 1.6 0 60 120 180 240 300 0 60 120 180 240 300 Stimulated time (min) Stimulated time (min)Figure 6
Figure 6: YAP activation monitored by HTRF.
HEK 293 cells stably expressing PAR1 (A) or endogenously expressing S1P receptors (B) were starved overnight and treated with the indicated concentration of TRAP-6 or S1P for 30 min at 37°C. Cells were lysed for 30 min at room temperature and assessed for YAP phosphorylated in position S127 and total YAP by HTRF®. Results are displayed as the mean ± S.E.M. performed in triplicates. In (A), all data from S127-P-YAP and T-YAP assays and the normalized data are shown.