Publisher’s version / Version de l'éditeur:
Vous avez des questions? Nous pouvons vous aider. Pour communiquer directement avec un auteur, consultez la première page de la revue dans laquelle son article a été publié afin de trouver ses coordonnées. Si vous n’arrivez pas à les repérer, communiquez avec nous à [email protected].
Questions? Contact the NRC Publications Archive team at
[email protected]. If you wish to email the authors directly, please see the first page of the publication for their contact information.
https://publications-cnrc.canada.ca/fra/droits
L’accès à ce site Web et l’utilisation de son contenu sont assujettis aux conditions présentées dans le site
LISEZ CES CONDITIONS ATTENTIVEMENT AVANT D’UTILISER CE SITE WEB.
Research Report (National Research Council of Canada. Institute for Research in
Construction), 2003-06-25
READ THESE TERMS AND CONDITIONS CAREFULLY BEFORE USING THIS WEBSITE.
https://nrc-publications.canada.ca/eng/copyright
NRC Publications Archive Record / Notice des Archives des publications du CNRC :
https://nrc-publications.canada.ca/eng/view/object/?id=a9628be1-61de-43f8-89ec-7355f5757fc2 https://publications-cnrc.canada.ca/fra/voir/objet/?id=a9628be1-61de-43f8-89ec-7355f5757fc2
NRC Publications Archive
Archives des publications du CNRC
For the publisher’s version, please access the DOI link below./ Pour consulter la version de l’éditeur, utilisez le lien DOI ci-dessous.
https://doi.org/10.4224/20386293
Access and use of this website and the material on it are subject to the Terms and Conditions set forth at
Literature Review on Design Fires
Bwalya, A. C.; Bénichou, N.; Sultan, M. A.
Literature Review on Design Fires
Bwalya, A.C.; Bénichou, N.; Sultan, M.A.
IRC-RR-137
June 25, 2003
ABSTRACT
This literature review was carried out to establish the state-of-the-state in the area of design fires and identify future research requirements. The work was necessitated by the need to define simulated fires (design fires) and an experimental set-up for evaluating the fire performance of Canadian houses. The main parameters affecting fire development in small rooms are identified, together with the commonly-employed methods for characterizing design fires for pre-flashover and post-flashover stages of fire development. The majority of methods employed in characterizing post-flashover design fires were found to be based on parametric equations, which attempt to correlate experimental data from various sources, whereas t-squared fires are the most widely used design fires for the pre-flashover stage.
Numerous combustion data, from fire tests involving real and mock-up furniture, from various laboratories around the world, was found in the literature. However, it is not possible to collate the data in a neat and organized fashion due to the extremely large variations in furniture designs and materials. Similarly, many fire load surveys have been published over the last two decades and a large variation in fire loads was found, mainly due to geographical differences and the subjective manner in which fire loads are quantified. Most importantly, the literature review revealed an absence of fire load data for residential and commercial occupancies in Canada.
TABLE OF CONTENTS
ABSTRACT ... i
LIST OF FIGURES ... ii
LIST OF TABLES... iii
NOMENCLATURE ... iv
1 INTRODUCTION... 1
2 FIRES IN SMALL ROOMS... 1
2.1 Stages of Fire Development... 1
2.2 Ventilation-Controlled Combustion... 4
2.3 Fuel-Controlled Combustion... 6
3 DESIGN FIRES...7
3.1 Pre-Flashover Design Fires... 8
3.2 Post-Flashover Design Fires ... 12
3.3 Heat Release Rates ... 16
3.4 Fire Loads ... 21
4 MATHEMATICAL FIRE MODELING... 24
4.1 Zone Models ... 24
4.2 Field Models ... 25
5 FIRE SCENARIOS... 25
5.1 Canadian Fire Statistics ... 26
5.2 Tenability Limits... 27
6 CONCLUSIONS...27
LIST OF FIGURES
Figure 1. Stages of Fire Development in a Room in the Absence of an Active Suppression
System ... 2
Figure 2. t-Squared Fires, Rates of Energy Release ... 9
Figure 3. Fuel Surface Controlled Double t-Squared Design Fire ... 10
Figure 4. Ventilation-Controlled Double t-Square Design Fire ... 10
Figure 5. A More Complex Design Fire ...10
Figure 6. Separation Distance, R ... 11
Figure 7. Time-Temperature Curves for Different Ventilation Factors and Fire Loads ... 13
Figure 8. Rate of Heat Release for the Two Sofas Described in Table 3 ... 17
Figure 9: Illustration of Typical HRRs as Function of Time Measured in the Furniture Calorimeter for a Selection of European Upholstered Furniture and Mattresses... 18
Figure 10. Triangular Representation (Shaded Area) of the Rate of Heat Release of an Item ... 20
LIST OF TABLES
Table 1. Categories of t Squared Fires ... 9 Table 2. Constants for use in the Design Fire Given by Equation (18) ... 9 Table 3. Composition and Effective Heat of Combustion of Two Sofas Given in Sardqvist’s Database ... 18 Table 4. Maximum (Peak) Rates of Heat Release from some Typical Items ... 19 Table 5. Fire Load Energy Densities ... 22 Table 6. Fire Loads in Terms of Calorifically Equivalent Mass of Wood for Various
Occupancy Types ... 23 Table 7: Typical Fire Load Density for Various Types Of Buildings ... 23 Table 8. Summary of Fire Load Data in Offices, Residential Rooms and Motels ... 24
NOMENCLATURE
Af Surface area of fuel element (Ao) Ao Area of a ventilation opening (Ao) At Total internal area of bounding surfaces of an enclosure (m2)
b A parameter in Equation (21), =
k c
ρ
p (W.s0.5/m2K) bref Reference value of b (W.s0.5/m2K)C Factor in Equation (35) (-)
d
C Orifice constriction coefficient (-)
c Constant used in Equation (32) (-)
p
c
Specific heat capacity (kJ/kg.K)o
H Height of ventilation opening (m)
h Heat transfer coefficient (kW/m2.K)
o
F Opening factor (m1 2)
ref
F Reference value of the opening factor (m1 2) v
F Ventilation factor (m5 2)
g Acceleration due to gravity (m/s2)
k
Thermal conductivity (kW/m.K) pk
Pyrolysis coefficient (k
g/s.m
5 2) v L Heat of gasification (kJ/kg) cM
Mass of single combustible item (kg)f
M Total mass of fuel (kg)
f
M′′ Fire load per unit area (kg/m2) f
M
′′ Mean fire load (kg/m2)m& Rate of mass flow (kg/s)
Q& Heat release rate (kW)
FO
Q& Heat release rate to cause flashover (kW)
o
Q& Reference heat release rate (kW)
t
Q
Total fire load energy density (MJ/m2) bsq
&′′ Bench-scale heat release rate (kW/m2)i
q&′′ Incident radiation heat flux (MW/m2)
R Radial distance (m)
Rp Rate of pyrolysis (-)
s
r
Stoichiometric air to fuel ratio (-) stoichS
Stoichiometric oxygen to fuel ratio (-) sc Shape constant used in Equation (31) (-)T Temperature (oC)
To Reference temperature (oC)
b
t
Duration of burning (s)d
t
Duration of heating phase, given by Equation (25) (hrs) ot
Time to reach a reference heat release rate (s) mt Time at which maximum temperature occurs (min) *
t
Fictitious time used in Equation (20) (hrs) oW
Width of ventilation opening (m)d
X
Height of hot and cold layer interface (m)N
X Height of neutral plane (m)
2 a,O
Y
Mass fraction of oxygen in air (-)GREEK LETTERS
α Growth or decay constant for a t-squared fire (W/s) β A constant given by Equation (28) (
K s
-1 6)δ Shape constant (-)
γp Partial coefficient (used in Equation (18)) (-) Φ Ventilation parameter given by Equation (6) (kg/m.s)
p
ν
Surface regression coefficient (m/s)ρ
Density (kg/m3)σ
Standard deviation ch
∆ Effective heat of combustion (kJ/kg)
SUBSCRIPTS a Air air Air b Physical boundary f Fuel fs Full-scale g Pertains to hot gas max Maximum value R Room condition ∞ Ambient condition
ABBREVIATIONS
HRR Heat release rate Max Maximum PU Polyurethane
1 INTRODUCTION
Countries worldwide recognize the benefits of performance and objective-based building codes, the introduction of which is imminent in Canada and the US. The move towards performance and objective-based code systems has been brought about by the need for increased flexibility in methods of designing cost-effective buildings, which use innovative construction materials and still maintain fire safety. This has provided the impetus behind design approaches founded on fire safety engineering principles.
Instrumental to such approaches are simulation fires, also known as “design fires”. Design fires are not necessarily new; they have been utilised for many years in the design of smoke management systems. A design fire is essentially a quantitative description of assumed fire characteristics, such as heat release rate, fire size, yield of products of combustion and temperatures, based on appropriate design fire scenarios. A design fire scenario is a qualitative spatial and temporal description of the course of a particular fire, which may also include the impact on the fire of building features, occupants, fire safety systems, the ignition source and process, the growth and spread of fire from the first item ignited, and the decay and extinction of the fire1.
The characterization of appropriate design fires is difficult and has numerous uncertainties owing to the multiplicity of fire scenarios and the complexity of room fire behaviour. Admittedly, a complete analysis of all fire scenarios is impracticable, thereby necessitating the isolation of a manageable group of scenarios for analysis2.
There is presently a concerted international effort, coordinated by the International Organization for Standardization (ISO), towards the development of technical guidelines for the specification of design fires with a view to standardization. ISO/TR 13387 Part 2 1 is one such publication produced by Technical Committee ISO/TC 92, Subcommittee SC4 to provide guidance on the characterization of appropriate design fire scenarios and the specification of design fires. Although the ISO technical reports1,2 provide the most extensive technical discussion pertaining to design fires that can be found in the literature, and reflect the state-of-the-art, they are largely considered to be general guidelines and the onus is on the user to exercise proper engineering judgement 3 in their use.
2 FIRES IN SMALL ROOMS
The stages of fire development in a small room (maximum dimensions: 6 m x 6 m floor area and a height of 2.4-3.0 m)4 have been studied intensely for many years and excellent treatises can be found in the widely available literature4,5,6,7. Nevertheless, a succinct review of the important stages of fire development will be presented in order to lay the groundwork for the discussion on design fires which follows.
2.1 Stages of Fire Development
The propagation of a fire is largely dependent on the rate of mixing the air flowing into the room with the gaseous fuels as they are liberated from the solid fuel. The mixing is primarily due to buoyancy and the turbulent movement of the flames within the resulting column of combustion gases above the fuel bed, which is known as a fire plume. Karlsson and Quintiere5 list the major factors influencing fire development in a room as:
1. strength and location of the ignition source;
2. type, amount, position, spacing, orientation, and surface area of the fuel packages (fire load);
3. size and geometry of the enclosure;
4. size and location of the compartment openings;
5. thermal inertia of the materials constituting the enclosure boundaries. Items (1) and (2) constitute the design fire scenario and are predominately
estimated parameters, whereas items (3), (4) and (5) are prescribed parameters.
Time
Ignition
Incipient Growth Fully-developed Decay
Onset of ventilation-controlled combustion Flashover Fuel-surface controlled combustion H e a t re le a s e r a te Extinction
Figure 1. Stages of Fire Development in a Room in the Absence of an Active
Suppression System
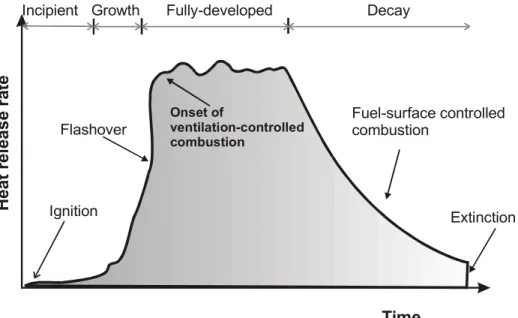
Figure 1 illustrates the generally accepted sequence of fire events, from ignition to extinction, without the intervention of an active suppression system1. Following ignition, there is an incipient phase, the duration of which is heavily dependent upon the strength of the source of ignition and the thermal properties of the combustible materials. These factors influence the likelihood of smouldering turning into flaming. Although smouldering is characterized by slower rates of burning and lower temperatures, it is a significant hazard in building fires because it tends to be inaudible to the occupants and produces sufficiently large quantities of smoke and other toxic species of gases4. For cellulosic fuels, smouldering usually yields more smoke and unburned species per unit mass of fuel than flaming, but the overall generation rate of the combustion products is low because the fuel mass loss rate is also low 8. Flaming can quickly develop from smouldering, resulting in rapid fire growth and spread, and increased production of heat and products of
combustion. In some instances, a flaming fire can cause the room to reach flashover—a phenomenon which occurs when a room attains a temperature of between 500oC and
600oC, corresponding to a heat flux of about 15-20 kW/m2 at the floor level,49 and is characterized by the onset of rapid transition from a localized fire to the combustion of all exposed surfaces within an enclosure. The appearance of flames from an enclosure’s openings is also said to indicate flashover 5.
The amount of heat released from a fire over a given time—the heat release rate— is an important characteristic of a fire. The availability of the air required to sustain
combustion has a significant influence on the severity and duration of the fire. Generally, for the same fire load, the duration of a fire is prolonged and the heat release rate is reduced if the amount of air reaching the combustion zone is reduced, say, by small ventilation openings or a failure of window glasses to break and fall out at the time of flashover, than if the air supply was unlimited. It has been found that the flow of air into a room is proportional to the ventilation factor, Fv (
m
5 2), which is given by:v o o
F =A
H
(1)where Ao is the area of the opening and Ho is the height of the opening. The dependence of the rate of burning on Fv is often expressed in terms of an opening factor, Fo ( 1 2
m
) , given by: v o tF
F =
A
(2)where At (m2) is the total internal surface area of the enclosing surfaces. For a room containing multiple openings, Ao and Ho in Equation (1) are taken to be weighted averages 5.
The heat release rate to cause flashover, (kW), can be approximated using expressions available in the literature, such as Equations (3)
FO Q& 5 and (4) 10: FO v b t
Q = 610 F
&h
A
(3)where
h
bis the thermal conductivity of the boundaries (kW/m2.K).(4)
FO t v
Q = 7.8 A +378 F&
In addition to the simple expressions given by Equations (3) and (4), elaborate mathematical models of flashover can be found in the literature; for example, Zdanowski et al.11 presented a flashover model developed using data from full-scale and bench-scale tests.
Following flashover, fires usually progress rapidly to the fully-developed stage, where the rate of combustion is characterized by very high heat release rates and
temperatures under ventilation or fuel-bed controlled conditions. Naturally, when most of the combustible materials are expended, the heat release rate diminishes and the decay phase ensues.
2.2 Ventilation-Controlled Combustion
The initial progression of the fire is predominately controlled by the amount of fuel available and is said to be fuel-controlled. At some point, usually after flashover, the fire could become ventilation-controlled; that is, the combustion would be controlled by the rate at which air flows through the available room openings. During the decay phase, the fire may revert to the fuel-controlled regime. The transition from a fuel-controlled regime to a ventilation-controlled regime has much significance, and depends on the configuration of the enclosure and the size of the ventilation openings. It is thought to occur when the following condition is met 1:
air f s
m
m
r
=
&
&
(5) where: fm& = mass loss rate (kg/s) air
m
&
= rate of inflow of air (kg/s) sr
= stoichiometric air to fuel ratio.The mass loss rate is synonymous with the rate of volatilization of fuel, which is also known as the rate of pyrolysis.
Harmathy 12 correlated experimental data for fires in enclosures and found that the fuel-surface controlled and ventilation-controlled regimes were defined by
f
0.263
A
Φ ≥
andf
0.263
A
Φ <
, respectively, where Af is the surface area of the fuel, and is a ventilation parameter given by:Φ
1 2 1 2 o og A H
aρ
Φ =
(6)where
ρ
a is the density of air (kg/m3) and g is the acceleration due to gravity (m/s2).Many studies have observed that the burning rate of fuel elements is dependent on the rate of flow of outside air into the enclosure. The mass loss rate or burning rate of wood fuel under ventilation-controlled conditions is widely estimated using the following equation 13:
(7) f
m = 0.092F& v where Fv is the ventilation factor given by Equation (1).
The maximum energy release that can result from given ventilation conditions is obtained by multiplying m&ffrom Equation (7) with the effective heat of combustion for
wood, taken to be approximately 17 MJ/kg 5. The heats of combustion of many other materials of interest in fire science can be found in the literature—the SFPE handbook14 is an example of a good source. Simple empirical correlations such as Equation (7) are considered by some to have serious limitations 4. Feasey and Buchanan 15 argued that Equation (7) was inaccurate because the heat release rate cannot be calculated
accurately since the proportion of pyrolysis products burning outside the enclosure, in a ventilation-controlled fire, is unknown.
If the fire load in the room is known, the duration of burning can be estimated from4: f b f
M
t =
m
&
(8)where Mf is the total mass of fuel available for combustion (kg).
The stoichiometric air flow rate can be estimated from the heat release rate, Q, via & 16 : 2 air a,O c stoich
Q
Q
m =
13100 Y
∆h
s
≈
&
&
&
(9) where: c∆h
= effective heat of combustion of the fuel (kJ/kg) sstoich = stoichiometric oxygen to fuel ratio (kg/kg)2 ,
Y
a O = mass fraction of oxygen in air (approximately 0.232 kg O2/kg dry air). The discussion of the source of values of heat release rates is deferred to Section 3.3.If the heat release rate is unknown, the rate of air flow into the enclosure can be estimated using an equation of the form of Equation (7), but with a different proportionality constant; for example, Thomas and Heselden 17 estimated the constant to be
5 2
0.5 (kg/s.m )
for small openings. The SFPE Handbook 14 lists other expressions that can be used to compute the mass flow rates of the hot gas out of the enclosure and the mass flow rate of air into the enclosure, through either a door or a window. One such expression for calculating the mass flow rate of hot gas out of an opening is:(
)
1 2 3 2 g o g g2
T
T
m
W
2g
1
H - X
3
C
d oρ
T
T
∞ ∞ ∞ =
−
&
N (10) where: gm
&
= mass flow rate of hot gas out of an opening (kg/s)d
o
W
= Width of opening (m) NX = height of neutral plane, explained in Section (m).
The neutral plane is perceived to be the horizontal plane inside the enclosure, that is located somewhere between the higher pressure upper hot gas layer and the lower pressure cooler gas layer beneath it, and at which the pressure is equal to that outside of the enclosure.
Likewise, the influx of air through an opening is given by:
(
)
1 2 1 2 d g N d gX
2
T
m
W
2g 1
X
X
X +
3
C
d oρ
T
∞ ∞ =
−
−
&
N2
(11) where: dX
= height of the interface of the hot and cold layers (m).Equations (10) and (11) are not amenable to hand calculations because both the height to the neutral plane and the interface are unknown, and additional expressions for plume entrainment and energy conservation are required in order to obtain a complete solution. However, such calculations can be carried out in computer fire models.
2.3 Fuel-Controlled Combustion
Ventilation-controlled combustion is not the predominant burning regime
encountered in room fires. The surface area of the fuel may control the rate of burning if ventilation conditions permit air in excess of stoichiometric requirements to enter the room. Expressions have been developed to estimate the heat release rate from fuel-controlled fires based on a knowledge of the fire load and the duration of burning . According to Drysdale 7, the heat release rate resulting from fuel-controlled burning of a combustible item is given by:
i f c v
A
∆h
Q =
L
q
&
′′
&
(12)where q&i′′ (MW/m2) is the incident radiation on the fuel surface (typically assumed to be 70 kW/m2), Afis the exposed surface area of the fuel (m2) and L is the heat of gasification (MJ/kg). The heat release rate can also be calculated using the following expression, which is similar to Equation (12)
v 4 : (13) p f f c
Q =
&
ν ρ A ∆h
(14) 6
p 8.5 10.0 10
ν
= − × −3 DESIGN FIRES
A thorough review of the ISO technical reports 1,2,8 is a prerequisite step for anyone undertaking the task of prescribing a design fire. It is recommended to perform a thorough fire scenario analysis prior to characterizing a design fire. ISO/TR 13387-1:1999(E) 1 contains a comprehensive list of items to consider in identifying design fire scenarios, such as: type of fire, location of fire, potential fire hazards, systems impacting on the fire and probability of occurrence.
A fixed or standard design fire size applicable to all situations is unrealistic 19. The design fire, for a given scenario, has to be determined based on the quantity of fire load, nature and arrangement of combustible materials in the compartment of fire origin. The fire load is an important input variable required to calculate the spread potential of a fire. It is an indication of the quantity of combustibles in an enclosure or the energy that can be liberated upon complete combustion. However, it must be borne in mind that fire load information on its own is insufficient to determine the shape of the heat release rate curve; experimental data must also be used, if available, to properly correlate the controlling parameters which are listed in Section 2.1. The fire load is commonly expressed either as the mass of combustibles per unit floor area (kg/m2) or as the total energy potential per unit internal surface area (MJ/m2) or floor area (also commonly referred to as the Fire Load Energy Density). Based on the total internal area of an enclosure, the total fire load
density,
Q
, is obtained by multiplying the mass of each combustible item with its effective heat of combustion, summing up, and finally dividing by the area of the enclosure, At t5: n i c i t t
M
∆h
Q =
A
∑
(15)where Mi (kg) is the mass of an item.
The fire load largely depends on the type of occupancy under consideration. Klote20 recommends that transient fuels, that is, materials that are temporarily in the space, should not be overlooked in calculating the fire load. It is suggested that the size of the fire chosen is one that is the most likely and also the most severe that can be expected for the combustibles in the enclosure 19,21.
There are two distinct combustion regimes that are considered to be of importance in any fire safety engineering analysis: the pre-flashover and post-flashover regimes. Life safety of humans is of utmost concern during pre-flashover and the design load is typically characterized by the heat release rate, whereas during the post-flashover state it is the structural response of the building and the safety of the firefighters which are crucial, because the prevailing conditions may have already exceeded the tenability limits. During the post-flashover stage, the design load is usually characterized by the temperature-time profiles. The SFPE Handbook 14 lists a number of methods for predicting temperatures for both pre-flashover and post-flashover fires.
Fire development is generally quantified by the heat release rate as a function of time. Once the heat release rate is known, the flame height and the gas temperatures in the room can be estimated using methods available in some of the literature sources already cited.4,5,6,7
3.1 Pre-Flashover Design Fires
The heat release rate during the pre-flashover stage is commonly approximated by the unsteady parabolic curves known as t-squared fires. In a t-squared fire, the burning rate is assumed to vary proportionally to time squared. The NFPA t-squared design fires19, given by Equation (16), are widely referenced in the literature:
2 o o
t
Q = Q
t
&
&
(16) where:Q& = rate of heat release (kW) o
Q& = reference heat release rate (kW), usually taken to be 1000 kW. o
t
= time to reach reference heat release rate (s)t = time after effective ignition (s)
Alternative formulations for t-squared fires, which give similar results to Equation (16) are: (17) 2
Q = t
&
α
2Q =
&
γ α
pt
(18)where α is the fire intensity coefficient (MW/s2) and
p
γ
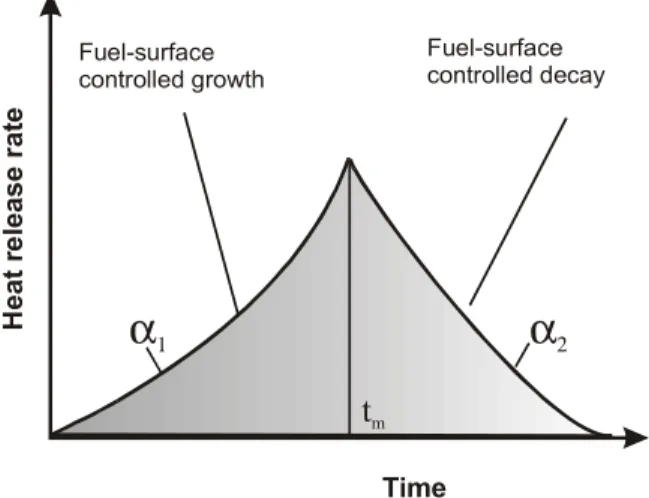
is a partial coefficient, supposedly based on experimental data 3. Values of α for use in Equation (17) are given in Table 1. Table 2 gives the values for use in Equation (18).The various categories of fire growth, which are commonly used, are given in Table 1 and illustrated graphically in Figure 2. Figures 3 and 4 depict double t-squared design fire curves 22 with growth and decay constants and , respectively. The design fire in Figure 3 has both fuel-controlled growth and decay phases conforming to the t-squared profiles. This type of fire is most likely to occur in a large well-ventilated room. The ventilation-controlled fire shown in Figure 4 has double t-squared growth and decay phases, and a steady-state fully-developed burning phase. This type of design fire would occur in a small room. Figure 5 shows a more complex design fire, where one fuel
package is initially ignited, burns, and the radiation output causes an adjacent fuel package to ignite and contribute to the fire.
1
Time from Ignition (s) 0 200 400 600 Hea t Rel ease Ra te (kW) 0 1000 2000 3000 4000 5000 6000 Ultra-fast Slow Medium Fast
Figure 2. t-Squared Fires, Rates of Energy Release
Table 1. Categories of t Squared Fires 1
Growth Rate
Design Fire Scenario Value of α Characteristic time, to (s)
Slow Floor coverings 0.00293 600
Medium Shop counters, office furniture 0.0117 300 Fast Bedding, displays and padded work-station
partitioning
0.0466 150 Ultra-fast Upholstered furniture and stacked furniture near
combustible linings, lightweight furnishings, packing material in rubbish pile, non-fire-retarded plastic foam storage, cardboard of plastic boxes in vertical storage arrangement.
0.1874 75
Table 2. Constants for use in the Design Fire Given by Equation (18) 3
Category of use α (W/s)
Dwellings 12 Hotel 50 Shops, public spaces 190
Schools, offices 50
H ea t re lease r a te Time Fuel-surface controlled growth tm Fuel-surface controlled decay
α
1α
2Figure 3. Fuel Surface Controlled Double t-Squared Design Fire 22
Time Fuel-surface controlled growth t m Ventilation-controlled steady-state phase
α
1α
2 H eat releas e rateFigure 4. Ventilation-Controlled Double t-Square Design Fire 22
Time Contribution of
additional fuel packages
α
4α
1α
3α
2 Heat r e leas e rateNotwithstanding their widespread use, t-squared fires have been criticized by one author 23 as being unrealistic because no engineering methods lend credence to their application. To the contrary, Ghosh 24 found that the t-squared fires were appropriate as design fires in a study of the effect of sprinklers on fires which typically occurred in such occupancies as: offices, supermarkets, carpet stores, libraries, video stores and liquor stores, using simulated layouts. It was also noted that experimentation was the best way to determine the growth rate to be used.
Hoglander and Sundstrom 3 prescribed a pre-flashover design fire for a given scenario and used heat release rate data from fire tests involving upholstered furniture, surface linings, floor coverings and cable trays. They acknowledged that there was a lack of data from complete room fires, and that it was difficult to prescribe design fires because of the extremely large combination of combustibles. In this light, they resolved to develop estimates of characteristic heat release rates of isolated groups of combustibles. Based on European statistics, which revealed that the greatest number of fatalities resulted from fire involving upholstered furniture, they felt that the influence of such furniture should be included in a design fire if it will be present in the occupancy under consideration—a view shared by many workers engaged in fire research.
3.1.1 Potential for Fire Spread
The t-squared fires described in Section 3.1 are typically for a single burning item. It is recommended to increase the size of the design fire if other combustibles are within the separation distance, R, defined by Equation (19) and depicted in Figure 6 19:
1 2 i 1 Q R = 6.85 π q ′′ & & (19) where:
R = separation distance from target to centre of fuel package (m)
Q& = heat release rate from fire (kW) i
q&′′= incident radiant heat flux required for non-piloted ignition (kW/m2 )
Flame
Element orientation normal to R Hemisphere
R
3.2 Post-Flashover Design Fires
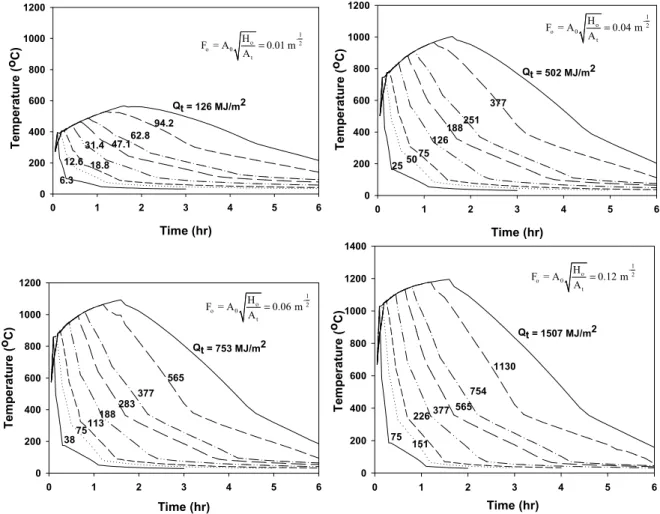
The EUROCODE 25 parametric fire temperature equations are perhaps the most widely-used equations for representing post-flashover temperatures. A time-temperature relationship is produced for any combination of fire load, ventilation openings and wall lining materials. The time-temperature curves from which the equations were derived were produced by Magnusson and Thelandersson 26, and are shown in Figure 7. Buchanan 4 and Karlsson and Quintiere 5 discuss the methodology employed by Magnusson and Thelandersson to produce the curves in greater detail. The effect of ventilation on the maximum temperature and duration of burning is apparent from Figure 7, and it can also be seen that well-ventilated fires are characterized by rapid rates of burning and higher temperatures for a given fire load.
The EUROCODE method divides the fire development into two phases: the heating phase, which is identical to the ISO 834 standard temperature-time curve, and the decay phase. The equation for the heating phase is:
(20)
(
-0.2t* -1.7t* -19t)
T = 1325 1-0.324e
-0.204e
-0.472e
* where T is the temperature andt
*is a fictitious time (in hours) given by:(
)
(
)
2 o ref ref * t = t F F b b (21)where b is
k c
ρ
p (Ws0.5/m2K), Fo is the opening factor given by Equation (2), Fref is the reference value of the opening factor, taken to be 0.04,k c
ρ
p is the thermal inertia, and bref is the reference value ofk c
ρ
p , given the value of 1160. Therefore, Equation (21) can be rewritten as:2 2 * Fo 1160 t = t 0.04 p k c
ρ
(22)Time (hr) 0 1 2 3 4 5 6 T e m p eratu re ( oC) 0 200 400 600 800 1000 1200 1 -o 2 o 0 t H F = A 0.04 m A = 2550 75 126 188251 377 Qt = 502 MJ/m2 Time (hr) 0 1 2 3 4 5 6 Tem p er a tur e ( oC) 0 200 400 600 800 1000 1200 1400 1 -o 2 o 0 t H F = A 0.12 m A = 75 151 226377 565 754 1130 Qt = 1507 MJ/m2 Time (hr) 0 1 2 3 4 5 6 T e m p era tu re ( oC) 0 200 400 600 800 1000 1200 1 -o 2 o 0 t H F = A 0.06 m A = 38 75113 188 283 377 565 Qt = 753 MJ/m2 Time (hr) 0 1 2 3 4 5 6 T e m p eratu re ( oC) 0 200 400 600 800 1000 1200 1 -o 2 o 0 t H F = A 0.01 m A = 6.3 12.6 18.8 31.4 47.1 62.8 94.2 Qt = 126 MJ/m2
Figure 7. Time-Temperature Curves for Different Ventilation Factors and Fire Loads 26
The EUROCODE temperature-time curve in the cooling phase is given by:
(23) * * g g,max d d * * * * g g,max d d d * * * g g,max d d
T
T
625(t - t )
for t
0.5
T
T
250(3 t )(t - t )
for 0.5
t
2.0
T
T
250(t - t )
for t
2.0
=
−
≤
=
−
−
≤ ≤
=
−
≥
where Tg,maxis the maximum temperature in the heating phase for
t =
*t
d and: * 2 2 -3 * t o d o 0.13×10 Q F 1160 t = F k cρ
p 0 ′′ .04 (24)-3 t d o
0.13×10 Q
t =
F
(25)Therefore, the modified duration time can be rewritten as: 2 2 * o d d F 1160 t = t 0.04 p k c
ρ
(26)Feasey 27 reviewed the modeling of post-flashover fires and compared the various methods of predicting temperature-time profiles in post-flashover enclosure fires.
Parametric fires, which incorporate the factors known to affect fire growth and severity, such as fire load, enclosure size, ventilation area and thermal properties of the
construction materials, are discussed.
Mehaffey 21 presented a simple framework for undertaking performance-based design for fire resistance in wood-frame residential and office building which employed design fires based on the EUROCODE and the Japanese parametric post-flashover models. The Japanese parametric model presented in Mehaffey’s work is 21:
1 6
T(t) - T(0) =
β t
(27)where:
T = temperature of the hot gas (K) β = a constant ( -1 6
Ks
) t = time from ignition (s)For post-flashover Ventilation-controlled fires, the constant β is given by: 1 3 v t F β = 3.0 T(0) A k c
ρ
p (28) where: ρ = density of boundaries (kg/m3 ) pc
= specific heat of boundaries (kJ/kg.K)The duration of a post-flashover ventilation-controlled fire is given by: f b v f M A t 0.1 F ′′ = (29) where:
b
t = duration of fire (s) f
M′′ = fire load per unit area (kg/m2) Af = area of the floor (m2)
Mehaffey used Equation (27) to illustrate the application of the method to a three-storey wood-frame hotel. The design fire chosen was considered to be a reasonably severe post-flashover fire and the fire load was obtained from Table 6, which is presented later in Section 3.4, and based on the 95th percentile.
Ma and Makelainen 28 presented a parametric temperature-time curve for
representing small to medium post-flashover fire temperatures based on data from various laboratories. Their equation is:
δ g o g,max o m m
T -T
t
=
exp 1 -
T
-T
t
t
t
b
(30) where:Tg = hot gas temperature (oC)
Tg,max = maximum hot gas temperature (oC) 0
T
= reference temperature (oC)tm = time at which maximum temperature occurs (min) δ = shape constant for the curve.
Feasey and Buchanan 15 used a computer program, COMPF2, to generate a series of post-flashover design fires with the help of data from realistic test fires and carefully defined fire loads (primarily wood cribs and real furniture) as input. Their intention was to modify the burning and decay phases of the EUROCODE parametric fire curves in order to improve the estimation of temperatures in post-flashover compartment fires, which, they felt, were under-predicted, especially for ventilation-controlled fires. They found that a
value of 1900 gave more accurate results and recommended that this value be used in Equation (21).
ref
Barnett 22 presented a technique for modeling temperatures, in which a single equation was used to represent the temperature of both the growth and decay phases of a fire, and only three factors were required: maximum gas temperature, the time at which it occurred and a shape constant for the source. Barnett’s equation is:
2 m c (log t - log t ) -s max
T = T + T
∞e
(31) where:sc = shape constant for the temperature-time curve (-) T = temperature at any given time t (oC)
Tmax= maximum temperature generated above T∞ (calculated using the methods given in the SFPE handbook 14(oC)
t = time from ignition of fire (min) tm = time at which Tmax occurs (min)
The shape constant was correlated with the pyrolysis coefficient
k
, which is equal top
p v
R
F
; whereR
p is the rate of pyrolysis. Therefore:(32) P
s
c k
c
=
where c is a constant determined from experimental data.
Equation (31) was developed using data from 142 fire tests from various sources, the majority of which were conducted with wood cribs. The fuel masses ranged from 3 to 5100 kg and the temperatures measured ranged from 500oC to 1200oC. The growth rates ranged from ultra-slow to ultra-fast, in accordance with the NFPA categories given in Table 1.
3.3 Heat Release Rates
Accurate burning rate data for combustibles, which are likely to be present in a particular enclosure, are useful in predicting the fire development history in the enclosure. Although many burn tests (full scale and bench scale) have been conducted by various laboratories around the world, in furniture calorimeters and other bench-scale apparatus, using both real and mock-up furniture, it is impractical to present all the results in a single forum in a neat and organized fashion due to the extremely large variations in furniture designs and the materials used.
The heat release rate is perhaps the single most important variable that
quantitatively defines a design fire and is usually a required input for most mathematical fire models for both pre-flashover and post-flashover fires. The heat release rate largely controls the main characteristics of the fire, such as: plume flows, hot gas temperatures, and the rate of descent of the hot gas layer 5. Heat release rates for items of furniture are typically measured in the furniture calorimeter using the oxygen consumption principle under free-burning conditions. Babrauskas et al.29 provide a detailed description of the design features and principles of operation of the furniture calorimeter. Heat release rate results and other combustion data were also given for a number of upholstered furniture items. Lawson et al.30 presented more combustion data, obtained using the heat release rate calorimeter developed by Babrauskas et al.29, for various furnishings, such as: easy chairs, sofas, wardrobe closets, bookcases and bedding.
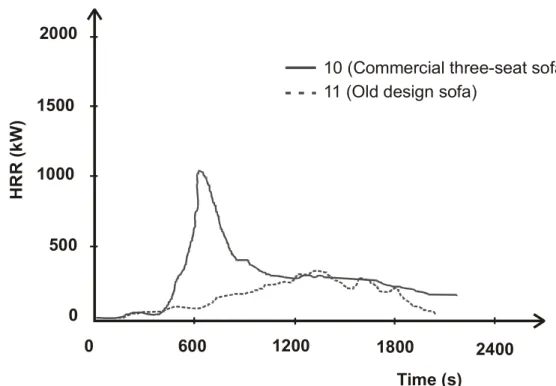
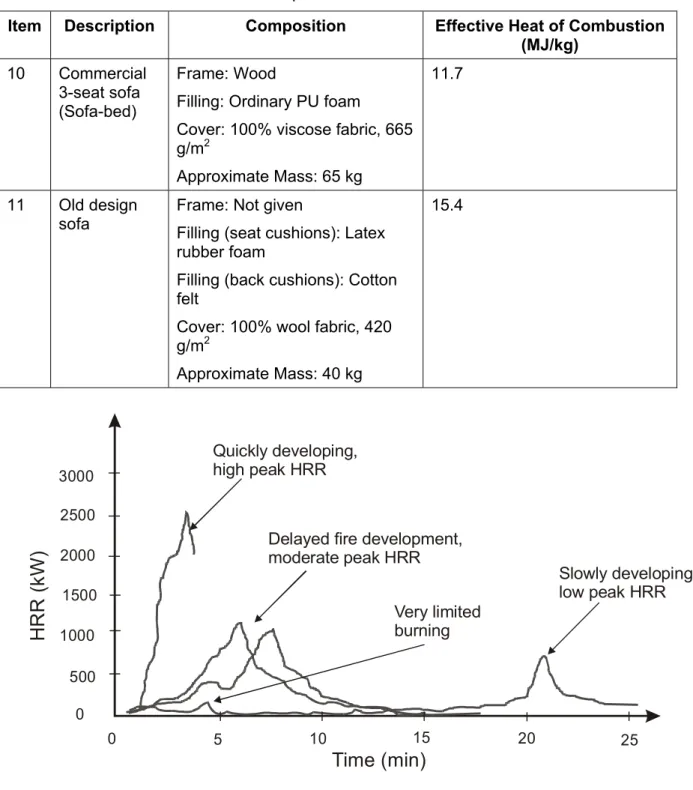
Sardqvist 31 published a detailed summary of a large number of full scale tests on numerous combustible items performed by different laboratories under various conditions. Results pertaining to the rate of heat release, production of smoke and generation of carbon dioxide were given for a wide variety of items ranging from lining materials and pallet systems, to chairs and coffee makers. The results were selected primarily based on the availability of the heat release rate as measured by the oxygen consumption method. Figure 8 shows the rate of heat release curve for two items described as: a “commercial
three-seat sofa”, item 10, and an “old design sofa”, item 11. The full description of the sofas is given in Table 3.
2000 2400 1800 1200 600 0 0 500 1000 1500 Time (s) HR R (k W)
10 (Commercial three-seat sofa) 11 (Old design sofa)
Figure 8. Rate of Heat Release for the Two Sofas Described in Table 3 31
The heat release rate is affected by many factors such as: ventilation, location of fire load with respect to the walls, strength and number of ignition sources, all factors which influence fire behaviour. Furniture construction details and materials are known to substantially influence the peak heat release rate, such that heat release rate data are not available for all furniture items or for “generic” furniture items 19. Heat release rate data from previous tests can be used merely as guides and cannot be relied upon to produce accurate estimates within a given class of items owing to the wide variations that exist.
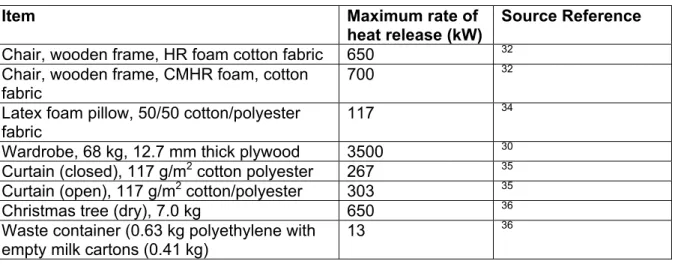
The European Commission-sponsored project CBUF (Combustion Behaviour of Upholstered Furniture)32 produced one of the largest and most recent collection of combustion data for upholstered furniture. In the CBUF project, the furniture calorimeter was used for testing full-scale furniture items, while the Cone Calorimeter (ISO 5660) was used for small scale testing of furniture components. The four curves typifying the burning behaviour of the 27 different types of real furniture items tested are shown in Figure 9.
Table 3. Composition and Effective Heat of Combustion of Two Sofas Given in
Sardqvist’s Database 31
Item Description Composition Effective Heat of Combustion
(MJ/kg)
10 Commercial 3-seat sofa (Sofa-bed)
Frame: Wood
Filling: Ordinary PU foam
Cover: 100% viscose fabric, 665 g/m2
Approximate Mass: 65 kg
11.7
11 Old design sofa
Frame: Not given
Filling (seat cushions): Latex rubber foam
Filling (back cushions): Cotton felt
Cover: 100% wool fabric, 420 g/m2 Approximate Mass: 40 kg 15.4 1000 2000 2500 3000 25 20 15 10 0 0 500
Time (min)
H
R
R
(k
W
)
5 1500 Quickly developing, high peak HRR Slowly developing, low peak HRR Very limited burning Delayed fire development, moderate peak HRRFigure 9: Illustration of Typical HRRs as Function of Time Measured in the Furniture
Calorimeter for a Selection of European Upholstered Furniture and Mattresses32
Typical values of heat release rates, obtained from various sources, for some household items are given in Table 4.
Table 4. Maximum (Peak) Rates of Heat Release from some Typical Items 33
Item Maximum rate of
heat release (kW)
Source Reference
Chair, wooden frame, HR foam cotton fabric 650 32 Chair, wooden frame, CMHR foam, cotton
fabric
700 32
Latex foam pillow, 50/50 cotton/polyester fabric
117 34
Wardrobe, 68 kg, 12.7 mm thick plywood 3500 30 Curtain (closed), 117 g/m2 cotton polyester 267 35 Curtain (open), 117 g/m2 cotton/polyester 303 35
Christmas tree (dry), 7.0 kg 650 36
Waste container (0.63 kg polyethylene with empty milk cartons (0.41 kg)
13 36
3.3.1 Prediction of Heat Release Rate
Prediction of heat release rate from information obtained from the burning characteristics of individual items (especially upholstered furniture) obtained in bench-scale tests such as the Cone Calorimeter, has been of interest ever since it was first attempted by Babrauskas and Krasny 37. However, many efforts have so far been met
with limited success mainly because of the difficulty of scaling complex phenomena from bench-scale to full-scale items 4. The method Babrauskas and Krasny used to predict the peak heat release rate, , for full-scale furniture based on data obtained from the Cone Calorimeter is: fs Q&
(33)[ ]
fs bsmass
frame
style
Q
0.63
factor
factor
factor
q
′′
=
&
&
where: bsq
&
′′
= rate of heat release (kW/m2) in bench-scale testmass
=
factor
combustible mass (kg) 1.66 for non-combustible frame 0.58 for melting plastic=
factor 0.30 for wood 0.18 for wood
style
1.0 for plain, primarily rectilinear contruction
factor
1.5 for ornate, convolute shapes and intermediate values for intermediate shapes
=
The units of the constant in Equation (33), 0.63, are m2/kg and the bench-scale data are obtained from the Cone Calorimeter at an irradiance of 25 kW/m2 and a 180 s averaging period.
Babrauskas and Krasny 37 also derived another expression for estimating the peak heat release rate based on generic materials:
(34) fs
fabric
padding mass
frame
style
Q
210
factor
factor
factor
factor
factor
=
&
where:1.0 for thermoplastics (fabrics such as polyolefin, which melt prior to burning) fabric
0.4 for cellulosic fabrics (cotton, rayon, e.t.c) factor
0.25 for PVC or polyurethane film type coverings =
1.0 for polyurethane foam or latex form
padding
0.4 for cotton batting
factor
1.0 for mixed materials (i.e., both polyurethane or latex foam and cotton batting
0.4 for neoprene foam
=
The remaining factors are the same as those in Equation (33) and the constant 210, in Equations (34), has units kW/kg. A more detailed discussion of the derivation of Equations (33) and (34), including their limitations for use was given by Babrauskas and Krasny 37.
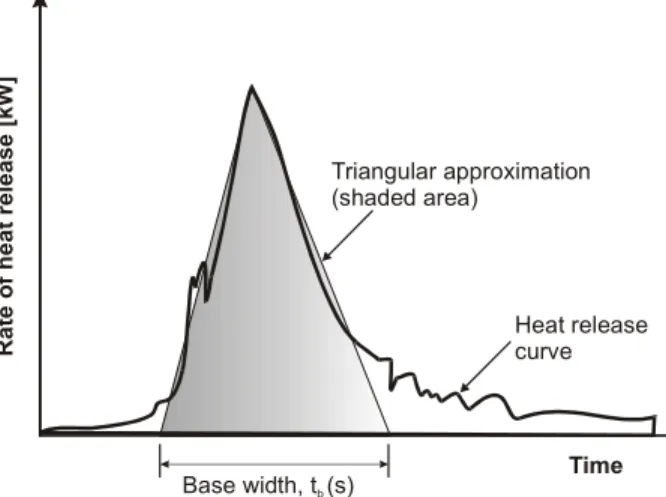
Babrauskas and Walton 38 sought to simplify the characterization of heat release rates for upholstered furniture and postulated that for most specimens, the form of a triangle would be a good approximate to the rate of heat release as a function of time as depicted in Figure 10. Time R at e o f heat re leas e [ kW] Heat release curve Triangular approximation (shaded area) Base width, t (s)b
Figure 10. Triangular Representation (Shaded Area) of the Rate of Heat Release of an Item
In this approach, the incipient phase of combustion (i.e., before flaming begins) and much of the decay phase is not taken into consideration. The fire duration (triangle base width),
t
b, is determined as follows:c b fs C M ∆hc t = Q& (35) where:
C= 1.3 for wood frames and 1.8 for metal frames and plastic frames c
M
= combustible mass of the item (kg) c∆h
= effective heat of combustion (kJ/kg) and Q&fsis obtained from Equation (33) or Equation (34).In the CBUF work, three different models were developed for predicting heat release rates for full-scale furniture using Cone Calorimeter data. Equations to predict the peak heat release rate, time to reach untenable conditions, total energy released and smoke production rates were developed after an extensive statistical analysis of the database. Further details can be found in the CBUF report 32. Babrauskas et al. 39 have also presented a detailed discussion of the three models developed in the CBUF work.
Hoglander and Sundstrom 3 used the data from the CBUF study to derive
expressions for characteristic heat release rates of individual upholstered furniture items for domestic and public occupancies, given respectively as:
(36)
(
)
(
2 Q& =2500 exp −0.4 t 3−)
)
(37)(
)
(
2 Q 1500 exp& = −0.2 t 4−where Q is the heat release rate in kW and t is expressed in minutes. At time t = 0, the heat release rate is 50 kW, following the recommendations in the CBUF report.
&
3.4 Fire Loads
Modern Northern American residential buildings are constructed out of lightweight materials with substantial amounts of synthetic lining materials and finishes. In addition, the buildings now contain furniture which is increasingly manufactured from synthetic fabrics and foams. All these new materials burn more rapidly and are susceptible to fire damage at lower temperatures compared with wood-based materials. Statistical
information reveals that the major cause of fire fatalities in dwellings are fires involving upholstered furniture 3,40, and smokers’ materials have been identified to be by far the largest cause of fires.
Fire loads reported in the literature range from 100 to 10,000 MJ/m2 of floor area. A comprehensive list of fire load data is given in CIB W14 41 Workshop, from which the values in Table 5 are extracted. Buchanan 4 reported that the New Zealand Building Code recommends design fire loads of 400, 800 and 1200 MJ/m2 of floor area for residential, office and retail occupancies, respectively with a requirement that storage areas be assessed separately. In Buchanan’s opinion these values are rather low for safe design. This argument was justified with reference to the EUROCODE 25, which gives five classes of fire loads ranging from 250 to 2000 MJ/m2 of floor area. Buchanan reiterated the view widely held by many workers in fire research, that design fire loads ought to be selected to represent an extreme value of the likely fire scenarios and further suggested that the likelihood of the chosen value being exceeded in the 50 year life of a building be less than 10 percent. Other noteworthy suggestions by Buchanan are that:
Both fixed and moveable fire loads should be included;
If data from representative surveys is available, design fire load should be the 90 percentile value.
Table 5. Fire Load Energy Densities 41
Occupancy type Fire load per unit floor area
(MJ/m2)
Basement, dwellings 900
Homes 500 Hospital 300 Hotel 300
3.4.1 Fire Loads Reported in the Literature
In a study conducted at the National Bureau of Standards (NBS) 42 in 1939, aimed at determining a more realistic time-temperature curve for testing exposed floor
assemblies for residential buildings, fire load densities of between 25.4 kg/m2 and 58.6 kg/m2 were used in the full-scale burn-out tests carried out in a simulated three room dwelling. It was found that the addition of combustible interior finish materials on the wall and ceiling did not increase the maximum temperature of a ventilation-controlled fire over that produced by the combustible contents and the duration of the fire was not prolonged either. However, the rate of burning outside of the room was markedly increased due to the additional fuel contributed by the pyrolysis of the combustible finish, and it was concluded that this could be a major factor in fire spread beyond the room of origin.
Table 6 shows fire load data from a Swedish study 44. Harmathy and Mehaffey 43 used this data and recommended that the 95th percentile of each building occupancy should be used. They suggested that the design fire load should be obtained from:
f f
M = M +1.64
′′
′′
σ
(38)where
M
f′′
is the average fire load, and the total mass of the combustibles, M , is given by:(39) f f
M = A M′′f
where Af is the floor area of the enclosure.
Table 6. Fire Loads in Terms of Calorifically Equivalent Mass of Wood for Various Occupancy Types 43 Occupancy f
′′
M
(kg/m2) (Statistical Median) Standard Deviation σ Dwelling 30.1 4.4 Office 24.8 8.6 School 17.5 5.1 Hospital 25.1 7.8 Hotel 14.6 4.2Table 7 shows the same data from the Swedish study presented by Karlsson and Quintiere 5 as fire load density (MJ/m2) based on the total internal area of the enclosure, for all but one case. The values shown were obtained in 80% of the cases.
Table 7: Typical Fire Load Density for Various Types Of Buildings 5
Type of Occupancy Fire load Density,
Q
t(MJ/m2)Dwelling; 2 rooms and kitchen
168 Dwelling; 3 rooms and
kitchen
149
Offices 709 (per floor area)
Schools 96.3 Hospitals 147 Hotels 81.6
Satoshi et al. 45 carried out a survey of fire loads in 214 dwelling units in Japan between 1965 and 1984 and reported an average fire load and fire load density (kg per unit floor area) of 1866.1 kg and 33.9 kg/m2, respectively, with the latter having a standard deviation of 11.7 kg/m2. They further analyzed the fire loads according to the individual spaces in the dwelling units and obtained the average fire load and fire load density as 179.5 kg and 48.5 kg/m2, respectively, for 2283 spaces.
Yii 46 investigated the effect of the surface area and the thickness of fire load on the heat release rate. A substantial amount of data from fire load surveys from numerous sources were presented as fire load energy densities (per unit floor area). The fire load in the equivalent mass of wood per unit area was obtained by dividing the actual fire load density by 16.7 MJ/kg, which was the assumed value for the net (effective) calorific value of wood with a moisture content of 12%. Table 8 shows a summary of fire load data for various occupancies presented by Yii. An analysis of the fire load data present by Yii for individual rooms revealed wide variations in fire load densities which are not indicated in Table 8 since Yii did not perform a detailed statistical analysis.
Table 8. Summary of Fire Load Data in Offices, Residential Rooms and Motels 46
Occupancy Mean fire load energy density (MJ/m2)
Mean fire load (in kg wood equivalent per m2)
Offices 950 57
Residential 724 43
Motel 552 33
4 MATHEMATICAL FIRE MODELING
Mathematical models offer a means of evaluating the fire performance of materials, components and structures in buildings by testing various fire scenarios without carrying out full-scale fire testing, which is costly and time-consuming. The advent of performance and objective-based building code systems for fire safety and the increased complexity of building designs has resulted in a substantial increase in the use of computer modeling for simulating smoke and heat movement in buildings 5. Mathematical models exist in various levels of sophistication and range from simple sets of algebraic and differential equations representing a fire or selected fire phenomena, to elaborate numerically intensive
algorithms requiring significant computational power.
The two main groups of mathematical fire models employ probabilistic and deterministic methods. The former employs probability concepts in the analysis of fire events while the latter predicts the development of a fire based on physical relationships derived from scientific theories and empirical results for user-specific input parameters. Probabilistic models use statistical information to predict the transition from one stage of fire growth to another and are largely used in risk assessment models. The two main deterministic computer modeling approaches are based on zone models and field models. One author 4 declared that none of these models are capable of modeling post-flashover fires adequately.
4.1 Zone Models
Deterministic computer models used to predict temperatures in the pre-flashover stage use the concept of the two-zone model, which assumes that enclosure is divided into two distinct layers: an upper hot layer consisting mainly of combustion gases and a relatively cooler lower layer. Equations of conservation of mass, momentum and energy are then solved for the two zones. Janssens 16 gives an extensive discussion of
mathematical fire modeling using the two-zone technique.
A design fire is usually provided as input to zone models since they do not contain algorithms to calculate fire growth on combustibles. Information obtained from zone models include: height of hot layer, temperatures and concentrations of gas species in both layers, floor and wall temperatures, and the heat flux at the floor level 4.
4.2 Field Models
Field models employ computationally-intensive algorithms based on Computational Fluid Dynamics (CFD) to solve the fundamental governing equations for a large number of discrete volumes. A comprehensive list of fire models, with a concise summary of and with references to each model, can be found in a survey by Friedman 47 and in the SFPE handbook 14.
Field models are widely perceived as being complicated owing to the high degree of sophistication of the CFD-based computer programs used and the additional difficulty of interpreting the results. As a result, they are mostly used as research tools and are not particularly popular for general use. However, as fire phenomena becomes better understood and advancements in computer technology, particularly in computing power, continue to take place, field models will, undoubtedly, gain widespread use in the coming years.
5 FIRE SCENARIOS
A design fire scenario represents a particular combination of outcomes or events associated with governing parameters such as 2:
type and size of fire; mode of ignition;
internal ventilation conditions ( including breakage of windows and air-handling systems);
external environmental conditions;
performance of any installed fire safety measures; fire load density;
state of doors (open or closed).
The methodology for evaluating the level of fire safety offered by a proposed
design, that is suggested in ISO Technical Report 13387-2:1999(E) 1, entails a risk-ranking process as the basis for the selection of design fire scenarios. The key aspects of this process are listed as 1:
1. identification of a comprehensive set of possible fire scenarios; 2. estimation of the probability of occurrence of the scenario using
available data and engineering judgement;
3. estimation of the consequence of the scenario using engineering judgement;
4. estimation of the relative risk of the scenarios (product of consequence and probability of occurrence);
The initial set of possible design fire scenarios can be based on fire incident statistics. Yung and Benichou 48,49 discussed the use of design fires to analyze fire
hazards to the occupants of a building and listed six design fire scenarios for an enclosure with the entrance door either open or closed for the following types of fires: smouldering fire, flaming non-flash fire, and flashover fire.
Yung and Benichou 48 further discussed the use of a probabilistic approach to determine the most likely fire scenario. According to their statistics for the three countries: Australia, USA and Canada, non-flashover fires occurred more frequently than
smouldering and flashover fires. The average frequency of occurrence of the three fire types, smouldering, non-flashover and flashover in apartments, was respectively, 20.7%, 62% and 17.4% for the three countries.
5.1 Canadian Fire Statistics
Yung and Lougheed 40 analyzed Canadian fire statistics from the province of Ontario for the period 1995 to 1998 and found that fires in residential properties accounted for 66% of the total number of fires and 95% of the total number of deaths. The most fatal fire scenario in houses were fires originating in a main living area, which were initiated by smokers’ materials, such as lighters, matches, and also involved upholstered furniture.
According to fire statistics for 1999 for the whole of Canada, there were 55,169 fires, 388 fire deaths, 2,2887 fire injuries with associated property losses exceeding $1 billion. The largest number of fires occurred in residential properties (40% of the total), with associated deaths and monetary losses of 73% and 42%, respectively 50. The
distribution of sources of ignition is shown in Figure 11. Smokers’ materials are the largest identifiable source of ignition followed by cooking equipment.
Smokers' material 20% Undetermined 25% Cooking equipment 11% No igniting object 1% Miscellaneous 12% Exposure 4% Other electrical equipment 5% Heating equipment 9% Appliances & equipment 4% Electrical distribution equipment 9%
5.2 Tenability Limits
Tenability limits define the onset of adverse conditions for human survival and can be described in terms of the concentration of toxic combustion gases, smoke obscuration and the temperature level (heat exposure) in a given space. In the CBUF study 32, the time to untenability was taken to start when the full-scale heat release rate first exceeded 50 kW and ended when the smoke layer (represented by the 100oC isotherm) was at a height of 1.2 m above the floor. An equation was also presented for predicting the time to reach untenable conditions.
6 CONCLUSIONS
Although the major factors which influence the main characteristics of a fire have been identified and widely studied, many researchers acknowledge that there is still a need for further research to better understand fire behaviour.
There is no generally accepted fundamental method or procedure for specifying a design fire. However, there is a general agreement that fire load data for the occupancy under consideration should be incorporated. The ISO Technical Reports 1,2 are by far the most extensive treatment of the subject.
Much of the published work on design fires focuses on their application in structural design, in which the temperature history is the most important parameter. The majority of methods available are parametric equations which attempt to correlate experimental data from various sources. For pre-flashover fires, the t-squared fires are the most widely-used design fires.
Numerous combustion data from fire tests involving real and mock-up furniture is available in the literature from various laboratories. However, it is not possible to present this data in a neat and organized fashion due to the extremely large variations in furniture designs and materials. Similarly, many fire load surveys have been published spanning over the last two decades. The large variation in fire loads is apparent, and is mainly due to differences in geographical locations and the subjective manner of quantifying fire loads. The literature review revealed a distinct absence of fire load data for occupancies in
Canada. In this light, there is clearly a need to conduct a fire load survey of Canadian dwellings in order to identify typical combustibles and room configurations.
Up-to-date statistical information on ignition sources is available and should be used as the basis of selecting appropriate ignition scenarios.
7 REFERENCES
1. International Organization for Standardization (ISO), "Fire Safety Engineering - Part 2: Design Fire Scenarios and Design Fires", ISO Technical Report, (ISO/TR
13387-2:1999(E)), 1999
2. International Organization for Standardization (ISO), "Fire Safety Engineering - Part 1: Application of Fire Performance Concepts to Design Objectives", ISO Technical Report, (ISO/TR 13387-1:1999(E)), 1999
3. Hoglander, K. and Sundstrom, B., "Design Fires for Pre-Flashover Fires", SP Report 1997:36, 1997
4. Buchanan, A. H., Structural Design for Fire Safety, 2nd ed., Wiley, New York, 2001.
5. Karlsson, B. and Quintiere, J. G., Enclosure Fire Dynamics, CRC Press, USA, 2000.
6. Cox, G., (ed), Combustion Fundamentals of Fire, Academic Press, London, UK, 1995.
7. Drysdale, D., An Introduction to Fire Dynamics, John Wiley and Sons, USA, 1985. 8. International Organization for Standardization (ISO), "Fire Safety Engineering - Part
4: Initiation and Development of Fire and Generation of Fire Effluents", ISO Technical Report, (ISO/TR 13387-4:1999(E)), 1999
9. McCaffrey, B. J. , Quintiere, J. G., and Harkleroad, M. F., "Estimating Room
Temperatures and the Likelihood of Flashover Using Fire Test Data Correlations", Fire Technology, Vol. 17(2), 1981, pp.98-119
10. Walton, W. D. and Thomas, P. H., "Estimating Temperatures in Compartment Fires", SFPE Handbook of Fire Protection Engineering, Chapter 2-2, 1995, pp.16-32
11. Zdanowski, M., Teodorczyk, A., and Wojcicki, S., "A Simple Mathematical Model of Flashover in Compartment Fires", Fire and Materials, Vol. 10, 1986, pp.145-150 12. Harmathy, T. Z., "A New Look at Compartment Fires, Parts I and II", National
Research Council of Canada, (Research Report 566), 1972
13. Kawagoe, K., "Fire Behaviour in Rooms", Building Research Institute, Tokyo, (Report No. 27), 1958
14. Society of Fire Protection Engineers (SFPE), "The SFPE Handbook of Fire Protection Engineering", NFPA International, (3rd Edition), 2002
15. Feasey, R. and Buchanan, A., "Post-Flashover Fire for Structural Design", Fire Safety Journal, Vol. 37, 2002, pp.83-105