Publisher’s version / Version de l'éditeur: Interface Science, 12, pp. 353-360, 2004-07-01
READ THESE TERMS AND CONDITIONS CAREFULLY BEFORE USING THIS WEBSITE.
https://nrc-publications.canada.ca/eng/copyright
Vous avez des questions? Nous pouvons vous aider. Pour communiquer directement avec un auteur, consultez la
première page de la revue dans laquelle son article a été publié afin de trouver ses coordonnées. Si vous n’arrivez pas à les repérer, communiquez avec nous à [email protected].
Questions? Contact the NRC Publications Archive team at
[email protected]. If you wish to email the authors directly, please see the first page of the publication for their contact information.
NRC Publications Archive
Archives des publications du CNRC
This publication could be one of several versions: author’s original, accepted manuscript or the publisher’s version. / La version de cette publication peut être l’une des suivantes : la version prépublication de l’auteur, la version acceptée du manuscrit ou la version de l’éditeur.
Access and use of this website and the material on it are subject to the Terms and Conditions set forth at Creep of hardened cement paste - the role of interfacial phenomena Beaudoin, J. J.; Tamtsia, B. T.
https://publications-cnrc.canada.ca/fra/droits
L’accès à ce site Web et l’utilisation de son contenu sont assujettis aux conditions présentées dans le site LISEZ CES CONDITIONS ATTENTIVEMENT AVANT D’UTILISER CE SITE WEB.
NRC Publications Record / Notice d'Archives des publications de CNRC: https://nrc-publications.canada.ca/eng/view/object/?id=e78ed0bd-ad87-4ed3-b7bc-05fe88676354 https://publications-cnrc.canada.ca/fra/voir/objet/?id=e78ed0bd-ad87-4ed3-b7bc-05fe88676354
Creep of hardened cement paste – the role of interfacial phenomena
Beaudoin, J.J.; Tamtsia, B.T.
NRCC-43955
A version of this document is published in / Une version de ce document se trouve dans : Interface Science, v. 12, 2004, pp. 353-360
CREEP OF HARDENED CEMENT PASTE – THE ROLE OF INTERFACIAL PHENOMENA
James J. Beaudoina and Basile T. Tamtsiaa
a
Institute for Research in Construction, National Research Council, Ottawa, Canada, K1A 0R6
ABSTRACT
Real-time changes in the microstructure of hardened cement paste subjected to a sustained load were followed through the coupling of an a.c. impedance frequency analyzer with a miniature loading system. A rationale for the time dependent effects of the sustained load on the characteristics of the impedance spectra is provided. The analysis suggests that the sustained load can influence the conductivity of the solid-liquid interface, the thickness of the Stern layer and pore structure parameters in a manner that would result in a time dependent increase in the diameter of the high frequency arc. This was demonstrated experimentally. The impedance analysis included an assessment of the relevance of the high frequency arc depression angle to creep behavior of cement paste. A possible explanation of the changes to the depression angle with time under load in terms of interfacial phenomena at the nanoscale is given.
Key Words
Contact Author Dr. J.J. Beaudoin
Institute for Research in Construction National Research Council
Building M-20 1200 Montreal Road Ottawa, Ontario, K1A 0R6 CANADA
Tel: (613) 993-6749 Fax: (613) 954-5984
Footnotes
Affiliation of Authors
Institute for Research in Construction,
INTRODUCTION
Despite the extensive number of publications on deformation and creep of cement paste, mortar and concrete no satisfactory theory for the time-dependent chemical and physical processes responsible for creep has been universally accepted [1,2]. An excellent review of the mechanisms of creep and shrinkage is provided by Neville [3]. A detailed
description of the mechanisms will not be provided here. Descriptions of creep mechanisms often correspond to conceptions or models of the calcium silicate hydrate microstructure [4]. Powers has suggested that creep of cement paste is caused by a diffusion of the load-bearing water as an external load changes the free energy of the adsorbed water [5]. Feldman has suggested that creep occurs through the gradual crystallization or aging of the layered C-S-H leading to an increased amount of layering [6].
Recently, electrical methods eg. a.c. impedance spectroscopy have shown promise as tools for characterizing microstructural development in cement-based materials [7-18]. Analysis of the impedance spectra provides pore structure information. The objective of this study was to obtain real-time descriptions of microstructural change during creep and shrinkage of cement paste through the coupling of time-dependent deformation and impedance measurements. A rationalization of the role of interfacial phenomena (C-S-H/pore solution) on the creep process was attempted. The experiments were designed to further understanding of creep mechanisms in cement-based materials.
Impedance Behavior of Cementitious Materials
Impedance spectra recorded over a wide range of frequencies (from 15 MHz to 1 Hz) have provided new information and insight on cement paste microstructure and
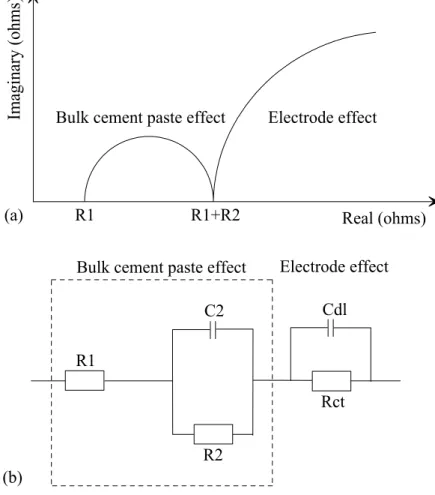
hydration. An idealized impedance spectrum for a cement system is plotted in the real versus imaginary plane, Figure 1a. A single arc in the high-frequency range with a small part of a second arc in a relatively low-frequency region is shown. The high-frequency arc (HFA) is attributed to the bulk cement paste impedance behavior and the low-frequency arc to the cement paste-electrode surface capacitance contribution [8]. The
intercepts R1 (at the high-frequency end, at c. 20 MHz-7MHz) and R1 + R2 (at the
minimum between the electrode arc and bulk arc, at frequency c. 100 MHz) are important parameters providing information related to cement paste microstructure. Interpretation of an impedance spectrum (IS) usually involves modeling with an
equivalent circuit (Figure 1b) until the electrical response of the elemental microstructure of the cement paste is well simulated.
Cement based materials generally contain a broad size distribution of conducting pores [7]. Christensen et.al. [14] found the cement paste to be a complicated composite
conductor because its microstructure and the conductivity of its pore fluid are interrelated and time-dependent. Previous investigations [16,19] have indicated that impedance behavior of the hydrating Portland cement system depends upon the ionic concentration
of the pore solution and porosity. The high frequency arc diameter (or chord), R2, has
been shown to be an inverse function of porosity, mean pore size and ionic concentration of the pore solution. In practice, an ideal semi-circle is generally not observed in most materials. It is normally an inclined semi-circle with its center depressed below the real
axis by a finite angle referred to as the depression angle, θ [8]. This behavior normally
associated with a spread of relaxation time [17] cannot be described by the classical Debye equation employing a single relaxation time [18]. A dispersive,
frequency-dependent element or so-called constant phase element (CPE) [20,21] can be introduced to account for the shape of the depressed complex plot. The impedance contribution of this element can be expressed as follows:
(1) n o j A CPE Z( )= −1( ω)−
where n = 1-2/π (θ) is the depression angle parameter. Therefore, n can be used to
represent the degree of perfection of the capacitor and represents a measure of how far the arc is depressed below the real impedance axis.
Influencing factors on the depression angle such as a spread of relaxation times and non-Debye behavior have been suggested [9,17]. A wider spread of pore diameters can also be associated with a larger depression angle [18]. The magnitude of the depression angle reported for normal cement paste, silica fume-Portland cement paste and porous glass is 28.5, 17 and 9° respectively. The time for the reorientation of ions or relaxation time appears to be affected by the geometry of the pores and the surface chemistry of the solid. Pore size and pore surface chemistry could limit the oscillation frequencies of the
hydrated ions and water molecules, which respond to the applied a.c. signal. It follows that a stronger ion-ion interaction would be expected in small pores than in larger ones. Therefore a broader pore size distribution would result in a wide spread of relaxation times corresponding to a larger depression angle.
Disturbed circuit elements are associated with two types of physical interpretation. The first association is directly with a non-local process, for example, diffusion. The other arises because microscopic characteristics such as interface properties and grain boundary effects are themselves often distributed throughout the material. Pores at grain
Implications of an Applied Sustained Load on Impedance Spectra
It has been shown that the size of the high frequency arc (HFA) diameter, R2, is
dependent on the microstructural characteristics of the cement paste including porosity,
P, and mean pore size, r0. The following relationship was derived by Xu et.al. [19].
• + = 0 1 2 1 r P c K K R st f δ σ (2)
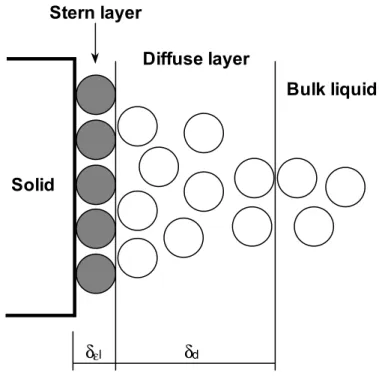
Where σf is the apparent conductivity of the solid-liquid interfacial zone, st is the
thickness of the Stern layer [22] at the solid surface (Figure 2), c is the concentration of
ions in the bulk pore solution and K and K1 are constants.
It is apparent that changes to any of the parameters in equation (2) as a result of
superimposing an applied stress on a cement paste specimen would affect the magnitude of the HFA diameter.
It can be argued that changes to the pore structure parameters would lead to a time dependent increase in the HFA diameter. This is derived from the following
considerations. It is known that creep (time dependent deformation due to a sustained load) results in an increase in internal solid volume as detected by helium pycnometric methods [6,23]. An increase in solid volume would be expected to reduce porosity incrementally as well as the mean pore size. These decreases would therefore result in an increase in the HFA as indicated in equation (2).
It is further argued that the application of stress through a sustained load would tend to reduce the concentration of ions in the pore solution, the net effect being to increase the size of the HFA diameter. It is suggested that a change in free energy with pressure should promote precipitation and therefore a reduction in concentration of the ions. This of course is dependent on the level of pressure and temperature. Mass change is not
required to satisfy the argument. A decrease in the conductivity of the solid-liquid interfacial zone might be expected as a consequence of the increase of solid volume resulting from a sustained applied stress. In effect a reduction in the number of interfaces which might occur would be responsible for the behavior. It is postulated that the
application of external loads results in a rearrangement of the layered system therefore reducing the number of interfaces at the nanoscale. Likewise, an increase in thickness of the Stern layer (due to applied stress) would be compatible with decreased conductivity. The argument for this is as follows. An increase in solid volume should have a net effect of moving surfaces closer together. The region between the diffuse layer and the Stern layer should become less distinct and possibly compressed. The result could be
construed as a thickening effect. This would likely affect conductivity irrespective of the extent of thickening. Again, the effect would be to increase the HFA diameter.
The cumulative effect of changes to all the above parameters would be reflected in the growth of the HFA diameter.
In summary the sustained load applied on cement paste in a creep test would be expected to produce this time dependent growth.
EXPERIMENTAL PROGRAM
Specimen Preparation and Characteristics
The hydrated cement paste used for this experimental study was made with type 10 Portland cement mixed with de-aired distilled water at a w/c = 0.50. The Portland
cement had the following composition in percent: SiO2 (20.72); Al2O3 (5.87); Fe2O3
(3.07); CaO (62.66); MgO (3.46); SO3 (2.18) and free lime (0.24). The Bogue
fineness of the cement was 340 m2/kg. Vacuum mixing was carried out in hollow
perspex cylinder 30 mm in diameter and 80 mm in length. Mixing of the paste was carried out using a magnetic stirrer placed inside the cylinder and the latter was placed between two large magnets [24]. This ensured homogeneity. The cylinders were slowly rotated while the paste hardened in order to avoid bleeding and resulting in a
homogeneous product. Specimens were demoulded after 24 hours and stored in lime water at 22°C for up to two years.
The resistivity of the saturated cement paste at 2 years was about 35.2 Ω.m. The
compressive strength at 28 days was 34.5 MPa. The stress-strength ratio for the creep tests performed on 2 year old samples was 0.30. The samples were fabricated from paste cylinders in order to obtain a ‘T-shaped’ specimen about 1 mm thick with a height of 25.4 mm and a flange width of 5.72 mm. A special jig was constructed to facilitate the cutting of the specimens with a precision saw.
Detail of Coupled A.C. Impedance – Creep Measurement System
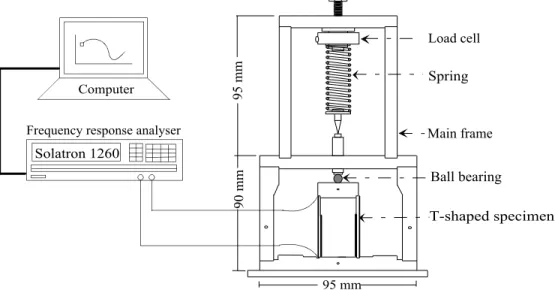
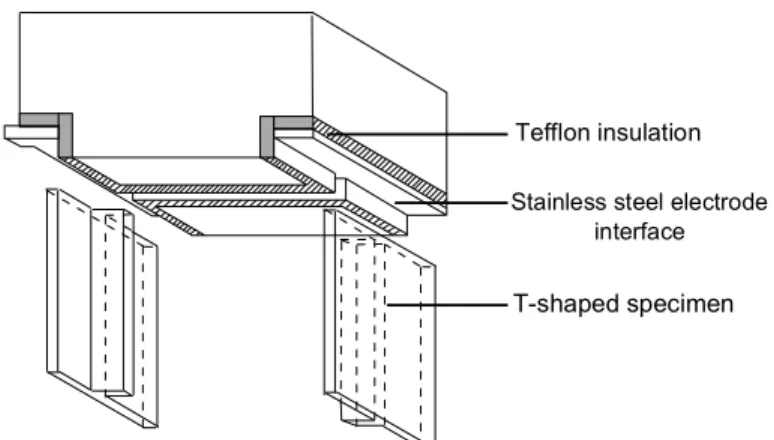
The a.c. impedance creep and shrinkage spectral responses were carried out by mounting the ‘T-shaped’ specimens on a fixed frame linking the specimens to a load cell through electrode interfaces which were connected to a Solatron 1260 frequency response analyzer. The microstructural changes were continuously monitored in a controlled relative humidity environment as the time under load increased. Figures 3 and 4 show the experimental device as well as detail of the ‘T-shaped’ specimen-electrode
Strain Measurements Under Sustained Load
Samples were saturated surface dry and directly used for test without any further treatment. The following experiments were conducted:
• Total strain measurements (creep plus shrinkage) from saturation to about 96% RH
under sustained load for a period of 3 days followed by strain recovery measurements after the removal of the load.
• Real time a.c. impedance spectra determination associated with total strain.
• Real time a.c. impedance spectra determination associated with the shrinkage test.
• Shrinkage measurements on unloaded specimens of cement paste from saturation to
about 96% relative humidity. RESULTS AND DISCUSSION
A typical total strain-time curve for the cement paste specimens (w/c = 0.50, stress-strength ratio = 0.30) under sustained load at 96% RH is presented in Figure 5. The total strain at 72 hours is 320 µ . Strain recovery is about 100 µ . Attempts were made to maintain the environmental chamber at 100% RH. This proved difficult. The actual humidity was about 96% RH as indicated. Shrinkage strains of about 150 µ were observed at 72 hours.
A.C. impedance spectra (real-time) were obtained at 96% RH for unloaded and loaded cement paste specimens. The magnitude of the high frequency resistance (HFR) and the size of the high frequency arc diameter (HFA) have been attributed to the properties of the pore solution, pore size and pore network [16,19]. Only the information provided by the HFA for the loaded cement paste specimen will be presented and discussed in this paper. Impedance spectra obtained in real-time for the cement paste specimens subjected
to a sustained load are shown in Figure 6. Plots for the unloaded specimens undergoing shrinkage strains at 96% RH are similar in character and are not shown. The size of the high-frequency arc increases with time (up to 72 hours).
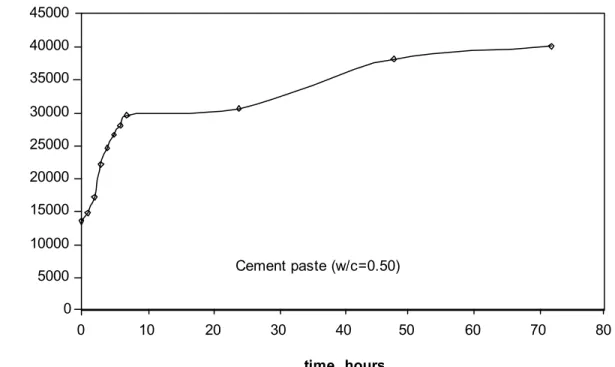
The growth of the high-frequency arc diameter, R2, (total strain conditions) is plotted in
Figure 7. The value of R2 increases to a value of about 30 kΩ at 7 hours. This is
followed by a gradual increase to 40 kΩ at 72 hours. The results validate the predication
made from the analysis of equation (2) i.e. microstructural changes due to a sustained load will result in a time dependent increase in the diameter of the high frequency arc. The electrical characteristics of the solid-liquid interfacial zone and pore structure parameters would appear to undergo time-dependent modifications.
Previous work has shown that loading cement paste up to about 50% of the maximum load did not significantly affect the size of the high frequency arc [25]. This suggests that microcracking processes had little effect on the a.c. impedance response (stress/strength
ratio ≈ 0.30) obtained in these experiments.
The depression angle parameter, n = 1 – 2/π (θ) is plotted against time in Figure 8. The
value remains relatively constant (about 0.98) for the first 2 hours. This is followed by a rapid decrease (to about 0.80 at 7 hours). A further gradual decrease to 0.73 at 30 hours then occurs. As stated previously a broader pore size distribution would result in a wide spread of relaxation times corresponding to a smaller value of n. The effect of a
sustained load may be to collapse or consolidate the C-S-H layers with a concomitant alteration of the pore structure. The change in pore structure is time dependent and consistent with the increases in solid volume reported to accompany the creep process [6,23]. Increased layering of C-S-H would bring charged surfaces into closer proximity
resulting in changes to the electrical characteristics as described in the analysis of equation (2). The dependence of the arc depression angle has also been linked to fractal characteristics of the surfaces [26,27]. The fractal nature of the C-S-H sheets may change when the cement paste is subjected to a sustained load. This may result in slipping – sliding of the C-S-H sheets relative to one another.
It has been suggested that grain boundary effects in polycrystalline materials contribute to the arc depression [9]. Grain boundary effects have been modelled successfully by impedance spectroscopy for ceramic materials. An intermediate arc is often observed in the impedance plane. The equivalent circuit usually contains a separate circuit for the grain interior, the grain boundary and the electrode effects. It has been shown that the presence of intragranular and intergranular pores modifies the impedance plots of certain ceramics by altering the conductivities of these materials [9]. The interfaces between agglomerates of C-S-H sheets may, for argument, be considered analogous to grain boundaries.
The impedance spectra observed in Figure 6 show some indication of the presence of an intermediate arc particularly at 48 and 72 hours. This was not taken into consideration in the circuit analysis described earlier. These arcs are non-ideal and flatten out at higher values of the real resistance. The arcs are more distinct in spectra (not shown) for cement paste dried and resaturated with synthetic pore solution. The changing nature of the arcs with time might be interpreted as a shift or change in grain boundary (defined as C-S-H interfacial regions) space due to the applied load. This would appear to support the argument that the rate determining mechanism for creep is associated with the behavior of the C-S-H sheets themselves, perhaps involving a slipping and sliding process. This is
consistent with the reported observation that D-dried cement paste (no free water present) exhibits significant creep [28].
CONCLUSIONS
1. A.C. impedance spectroscopy can detect real-time microstructural changes in cement paste subjected to a sustained load.
2. There is a systematic time-dependent growth in the size of the impedance high-frequency arc for loaded cement paste.
3. The size increase of the high-frequency arc diameter is apparently related to changes in the electrical properties of the solid-liquid interface (C-S-H/pore solution) and pore structure parameters induced by the sustained load.
4. There is a time-dependent increase in the high-frequency arc depression angle parameter for cement paste subjected to a sustained load. This is indicative of a spread of relaxation times resulting from a broadened pore size distribution possibly resulting from layering or consolidation of C-S-H particles.
5. A grain boundary sliding anology (for cement paste) with the observed impedance behavior in certain ceramics is insightful. There is some indication that an
intermediate arc attributed to grain boundary effects in ceramics may be present in the impedance spectra for cement paste particularly at later ages.
REFERENCES
[1] X. Yumping and H.M. Jennings, in Materials Science of Concrete III, edited by J. Skalny (The American Ceramic Society, Westerville, 1992), p. 37.
[2] J.F. Young, in Proc. First Australian Conference on Engineering Materials, (Sidney, 1974), p. 3.
[3] A.M. Neville, Creep of Concrete: Plain, Reinforced and Prestressed, (North Holland Publishing Company, Amsterdam, 1970), p. 258.
[4] V.S. Ramachandran, R.F. Feldman and J.J. Beaudoin, Concrete Science, (Heyden & Son, London, 1981), p. 427.
[5] T.C. Powers, in Proc. Int. Conf. On Structure of Concrete (Cement and Concrete Assoc., London, 1968), p. 319.
[6] R.F. Feldman, Cement Concrete Research, 2, 509 (1972).
[7] P. Gu, P. Xie, Y. Fu and J.J. Beaudoin, in Materials Science of Concrete IV, edited by J. Skalny and S. Mindess (The American Ceramic Society, Westerville, 1995), p. 201.
[8] P. Gu, P. Xie, Y. Fu and J.J. Beaudoin, Cement Concrete Research, 24, 704 (1994).
[9] J.R. Macdonald, Impedance Spectroscopy (John Wiley, New York, 1987), 201.
[10] B.J. Dalgliesh, P.L. Pratt and E. Toulson, Journal of Mater. Sci. 17, 2199 (1982). [11] W.J. McCarter and A.B. Afshar, Journal of Mater. Sci. 23, 488 (1988).
[12] C. Tashira and H. Shimamura, Mater. Sci. Lett. 6, 1379 (1987).
[13] K. Brantervik and G.A Niklasson, Cement Concrete Research 4, 496 (1991). [14] B.J. Christensen, T.O. Mason and H.M. Jennings, in Proc. Mat. Res. Soc. Symp.
No. 245, edited by F.P. Glasser (Boston, 1992), p. 259.
[15] W.J. McCarter and S. Garvin, Journal of Physics. D. Applied Physics 22, 1773 (1989).
[16] W.J. McCarter and P.N. Curran, Magazine Concrete Research 36, 42 (1984). [17] W.J. McCarter, S. Garvin and N. Bouzid, Journal of Material Science 7, 1056
[18] P. Gu, P. Xie, Y. Fu and J.J. Beaudoin, Cement Concrete Research 24, 86 (1994). [19] Z. Xu, P. Gu, P. Xie and J.J. Beaudoin, Cement Concrete Research 23, 853 (1993). [20] K.S. Cole and R.H. Cole, J. Chem. Phys. 9, 341 (1941).
[21] C.A. Scuderi, T.O. Mason and H.M. Jennings, Journal of Mater. Sci. 26, 349 (1991).
[22] P. Xie, P. Gu and J.J. Beaudoin, Cement Concrete Research 23, 359 (1993). [23] N.H. Brown and B.B. Hope, Cement Concrete Research 6, 475 (1976).
[24] P.J. Sereda and E.G. Swenson, Materials Research and Standards 7, 152 (1967). [25] P. Gu, P. Xie and J.J. Beaudoin, Cement and Concrete Composites 15, 173 (1993). [26] T. Pajkassy and L. Nyikos, Electrochem. Soc: Electrochemical Science and
Technology 133, 2061 (1986).
[27] G.J. Brug, A.L.G. Van den Elden, M. Sluyters-Rehbach and J.H. Sluyters, J. Electroanal. Chem. 176, 275 (1984).
FIGURE CAPTIONS
Fig. 1 (a) Schematic plot of a high frequency arc in the impedance complex plane
obtained for cement paste systems.
(b) A simplified electrical equivalent circuit for hydrating cement systems. R1,
R2 and C2 are high-frequency resistance, solid-liquid interface resistance and
capacitance. Rct and Cdl are cement-electrode interface charge transfer
resistance and double layer capacitance.
Fig. 2 The Stern model of the solid-liquid interface.
Fig. 3 Experimental creep frame showing linkage of the a.c. impedance measurement
system.
Fig. 4 Detail of ‘T-shaped’ specimen-electrode connection interface.
Fig. 5 A typical total strain (creep and shrinkage) and strain recovery curve for
hardened cement paste (w/c = 0.50) obtained in this study. The paste was conditioned at 96% RH.
Fig. 6 A.C. impedance spectra: total strain of hydrated portland cement paste (w/c =
0.50) specimens conditioned at about 96% RH for 0, 1, 2, 3.7, 6.5, 9, 12.7, 24, 48 and 72 hours.
Fig. 7 High-frequency arc diameter, R2, versus time under load for cement paste (w/c
= 0.50) tested at 96% RH.
Fig. 8 The depression angle parameter, n, versus time as determined from the high
frequency arc for cement paste (w/c = 0.50). The cement paste was subjected to a sustained load at 96% RH.
Real (ohms)
Imaginary (ohms)
R1 R1+R2
(a)
Bulk cement paste effect Electrode effect
R1
R2
C2 Cdl
Rct
(b)
Bulk cement paste effect Electrode effect
Figure 1. (a) Schematic plot of a high frequency arc in the impedance complex plane obtained for cement paste systems. (b) A simplified electrical equivalent circuit for hydrating cement systems. R1, R2, and C2 are high-frequency resistance, solid-liquid
interface resistance and capacitance. Rct and Cdl are cement-electrode interface charge
δd Solid Diffuse layer Bulk liquid Stern layer δεl
Frequency response analyser Computer Spring Main frame Ball bearing 95 mm 90 mm 95 mm Load cell T-shaped specimen Solatron 1260
Figure 3. Experimental creep frame showing linkage of the AC impedance measurement system
T-shaped specimen
Stainless steel electrode interface
Tefflon insulation
time, hours m icrostrain, m/m 0 100 200 300 400 500 0 20 40 60 80 100 120 140 Cement paste (w/c=0.50)
Figure 5. A typical total strain (Creep + Shrinkage) and strain recovery curve for hardened cement paste (w/c=0.50) obtained in this study. The paste was conditioned at about 96% relative humidity.
-20000 -15000 -10000 -5000 0 0 10000 20000 30000 40000 50000 Real, ohms Imaginary, ohms
Figure 6. AC impedance spectra: total strain of hydrated Portland cement paste (w/c=0.50) specimens conditioned at about 96% RH for 0, 1, 2, 3.7, 6.5, 9, 12.7, 24, 48 and 72 hours.
time, hours sem i-circle diam eter R 2 , ohms 0 5000 10000 15000 20000 25000 30000 35000 40000 45000 0 10 20 30 40 50 60 70 Cement paste (w/c=0.50) 80
Figure 7. High-frequency arc diameter, R2 versus time under load for cement paste
time, hours
depression angle param
e ter, n 0.6 0.7 0.8 0.9 1 0 10 20 30 40 50 60 70 Cement paste (w/c=0.50) 80
Figure 8. The depression angle parameter, n, versus time as determined from the high frequency arc for cement paste (w/c=0.50). The cement paste was subjected to a sustained load at 96% RH.