HAL Id: hal-02902416
https://hal.archives-ouvertes.fr/hal-02902416
Submitted on 19 Jul 2020
HAL is a multi-disciplinary open access
archive for the deposit and dissemination of
sci-entific research documents, whether they are
pub-lished or not. The documents may come from
teaching and research institutions in France or
abroad, or from public or private research centers.
L’archive ouverte pluridisciplinaire HAL, est
destinée au dépôt et à la diffusion de documents
scientifiques de niveau recherche, publiés ou non,
émanant des établissements d’enseignement et de
recherche français ou étrangers, des laboratoires
publics ou privés.
Sandfox Project: Optimizing the Relationship between
the User Interface and Artificial Intelligence to Improve
Energy Management in Smart Buildings
Christophe Bortolaso, Stéphanie Combettes, Marie-Pierre Gleizes, Bérangère
Lartigue, Mathieu Raynal, Stéphanie Rey
To cite this version:
Christophe Bortolaso, Stéphanie Combettes, Marie-Pierre Gleizes, Bérangère Lartigue, Mathieu
Ray-nal, et al.. Sandfox Project: Optimizing the Relationship between the User Interface and Artificial
Intelligence to Improve Energy Management in Smart Buildings. 1st International Conference on
Artificial Intelligence in HCI, Jul 2020, Copenhague, Denmark. �hal-02902416�
Optimizing the Relationship between the User
Interface and Artificial Intelligence to Improve
Energy Management in Smart Buildings
Christophe Bortolaso1, St´ephanie Combettes2, Marie-Pierre Gleizes2,
Berangere Lartigue3, Mathieu Raynal4, and St´ephanie Rey1
1
Berger-Levrault, France
{firstname.lastname}@berger-levrault.com
2
SMAC team, IRIT lab, University of Toulouse, France {firstname.lastname}@irit.fr
3 LMDC, University of Toulouse, France
4 ELIPSE team, IRIT lab, University of Toulouse, France
Abstract. This paper deals with energy efficiency in buildings in order to mitigate the climate change. Buildings are the highest source of energy consumption worldwide. However, a large part of this energy is wasted, mainly due to poor buildings management. Therefore, being accurately informed about consumptions and detecting anomalies are essential steps to overcome this problem.
Currently, some software exist to typically record, store, archive, and visualize big data such as the ones of a building, a campus, or a city. Yet, they do not provide Artificial Intelligence (AI) able to automatically analyze the streaming data to detect anomalies and send alerts, as well as adapted reports to the different stakeholders.
The system designed in the sandfox project has for objective to fill this gap. To improve the energy management, an innovative system should aim at visualizing the streaming data, editing reports, and detecting anomalies, for different stakeholders, such as policy makers, energy man-agers, researchers, technical staff or end-users of these buildings. The paper presents the User-Centred Design approach that was used to collect the required needs from different stakeholders. The developed AI system is called sandman (semi-Supervised ANomaly Detection with Multi-AgeNt systems). It processes data in a time constrained manner to detect anomalies as early as possible. sandman is based on the paradigm of self-adaptive multi-agent systems.
The results show the robustness of the AI regarding the detection of noisy data, of different types of anomalies, and the scaling.
Keywords: Dashboard · Anomaly detection · Energy management · Smart buildings.
1
Introduction
This paper deals with energy efficiency in buildings in order to mitigate climate change. Buildings are the highest source of energy consumption worldwide [7]. However, a large part of this energy is wasted [18], mainly due to poor buildings management [2][12]. Therefore, being accurately informed about consumption and detecting anomalies are essential steps to overcome this problem.
Currently, some software exist to typically record, store, archive, and visualize big data such as those of a building, a campus, or even a city. They provide simple reports on the data. They are well suited to provide data visualization dashboards on any device (tablets, phones, and computers). Yet, they do not provide Artificial Intelligence (AI) able to automatically analyze the data flow to detect anomalies and send alerts, as well as reports adapted to the different stakeholders.
To improve energy management, a single system should aim at visualizing the streaming data and detecting anomalies for those interested either in build-ings and networks maintenance, or in energy management. Such users may be policy makers, energy managers, researchers, technical staff or end-users of these buildings and networks. Depending on their function, they need to visualize on an innovative dashboard different kinds of data and their dynamics, as well as dysfunction alerts.
The system designed in the sandfox project aims to fill this gap. The sand-fox project involves the French company Berger-Levrault and the University of Toulouse III - Paul Sabatier, through a multidisciplinary team composed of ergonomists, energy specialists and computer scientists specialised in Human-Computer Interaction (HCI) and AI.
Our contribution can be summarized as follows: the development of a semi-supervised generic AI system able to detect anomalies in streaming data from smart buildings, coupled with an interactive dashboard adapted to different stakeholders.
Section 2 presents the sandfox project. Section 3 presents the user-centred interface. Section 4 is dedicated to sandman (semi-Supervised ANomaly De-tection with Multi-AgeNt systems), a generic and novel approach for automatic anomaly detection and features some experiments conducted with sandman. Lastly, we will expose a conclusion and list some perspectives for the future of sandfox.
2
The SANDFOX Project
The main objective of sandfox project is to design and develop a dashboard dedicated to the energy management of buildings. sandfox allows to visualize energy consumption in different ways, and in order to improve the energy man-agement, it is associated to the sandman system. The sandman system detects different types of anomalies in streaming data from buildings.
The sandfox dashboard targets different stakeholders, such as policy mak-ers, energy managmak-ers, researchmak-ers, technical staff or end-users of these buildings
and networks. Indeed, depending on their function, users need to visualize dif-ferent kinds of data and their dynamics, as well as dysfunction alerts:
1. For example, the technical staff in charge of the maintenance of buildings and fluids (gaz, water) networks need all the relevant data issued by thousands of sensors.
2. Due to the huge quantity of data, an AI system is necessary to help them in detecting anomalies that could deteriorate the energy management; 3. HCI is also required to easily visualize the relevant data: (1) An energy
manager would not need that level of data but the consumption over time for different buildings in order to propose solutions to mitigate the energy demand; (2) Policy makers would need global reports on the energy con-sumption; (3) Researchers may need detailed data on Heating Ventilation Air-Conditioning (HVAC) systems, specific sensors, over time, in order to conduct some research projects;
4. Depending on the stakeholders, the details level for the visualization is also different: it can be a room, a building, or a campus. sandfox is therefore multi-scale.
The interactive dashboard is the core of the sandfox project to allow the visualization and the analysis of such massive and complex data. The scientific contribution of sandfox is the interaction between the user-centered interface and the AI that supports each other.
The data processed by sandfox come from the buildings and fluids distri-bution networks of the University of Toulouse - Paul Sabatier campus. They are provided by the SGE, the organisation in charge of the energy and fluid con-sumptions to the University. The SGE manages about 6000 sensors measuring at least one value per hour. In addition, sandfox uses the data issued from sen-sors (temperature, illuminance, CO2, humidity, occupancy, etc.) deployed on the
campus by the scientific project neOCampus1. With the massive growth of the Internet of Things, the number of sensors in existing and new buildings sharply increased due to their low cost and their benefit in the buildings management. Sensors can be easily added in buildings or replaced by others. Consequently, the management of these sensors in situ, as well as the data they generate make building managers face a complex system.
An accurate control of the data is required for an optimal management of the energy on the campus. To do so, within the sandfox project, a tool to automatically detect anomalies in streaming data, sandman (semi-Supervised ANomaly Detection with Multi-AgeNt systems), is coupled to the innovative HCI. sandman is an important asset for buildings managers because it processes data in constrained time to detect anomalies as soon as possible and allows them to quickly solve problems in situ. Because the huge dataset, the research space of the anomalies is also substantial and cannot be done manually. sandman learns to detect anomalies in a semi-supervised way thanks to the feedback of an expert of the domain. sandman is based on a life-long learning self-adaptive multi-agent system.
1
3
Interactive Dashboard
3.1 User-Centred Design
In order to take into account the needs of different users to guide the design of the sandfox dashboard, we have implemented a User-Centred Design method with the different stakeholders.
This method was first described in a book edited by Norman and Draper in 1985. It states: “User-Centred Design places the user at the centre of the design process, from the initial analysis of user needs to testing and evaluation” [1]. In 1999, an international standard ISO 13407 was introduced to formalise the “hu-man operator-centred design process for interactive systems”. This standard was then revised by ISO 9241-210 in 2010. It specifies the criteria for the implemen-tation of the user-centred design process: the prior understanding of the users, their tasks and their environment; the active involvement of users throughout the product development; the iteration between the different steps of the design process; the constitution of a multidisciplinary design team; the appropriate distribution of functions between users (habits, personalities, skills) and tech-nology (performance, functionalities). The iterative design cycle is composed of four main stages: 1) understanding the activity and needs, 2) idea generation and design, 3) system prototyping, and 4) evaluation of the solutions with the users [13].
We used a User-Centred Design approach to better take into account the needs, skills and behaviours of the different users. First of all, we identified all the people who might use the interactive dashboard to visualise energy data. In addition to the current users who regularly analyse these data, we also considered the people who could benefit from them if data were presented in a more user-friendly manner than the large tables of values.
We then categorised them according to the use they would make of this dash-board: energy manager, SGE (building and network maintenance), DGS (policy maker), energy researcher and campus user. We then conducted interviews with one user from each type of profile who is currently using the data from the uni-versity’s meters, allowing us to better understand their work and needs. These meetings allowed to explain their tasks, the tools they currently use, the prob-lems they encounter, and their needs in order to better use this data.
The different tasks extracted from these interviews were translated into re-quirements and usage scenarios for a future sandfox dashboard. An example scenario is presented below:
Flavie wishes to compare the electricity consumption of buildings U3 and U4 over the last winter period. After selecting the type of data and the buildings by switching to a map display, she adjusts the dates to have only the data between December 1, 2017 and February 28, 2018. The cumulative consumption over these 3 months shows that building U3 consumed 14 % more than building U4. In order to understand this difference, she chooses to display the consumption graphs of both build-ings. This view shows that over-consumption occurs mainly during the
Christmas holiday period. Flavie decides to refine the time scale and to display the graphs only for the period from December 15 to January 8. Finally, she displays the graph for each electricity sensor in the U4 building to try to understand where this over-consumption comes from. After analysing the anomaly, Flavie wants to add an alert on building U4. She configures the notification settings, as this is the first alert she adds to the application. She chooses to be notified on the application and by email. She adds a threshold of 1500 kw/h on building U4. This alert is added to the alerts list available in the alerts tab.
Based on these scenarios and requirements, several iterative brainstorming and low-fidelity prototyping steps allowed us to come up with the solution pre-sented in next section.
3.2 Visualisation, Selection and Comparison of Data
All users need to view the energy data by manipulating different criteria : the type of energy (electricity, water, calories, ...), location (building, floor, room, ...) and the period of time.
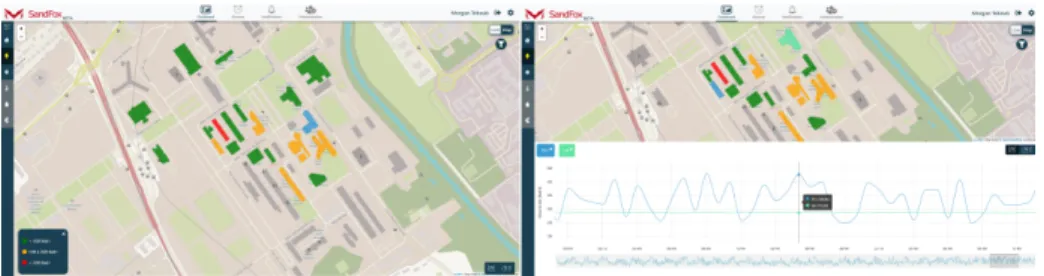
A majority of users use this dashboard to control the energy consumption of buildings for different fluids. To make this task easier, users need tools to filter data by type, location and time period. The fluid is selected using the list displayed on the left of the dashboard (cf. Figure 1, on the left). Once the fluid has been selected, the buildings are coloured on the map according to their daily consumption. Each colour (green, orange, red) corresponds to a value interval (the legend for each fluid is displayed on the left bottom corner of the map). In order to be able to compare the buildings with each other, the energy consumption is normalised with respect to the surface of the buildings.
Fig. 1. On the left, the electricity is selected. The interactive map is displayed with the coloured buildings according to their consumption; On the right, buildings 1R1 and U4 are selected. Their electricity consumption is displayed on the timeline
By clicking on a building, the building is selected. Its energy consumption is displayed by timeline under the interactive map (cf. Figure 1, on the right). By default, the timeline displays the data for the last 30 days. The user can increase
or decrease this period of time by using the selector under the timeline. The user can also display a specific value of the timeline by hovering over it with the mouse pointer.
Users regularly compare several buildings. This comparison is possible on the dashboard by clicking on each desired building. The energy data for each building appears as a curve on the timeline. The names of the different selected buildings are displayed above the timeline in a rectangle of the same colour as the data curve for this building.
3.3 Alarms Management and Notifications System
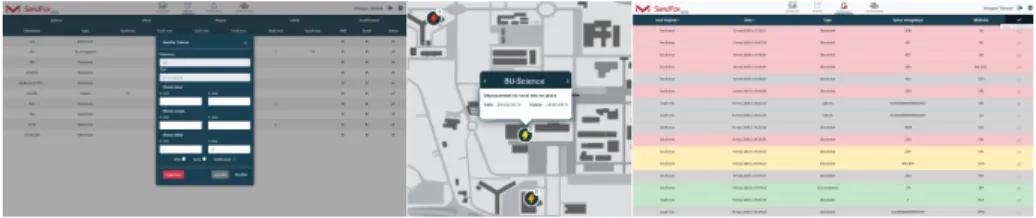
Users can define limits for energy values that buildings should not exceed. They can define three minimum and maximum values for the same alarm (cf. Figure 2, on the left). This helps to determine the severity of the problem. If one of the limits is exceeded, the user is then informed of the anomaly on the map: a dot appears on the concerned building. This dot displays the type of energy, the number of anomalies and is coloured according to the severity of the anomaly (see figure 2, center). The user can click on it if he wishes to have more information on the problem. He can also go to the notifications page where he will have the list of all the anomalies, with the detail of the values (cf. figure 2, on the right).
Fig. 2. left, Dialog box for creating an alarm; centre, display of notifications on the Map; right, interface listing the information of each detected anomaly
4
AI System: SANDMAN
In this section, we present sandman, the semi-Supervised ANomaly Detection with Multi-AgeNt systems. We start by defining an anomaly and the criteria that an anomaly detection system should solve. We continue by a literature review on the relevant work. The core of the algorithm is then presented as well as some experiments showing the validity of the algorithm.
4.1 Definition of an Anomaly
In their review on anomaly detection, Chandola et al. [4] define an anomaly as ”an unexpected or undesirable behaviour in a system” and they point out three kinds of anomalies:
– point: the measure is outside an acceptable range for the sensor,
– contextual: the measure is inside an acceptable range for the sensor but anomalous in some contexts (example: high heating consumption during summer),
– collective: a collection of measures is anomalous with respect to the en-tire data set although the individual measures may not be anomalous in themselves.
4.2 Criteria for a Smart Building Anomaly Detection System A smart building equipped with sensors generates a large amount of available data that must be analysed to improve energy management. Thus, the design of anomaly detection systems has to take into account the following characteristics:
– constrained-time detection,
– detection of several types of anomalies, – use of raw and heterogeneous data, – scaling,
– genericity.
4.3 Relevant Work on Anomalies Detection
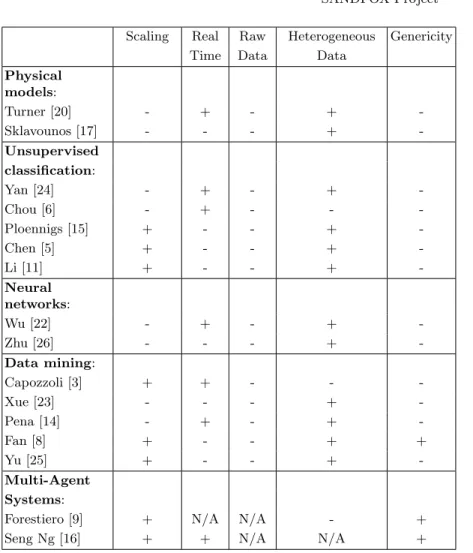
This section presents the state of the art of anomaly detection in smart buildings. The methods presented below have been analysed under the prism of the criteria defined above, necessary for an anomaly detection system. In this context, the methods and techniques featured in the literature are classified into the following categories:
Physical models. This category gathers methods that require prior mod-elling of physical laws, such as building modmod-elling, or heat exchanges between the inside and outside of a building. Physical models rely on an expert’s knowledge and on specifying the type of tracked anomaly. It quickly becomes impractical regarding scalability.
Unsupervised classification and statistics. These methods are generally based on statistical studies using different techniques (ARIMA (Auto-Regressive Integrated Moving Average) method, ARMA (Auto-Regressive Moving Average) method, PCA (Principal Component Analysis), wavelets, etc.). Unsupervised classification methods have no access to expert feedback and are then ill suited for anomaly detection when considering that anomalies are undesired events from a human perspective rather than rare events.
Neural networks. Neural networks are an important family of methods of non-statistical classifiers [21]. Nevertheless, they are rarely used for anomaly detection in smart buildings. Even though neural network can detect anomalies in real-time, a large set of labelled data is required to train the neural network before it can detect anomalies. This reliance on training data is problematic as labelling data is a fastidious task. Also, even with a large enough training set, it is still possible that some kinds of anomalies will not show up. Indeed,
anomalies not present during the learning phase (so not learned), will not be detected during the detection phase.
Data mining. Data mining methods extract knowledge from large amounts of data. Unlike most other method families, these methods can usually extract collective or contextual anomalies in addition to point anomalies. Data mining methods require special attention during data pre-processing and a human is required to help in the selection of the most relevant inputs to allow scalability. Multi-agent systems and decentralised systems. Our sandman model uses a multi-agent system. It is worth noting that multi-agent systems have been widely used in the management of the operations of HVAC systems in buildings [10], but not for anomaly detection in this sector. Yet, Forestiero [9] and Seng Ng et al. [16] proposed two generic anomaly detection systems based on Multi-Agent Systems (MAS) that could be adapted to the building sector.
Table 1 presents a summary of the methods described above. In view of the adequacy of the methods presented to the criteria requested for anomaly detection, we can see that none of them exactly meets our needs.
Many studies focus only on building subsystems, such as heating or electrical energy consumption at different locations in the building. These studies fulfil their objectives but their ability to treat all the systems in a building in a generic way has not been shown.
To date, little research has been conducted to use heterogeneous sensors without knowledge of their data types.
In addition, all the studies use data pre-processing requiring human expertise, either by handpicking the data or by providing labelled data-sets to learn the relevant data.
In summary, this literature review on anomaly detection in buildings shows that none method is able to satisfy all the criteria. This gap convinced us to propose a semi-supervised method using multi-agent systems. The method is presented below.
4.4 Relation between the AI and the Expert
The management of data issued from the buildings and fluids distribution net-works (heating, water, electricity, etc.) at the scale of a campus is complex. Failures, dysfunctions, alarms, etc., are usual. Detecting them as soon as possi-ble is critical to avoid waste of energy or fluids. The help of an AI is necessary to face the complexity due to the quantity of data to be processed and to the correlations between data to detect.
We developed sandman, to detect anomalies in raw and heterogeneous data sets. sandman learns all along its functioning. To do so, an expert of the field, in our case an expert in buildings management, supervises the classifications (normal or anomaly) proposed by sandman by confirming or dis-confirming them. The feedback from the expert to sandman allows the system to learn from its mistakes and therefore increases its efficiency with time.
Scaling Real Raw Heterogeneous Genericity Time Data Data
Physical models: Turner [20] - + - + -Sklavounos [17] - - - + -Unsupervised classification: Yan [24] - + - + -Chou [6] - + - - -Ploennigs [15] + - - + -Chen [5] + - - + -Li [11] + - - + -Neural networks: Wu [22] - + - + -Zhu [26] - - - + -Data mining: Capozzoli [3] + + - - -Xue [23] - - - + -Pena [14] - + - + -Fan [8] + - - + + Yu [25] + - - + -Multi-Agent Systems:
Forestiero [9] + N/A N/A - +
Seng Ng [16] + + N/A N/A +
Table 1. Synthesis of anomaly detection methods in smart buildings in the literature
The feedback is given through an interface that has to take into account the huge quantity of data. It has to be designed so it is ergonomic: easy to use, easy feedback, and simple and evolving display.
The relation between the AI and the expert is two-way: the expert needs the AI to process the quantity of data and allows him to visualise more easily the points of interest. The AI needs the expert to improve its functioning while taking into account streaming data.
4.5 Presentation of the SANDMAN Operating Steps
sandman works with unprocessed (raw) time-stamped data from all types of (heterogeneous) sensors.
We have defined two concepts of situation : (1) A situation is the set of measured values of all sensors over 24 hours; and (2) a current situation is the last (current) situation encountered. These situations are stored in a situation history.
Each sensor is associated with a profile learnt in real time by sandman. A profile consists of 24 stored measured values (one for each hour of the day). A profile value is a value computed from all the previous nominal measured values (of this sensor), at the same hour of the day. This value becomes the value expected of the sensor for this hour. Thus a profile is a set of expected data updated by sandman throughout the system life.
Detecting and Classifying Anomalies. To detect an anomaly, sandman uses the profile of the sensors and the current situation. To this aim, it computes the disparity of a sensor. The disparity is the sum (in absolute value) of all the differences between the sensor profile and the measured values of this sensor for the current situation (Eq. 1).
Disparityst= t−23 X ti=t realV alueti s − nominalV alue ti s (1)
with s: sensor s; t: time t of the current situation; realV alueti
s: real value of
sensor s at time ti; nominalV aluetsi: nominal value of sensor s at time ti.
The period under consideration is a sliding 24-hour window. From the current time-stamp (for ex. 13:00), the 24 previous hour are considered (from 14:00 the previous day to 13:00 the current hour). Then, sandman computes the Degree of Anomaly (DA) of the current situation. The DA is the weighted sum of the measured values of all the sensors (the value of the current situation) (Eq. 2).
DA(Situationt) =
S
X
s=1
Disparityst∗ W eights (2)
with Situationt: Situation at time t; S: number of sensors; Disparityt
s: Disparity
of the sensor s at time t; W eights: Weight of the sensor s.
Thanks to the Degree of Anomaly, sandman is able to classify the current situation, i.e. labels it as ”normal” or ”anomalous” by algorithm 1. The threshold
Algorithm 1 Algorithm of classification or anomalies detection 1: for each new current situation do
2: if DA < Threshold then
3: sandman returns : ”the situation is normal” 4: else
5: sandman returns : ”the situation is anomalous” 6: end if
is a static number chosen arbitrarily (1000 for sandman). The calculation of each weight adjusts to the threshold whatever its value. sandman classifies the situation (on the correct side of the threshold) according to the value of this weight. Note that the DA also depends of the threshold value.
To correctly detect anomalies, each W eightsiassociated with one of the
sen-sors must therefore be correctly evaluated. Each sensor has only one associated weight used to calculate the degree of anomaly for all situations in the situation history. This weight is recalculated at each resolution cycle to take into account the situation changes.
To each resolution cycle, once the current situations classified, sandman gives this classification (normal or anomalous) to the expert. The expert (pos-sibly later after this detection) checks the classification and validates (allowed) or invalidates (compulsory) it. This feedback is sent to sandman.
Analysing Expert’s Feedback. Once sandman has classified a situation (as normal or anomalous) and has an expert’s feedback on this situation, the follow-ing resolution cycle enables sandman to analyse whether or not it has to learn. The following are the various cases sandman must analyse :
1. For a situation classified as ”anomalous” by both sandman and the expert, – sandman does nothing
2. For a situation classified as ”anomalous” by sandman and ”normal” by the expert, sandman
– updates the sensor profiles
– creates and adds this ”normal” situation to the situation history – self-adapts the weights of the sensors
3. For a situation classified as ”normal” by sandman and ”anomalous” by the expert, sandman
– creates and adds a new ”anomalous” situation to the situation history – self-adapts the weights of the sensors
4. For a situation classified as ”normal” by both sandman and the expert, – sandman updates the sensor profiles.
Learning the Profiles. sandman updates the sensor profile only if the sit-uation is normal for both sandman and the expert. Indeed, sensor values of an anomalous situation are neither reliable nor expected. Each sensor profile changes the value corresponding to the time of the analysed situation.
Updating the history of situations. During this operation all the situations in the history must be correctly and evenly classified. A situation is correctly classified if its degree of anomaly (DA) enables to deduce the correct classifica-tion of this situaclassifica-tion. In order to have a balanced classificaclassifica-tion of situaclassifica-tions, the DA of the ”normal” situation closest to (and below) the threshold and the DA of the anomalous situation also closest to (and above) the threshold are, in ab-solute value, at the same distance from the given threshold. An normal situation
must be below the threshold whereas a anomalous situation must be above the threshold. To have a balanced classification of the situations, the weight of the sensors self-adapt.
Self-Adapting Weights. Each weight is represented by a weight agent. The goal of the multi-agent weight system is that each weight agent finds its value by cooperating with the others. During a resolution cycle, all situations require weight adjustments and the weight agents self-adapt and then, each situation calculates its new degree of anomaly using the updated weights. From a weight agent point of view, a weight agent decides whether or not it has to update its weight (independently and simultaneously from the other weight agents) once it has received messages from the situations. Agents cooperation guarantees that at least one weight agent updates its weight and that the global state is better. Once the update cycle of the weight agents is over, the system checks that each situation is well-classified by calculating t. Indeed, the best way to reduce the rate of wrong classification and thus to have a robust system, is to keep the two situations closest to the threshold (recorded in the history) as far away from the threshold as possible.
4.6 Validation of SANDMAN
In order to check the validity of the anomaly detection system sandman, we have conducted several experiments.
The data used to conduct the experiments were generated using the TSimulus time series generator [19]. These time series include a signed value per hour for each sensor. Each sensor has its own range of values. The values for each sensor are cyclical, with or without noise over a 24-hour period, meaning that the value of a sensor at 3 p.m. is the same every day, with the exception of noise. These simulated data have been then modified by a human expert to introduce several anomalies of each of the three types.
sandman processes the data in constrained-time and the expert gives his opinion a posteriori in an asynchronous way.
All the experiments were carried out on a 4-core processor with a frequency of 2.6 GHz. The data sets used in the following experiments feature one value for each sensor every hour over one month, for a total of 744 hours. The number of sensors depends on the experiment. Three separate data files are used to show the ability of sandman to: i) detect point anomalies and mitigate noise, ii) detect collective and contextual anomalies, iii) scale.
The experiments have been conducted over one or two months and the results are presented as the number of:
– TN: True Negative, TP: True Positive, – FN: False Negative, FP: False Positive,
Point Anomalies and Noise Mitigation. Point anomalies are the type of anomaly most often detected in the literature, as both univariate and multi-variate approaches can detect them.
In this experiment, we study the efficiency of sandman in detecting point anomalies in noisy data with different levels of noise. The data file contains 20 sensors, i.e. 20 x 744 = 14880 data. 58 point anomalies were added manually by an expert. Three experiments have been conducted, with the noiseless data, 1%-level data and 5%-level data.
Table 2 shows the results of the experiments over a one-month period. 40 over the 58 anomalies have been correctly detected and 18 have been detected as False Negative for a low level of noise in the data. A higher noise level (5%) leads to a higher False Positive rate.
Noise level TP TN FN FP no noise 40 686 18 0
1% 40 686 18 0
5% 58 679 0 31
Table 2. Results of point anomalies detection with noisy data
Collective and Contextual Anomalies. In this experiment, we want to study the ability of sandman in detecting the three types of anomalies: point, contextual and collective anomalies.
The data file contains the values of 20 sensors over one month, and the results are presented after one and two months to show the improvement due to the learning. The 3 types of anomalies have been manually added in the data file. The data have 1% of noise.
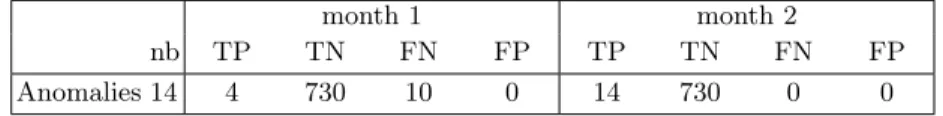
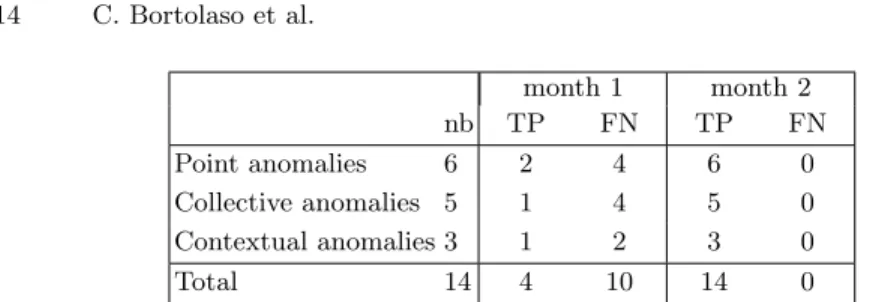
Table 3 shows the general results for our experiment. It features 14 anomalies of all kinds.
Table 4 shows the results of the detection of each type of anomalies in detail: the numbers of each type of anomaly, as well as the anomalies detected after the first month and then after the second month. sandman created and added to the history the situations corresponding to the misclassified situations during the first month, to classify them without error during the second month, regardless of the type of anomaly.
month 1 month 2
nb TP TN FN FP TP TN FN FP
Anomalies 14 4 730 10 0 14 730 0 0 Table 3. General results of anomaly detection with different kinds of anomalies
month 1 month 2 nb TP FN TP FN Point anomalies 6 2 4 6 0 Collective anomalies 5 1 4 5 0 Contextual anomalies 3 1 2 3 0 Total 14 4 10 14 0
Table 4. Detailed results of anomaly detection per type of anomaly
Scaling. The scaling criterion for checking the efficiency of sandman was done in detecting anomalies when the number of sensors increases. To do so, a large number of sensors is used to measure their effect on the computing time. A data set of 20 sensors is duplicated to obtain up to 800 sensors. The data used are the same as the initial data file with 58 anomalies and 1% noise. Table 5 shows the calculation time per situation as a function of the number of sensors. The calculation time of month 2 is always shorter than the calculation time of month 1 because the learning of the weights is only carried out in month 1. We also note that the resolution time is proportional to the number of sensors used and that the time difference between the two months is constant. This is due to the fact that most of the execution time comes from reading the raw data from a database, which has a fixed cost per sensor.
number of sensors month 1 t/sit (ms) month 2 t/sit (ms)
20 2.7 1.7 40 4.8 3.5 100 22 20 200 48 45 400 102 100 800 185 180
Table 5. Results of scaling
5
Conclusion
In the context of growing streaming data in the management of buildings, it is necessary to have tools that help the stakeholders in their various tasks. The sandfox project proposes an innovative dashboard that easily provides to the stakeholders the information they need.
Among the different interests of the stakeholders is the detection of the anomalies that can be found in the streaming data, that possibly leads to an
en-ergy waste in buildings. We therefore propose to automatically detect anomalies that are undesirable rather than statistical outliers. In addition to point anoma-lies, collective and contextual anomalies can be detected with our model. The literature review shows that the detection of collective and contextual anomalies is not treated properly. Moreover almost all of the methods in anomaly detec-tion require data pre-processing. Consequently, few methods can lead to a generic anomaly detection system able to operate with all buildings sub-systems.
We develop sandman, a semi-supervised constrained-time anomaly detection system which uses raw data as input and classifies anomalies by learning from expert feedback. Experiments have shown that sandman is able to detect several types of anomalies in a generic manner, and scales well with a large number of sensors. The feedback required from the expert is kept to a minimum as they are given at their convenience. In practice, this operating way is close to the reality of the tasks of a building manager, who has to check on the good operations of a building based on the sensors’ raw data. In future works, sandman shall be able to learn several sets of nominal profiles for the sensors, to account for the different behaviours of the users of the buildings.
In order to make easier the data management, an interactive dashboard has been developed. Thanks to a User Centered Design approach, we collect the required needs from different stakeholders. The user can then select the buildings for which he wants more details. Data for these buildings is presented using a timeline. The user can select several buildings at the same time and select the periods of interest. The user can also create alerts by defining, for a type of energy, the minimum and maximum values. As soon as these values are exceeded, the dashboard notifies the user of this anomaly with a visual feedback on the user interface.
The next step of the project will be to connect the dashboard to the sandman system. The sandman system will replace the user interface of alarm definition (the user will no longer have to set alarms manually as sandman is able to detect and notify anomalies). The notification system will remain unchanged. A dialog box will be added to allow the expert user to validate or not the anomalies proposed by sandman.
Finally, we will deploy sandfox dashboard towards real end-users in the context of the university campus to get feedback on all the aspects of the dash-board.
References
1. Beaudouin-Lafon, M., Mackay, W.E.: Prototyping tools and techniques. In: Human-Computer Interaction, pp. 137–160. CRC Press (2009)
2. Brady, L., Abdellatif, M.: Assessment of energy consumption in existing buildings. Energy and Buildings 149, 142–150 (2017)
3. Capozzoli, A., Lauro, F., Khan, I.: Fault detection analysis using data mining techniques for a cluster of smart office buildings. Expert Systems with Applications 42(9), 4324–4338 (jun 2015)
4. Chandola, V., Banerjee, A., Kumar, V.: Anomaly Detection: A Survey. ACM Com-puting Surveys 41(3), 1–58 (2009)
5. Chen, B., Sinn, M., Ploennigs, J., Schumann, A.: Statistical Anomaly Detection in Mean and Variation of Energy Consumption. In: 2014 22nd International Con-ference on Pattern Recognition. pp. 3570–3575 (2014)
6. Chou, J.S., Telaga, A.S.: Real-time detection of anomalous power consumption. Renewable and Sustainable Energy Reviews 33, 400–411 (may 2014)
7. https://ec.europa.eu/energy/en/topics/energy-efficiency/energy-performance-of-buildings, accessed: 2020-03-17
8. Fan, C., Xiao, F., Madsen, H., Wang, D.: Temporal knowledge discovery in big BAS data for building energy management. Energy & Buildings 109, 75–89 (2015) 9. Forestiero, A.: Self-organizing anomaly detection in data streams. Information
Sci-ences 373, 321–336 (2016)
10. Labeodan, T., Aduda, K., Boxem, G., Zeiler, W.: On the application of multi-agent systems in buildings for improved building operations, performance and smart grid interaction – A survey. Renewable and Sustainable Energy Reviews 50, 1405–1414 (2015)
11. Li, S., Wen, J.: A model-based fault detection and diagnostic methodology based on PCA method and wavelet transform. Energy and Buildings 68, 63–71 (jan 2014) 12. Lin, M., Afshari, A., Azar, E.: A data-driven analysis of building energy use with emphasis on operation and maintenance: A case study from the uae. Journal of Cleaner Production 192, 169–178 (2018)
13. Mackay, W.E.: Educating multi-disciplinary design teams. Proc. of Tales of the Disappearing Computer pp. 105–118 (2003)
14. Pe˜na, M., Biscarri, F., Guerrero, J.I., Monedero, I., Le´on, C.: Rule-based system to detect energy efficiency anomalies in smart buildings, a data mining approach. Expert Systems with Applications 56, 242–255 (sep 2016)
15. Ploennigs, J., Chen, B., Schumann, A., Brady, N.: Exploiting Generalized Addi-tive Models for Diagnosing Abnormal Energy Use in Buildings. In: Proceedings of the 5th ACM Workshop on Embedded Systems For EnergyEfficient Buildings -BuildSys’13. pp. 1–8 (2013)
16. Seng Ng, Y., Srinivasan, R.: Multi-agent based collaborative fault detection and identification in chemical processes. Engineering Applications of Artificial Intelli-gence 23(6), 934–949 (2010)
17. Sklavounos, D., Zervas, E., Tsakiridis, O., Stonham, J.: A Subspace Identification Method for Detecting Abnormal Behavior in HVAC Systems. Journal of Energy 2015, 1–12 (2015)
18. https://www.iea.org/reports/the-critical-role-of-buildings, accessed: 2020-03-17 19. https://tsimulus.readthedocs.io/en/latest/, accessed: 2019-12-18
20. Turner, W.J., Staino, A., Basu, B.: Residential HVAC fault detection using a sys-tem identification approach. Energy and Buildings 151, 1–17 (2017)
21. Venkatasubramanian, V., Rengaswamy, R., Kavuri, S.N., Yin, K.: A review of process fault detection and diagnosis: Part III: Process history based methods. Computers & Chemical Engineering 27(3), 327–346 (mar 2003)
22. Wu, J., Zeng, W., Yan, F.: Hierarchical Temporal Memory method for time-series-based anomaly detection. Neurocomputing 273, 535–546 (2018)
23. Xue, P., Zhou, Z., Fang, X., Chen, X., Liu, L., Liu, Y., Liu, J.: Fault detection and operation optimization in district heating substations based on data mining techniques. Applied Energy 205, 926–940 (nov 2017)
24. Yan, K., Ji, Z., Shen, W.: Online fault detection methods for chillers combining extended kalman filter and recursive one-class SVM. Neurocomputing 228(July 2016), 205–212 (2017)
25. Yu, Z.J., Haghighat, F., Fung, B.C., Zhou, L.: A novel methodology for knowledge discovery through mining associations between building operational data. Energy and Buildings 47, 430–440 (apr 2012)
26. Zhu, Y., Jin, X., Du, Z.: Fault diagnosis for sensors in air handling unit based on neural network pre-processed by wavelet and fractal. Energy and Buildings 44, 7–16 (jan 2012)