Publisher’s version / Version de l'éditeur:
Journal of Applied Polymer Science, 75, November 1, pp. 135-141, 2000
READ THESE TERMS AND CONDITIONS CAREFULLY BEFORE USING THIS WEBSITE. https://nrc-publications.canada.ca/eng/copyright
Vous avez des questions? Nous pouvons vous aider. Pour communiquer directement avec un auteur, consultez la première page de la revue dans laquelle son article a été publié afin de trouver ses coordonnées. Si vous n’arrivez pas à les repérer, communiquez avec nous à PublicationsArchive-ArchivesPublications@nrc-cnrc.gc.ca.
Questions? Contact the NRC Publications Archive team at
PublicationsArchive-ArchivesPublications@nrc-cnrc.gc.ca. If you wish to email the authors directly, please see the first page of the publication for their contact information.
NRC Publications Archive
Archives des publications du CNRC
This publication could be one of several versions: author’s original, accepted manuscript or the publisher’s version. / La version de cette publication peut être l’une des suivantes : la version prépublication de l’auteur, la version acceptée du manuscrit ou la version de l’éditeur.
Access and use of this website and the material on it are subject to the Terms and Conditions set forth at
In situ study on kinetic behavior during asymmetric membrane
formation via phase inversion process using Raman spectroscopy
Kim, H. J.; Fouda, A. E.; Jonasson, Kevin
https://publications-cnrc.canada.ca/fra/droits
L’accès à ce site Web et l’utilisation de son contenu sont assujettis aux conditions présentées dans le site LISEZ CES CONDITIONS ATTENTIVEMENT AVANT D’UTILISER CE SITE WEB.
NRC Publications Record / Notice d'Archives des publications de CNRC:
https://nrc-publications.canada.ca/eng/view/object/?id=e165cc66-1ae5-4dc0-82fa-c22b2b1ca6b2 https://publications-cnrc.canada.ca/fra/voir/objet/?id=e165cc66-1ae5-4dc0-82fa-c22b2b1ca6b2
Membrane Formation via Phase Inversion
Process Using Raman Spectroscopy
H. J. KIM, A. E. FOUDA, K. JONASSON
Institute for Chemical Process and Environmental Technology, National Research Council Canada, Ottawa, Ontario K1A 0R6, Canada
Received 2 February 1999; accepted 29 May 1999
ABSTRACT: Asymmetric membrane formation has been studied by using an in situ analysis developed with a Micro Raman spectroscopy, which emphasizes kinetic aspects of the phase inversion process. Changes in composition with time was successfully measured on the gelation bath-side as well as inside the precipitated phase for the polymer/solvent/nonsolvent system of polysulfone/1-methyl-2-pyrrolidinone/ethanol. The results shows that resulting relative mass transfer rates of solvent and nonsolvent during the phase inversion process strongly influence the final membrane morpholo-gies. In addition, ternary compositions at which phase separation initiates were ex-plored by analyzing the coagulation front.© 2000 John Wiley & Sons, Inc. J Appl Polym Sci 75: 135–141, 2000
Key words: asymmetric membranes; phase inversion process; micro Raman spec-troscopy
INTRODUCTION
Asymmetric microporous polymer membranes are widely prepared by the phase inversion pro-cess during which a thin layer of a viscous poly-mer solution is spread and then impoly-mersed in a gelation medium of nonsolvent. Complicated phe-nomena are involved in this process, such as phase separation of a homogeneous polymer solu-tion into two phases, rich and polymer-lean, and diffusive interchange between the sol-vent and nonsolsol-vent. The former is regarded as a thermodynamic effect, while the latter is a kinetic one. There have been many studies analyzing this process in terms of thermodynamic and kinetic aspects.1– 4Thermodynamic studies were mainly
focused on the relationships between casting con-ditions and final morphologies of the membranes, whereas kinetic studies have related the mass transfer rates of polymer solution and gelation medium occurring at the interface to pore size distribution, skin, and macrovoid formation.5–7It
has been demonstrated that the relative exchange rate of solvent and nonsolvent across the inter-face leads to a range of resulting asymmetric membrane morphologies.
Kinetic measurements have been carried out mainly using optical set-ups8 or monitoring a re-fractive index gradient profile bath-side of the interface.9 –11 Because of the limitations of those methods, only a qualitative growth of precipitated phase can be observed or only the solvent concen-tration in the gelation bath can be detected. In this study, a Micro Raman spectroscopy tech-nique was developed to monitor the composition change in the precipitated phase as well as in the bath. As a molecular characterization tool,
Ra-Correspondence to: H. J. Kim.
NRCC No. 41997.
Journal of Applied Polymer Science, Vol. 75, 135–141 (2000)
© 2000 John Wiley & Sons, Inc. CCC 0021-8995/00/010135-07
man spectroscopy is used to identify bonding and functional groups. Interactions between molecu-lar units and their surroundings also can be readily detected by perturbations in the Raman spectrum. Hydrogen bonding, crystal field split-ting, chain conformation, chain packing, and sol-vation are all examples of modifications to the surrounding electrical field of the molecular unit that will affect the Raman scattering. Chain con-formation and packing changes have been studied in the melting of poly(1-methyladenylic acid)12
and solvent effects on the sol-gel polymerization used to form silica sols.13 Polyacrylamide gels
with varying cross-link concentration have been investigated.14Chain environments of polymers,
effects of ion clustering, or pairing on the Raman spectrum are demonstrated.15A recently reported
technique, Micro Raman16 provides the
advan-tages of increased spatial resolution by sampling areas on the order of a square micrometer, low laser powers due to the concentration of light by the microscope, imaging of the sample and area discrimination, smaller samples needed, and min-imization of fluorescence from some sources. Most evident examples are studies on single crystal lamellae, polymer interfaces, phase separations, oriented material, composite systems, and thin films.16 –19Similarly, spatial resolution has been
used to study the transport of solvents in poly-mers.20In this paper, the kinetic phenomena
dur-ing asymmetric membrane formation will be studied using Micro Raman spectroscopy empha-sizing spatially and time resolved composition change in the vicinity of the interface between the polymer solution and the gelation medium as well as in the coagulation front.
EXPERIMENT Materials
Polysulfone (PSF, Udel 3500, MW 5 50,000) was the polymer used in this study. Reagent grade 1-methyl-2-pyrrolidinone (NMP, Aldrich) was used as received for the solvent and absolute eth-anol (EtOH, Aldrich) was used as nonsolvent. Polymer solutions were filtered through PTFE membranes (Cole-Parmer Instrument Co.) with 0.5-mm pore size.
Optical Microscope and SEM Analysis
Phase separation of the polymer solution was ob-served by optical microscope at magnifications of
25 and 90, during precipitation in ethanol. Details of the experimental method were described else-where.21The cross-sectional membrane
morphol-ogy was examined by a scanning electron micros-copy (SEM, Jeol ISM 5300).
Micro Raman Experiment
Raman spectra were excited with a He/Ne laser (Dilor), operated at a power level of 25 mW and a frequency of 632.8 nm. The polymer solution was held between two optical grade slide glass with a 130-mm space between them. The laser beam is focused to a 10-mm sample point, which is posi-tioned at the different sites of interest. All the measurements were performed at room tempera-ture. Figure 1 illustrates the various interest sites that were studied during membrane forma-tion in this study.
RESULTS AND DISCUSSION
It is well known that membrane morphology strongly depends on the composition of the pre-cursor polymer solution as shown in Figure 2. As the polymer concentration increases, the final morphology of the membrane becomes more sponge-like and macrovoid-free. Figure 3 shows a Raman spectrum of polysulfone. The Raman modes of the polysulfone sample were assigned with reference to several cited references.22,23The
assignments are summarized as follows: the band
Figure 1 Microscopic picture of phase inversion pro-cess. Spectra were taken at three different spots as a function of time.
at 739.3 cm21 is the result of antisymmetric
COSOC stretching and shows an intense band due to out-of-plane benzene ring COH deforma-tion at 788.1 cm21, which will be used in this
study to measure the polysulfone concentration in ternary system during precipitation; two bands at 1073.3 and 1108.3 cm21 are attributed to
sym-metric and antisymsym-metric SO2stretching,
respec-tively, where the symmetric COOOC stretching mode is strongly recognized at 1149.5 cm21 and
weak the antisymmetric mode occurs at 1203.9 cm21; the band at 1585.6 and 1606.6 cm21
corre-sponds to a phenyl ring vibration, and at 3070.8 cm21a COH stretching mode is observed. Raman
spectra of EtOH and NMP are illustrated in Fig-ure 4. Detailed peak assignment can be found in several references.24,25The area of bands at 877.8 cm21for EtOH (symmetric COCOO stretching)
and 924.8 cm21for NMP (COC stretching) were
chosen for quantitative analysis for each
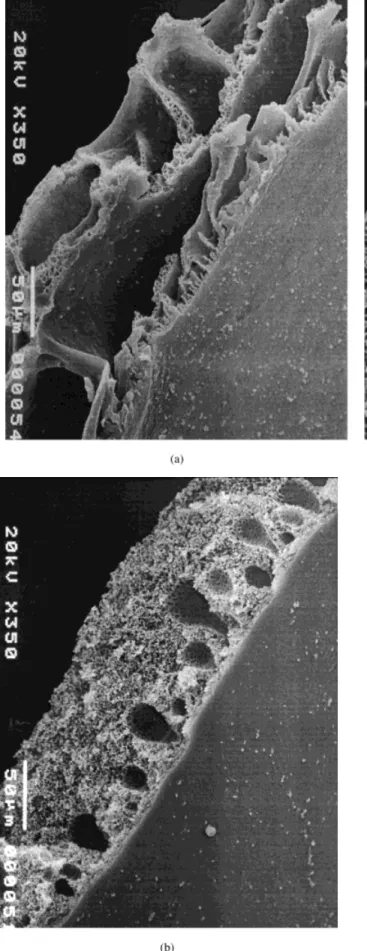
sub-Figure 2 SEM pictures of membranes prepared from different polymer concentrations: (a) 10 wt %, (b) 20 wt %, and (c) 30 wt % of polysulfone in NMP, respectively.
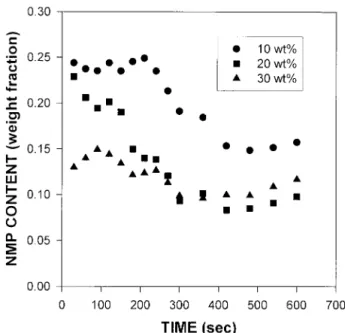
stance, respectively. Calibration results for PSF/ NMP and NMP/EtOH are shown in Figures 5 and 6. The measured spectra were converted to spe-cific concentration based on the calibration re-sults. Raman spectra measured on the bathside of the polymer solution-nonsolvent interface were recorded as a function of time for 20 wt % polymer solution, the results of which are shown in Figure 7. The NMP concentration decreases as time elapses, which is thought to be the result of
mem-brane skin developing during the precipitation. Other spectra were taken at 2.5 minutes after precipitation for different concentration polymer solutions (Fig. 8). For a higher polymer concen-tration solution, it is observed that a relatively lower amount of NMP is detected. This can be explained that with a higher polymer concentra-tion, the skin is formed thicker and faster, pre-venting solvent molecules from diffusing out to bathside. The change of NMP concentration at
Figure 3 Raman spectrum for polysulfone.
Figure 4 Raman spectra for NMP and ethanol.
Figure 5 Calibration curve for polysulfone in NMP.
Figure 6 Calibration curve for NMP in ethanol.
bathside interface is plotted against time and polymer concentration in Figure 9. It decreases for all cases until about 5 min after precipitation. We believe that the NMP concentration at bath-side interface increases too fast to be spectroscop-ically detected at the initial moment of the
pre-cipitation. During this initial period, membrane skin is formed and then starts preventing mass exchange of solvent and nonsolvent. This causes the solvent concentration at bathside interface to decrease because the rate of solvent diffusing out from the precipitated phase into the bathside in-terface decreases until it reaches to equilibrium that the rate of solvent coming into the bathside interface becomes the same as that diffusing into bulk coagulation bath. Then it shows no change in solvent concentration as a function of time. The phase separation for asymmetric membrane for-mation is kinetically completed during this pe-riod. The higher the polymer concentration of the solution is, the denser and thicker the developing membrane skin, resulting in lower solvent con-centration at bathside interface. Raman spectra on membrane side interface were recorded and are shown in Figure 10. Polymer concentration (788 cm21) increases, whereas EtOH
concentra-tion decreases with time. The NMP concentraconcentra-tion hardly changes. As explained above, dense skin is readily formed in the early stage of precipitation as a result of very fast mass exchange between solvent and nonsolvent. In this period, the non-solvent concentration increases so fast that it can hardly be detected spectroscopically as a function of time; then the skin starts to hinder the mass exchange, preventing more nonsolvent from dif-fusing in, while the nonsolvent molecules that already came in diffuse down to the bulk polymer
Figure 7 Raman spectra in bathside interface as a function of time for 20 wt % polymer solution: (a) 0.5, (b) 2.0, (c) 4.0, and (d) 7.0 min after precipitation.
Figure 8 Raman spectra in bathside interface as a function of polymer concentration at 2.5 min after pre-cipitation: (a) 10 wt %, (b) 20 wt %, and (c) 30 wt % of polysulfone in NMP, respectively.
Figure 9 Change of NMP concentration at bath-side interface as a function of time.
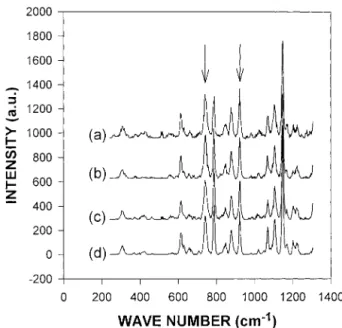
solution. Meanwhile, the solvent concentration does not change very much because it is still easier for solvent molecules to diffuse up to the membrane side interface from the bulk polymer solution. On the other hand, the polymer concen-tration increases, because polymer chains aggre-gate, forming the polymer-rich phase, which is a much slower process than mass exchange be-tween solvent and nonsolvent, so that it can be kinetically monitored with spectroscopic method. By the results of Figures 7 through 10 compared to Figure 2, it can be concluded that the mass transfer rate of solvent and nonsolvent strongly affects the membrane morphology. Figures 11 and 12 show the composition change at the coag-ulation front as a function of time and polymer concentration. It does not change much with time but varies quite a bit with polymer concen-tration. This means the ternary system phase separates in the thermodynamic equilibrium state. In other words, it is independent of time but strongly depends on thermodynamic param-eters, such as solution composition or tempera-ture, whereas the situation at the bathside in-terface or membrane inin-terface is kinetic. Aver-aged compositions of repeated measurements are summarized in Table I. The figures can be considered as exact compositions for these poly-mer solutions to start phase separation, which
corresponds to the cloud points in the ternary diagram.
CONCLUSIONS
The result of this study indicates that the in
situ experiment on kinetic behavior in
asym-Figure 10 Raman spectra in membrane side inter-face as a function of time for 20 wt % polymer solution: (a) 0.5, (b) 2.5, (c) 3.5, and (d) 5.0 min after precipita-tion.
Figure 11 Raman spectra at coagulation front as a function of time for 20 wt % polymer solution: (a) 1.0, (b) 2.0, (c) 5.0, and (d) 7.0 min after precipitation.
Figure 12 Raman spectra at coagulation front at 5 min after precipitation for different polymer concentra-tion soluconcentra-tions: (a) 10 wt %, (b) 20 wt %, and (c) 30 wt % of polysulfone in NMP, respectively.
metric membrane formation was successfully carried out with Micro Raman spectroscopy. The concentration change was easily measured quantitatively at any spot during membrane formation. From the spectroscopic result, the qualitative kinetic comparison between poly-mer solutions during phase inversion process in asymmetric membrane formation can be related to the final membrane morphology. Addition-ally, thermodynamic study to verify the ternary composition at which phase separation takes place was carried out by the coagulation front analysis experiment.
REFERENCES
1. Strathmann, H.; Kock, K. Desalination 1977, 21, 241.
2. Cohen, C.; Tanny, G. B.; Prager, S. J Polym Sci Polym Phys Ed 1979, 17, 477.
3. Wijmanns, J. G.; Kant, J.; Mulder, M. H. V.; Smol-ders, C. A. Polymer 1985, 26, 1539.
4. Reuvers, A. J.; Altena, F. W.; Smolders, C. A. J Polym Sci Polym Phys Ed 1986, 24, 793.
5. Strathmann, H. In Material Science of Synthetic Membranes; Lloyd, D. R., Ed.; ACS Symposium
Series 269; American Chemical Society: Washing-ton, DC, 1985.
6. Reuvers, A. J.; van den Berg, J. W. A.; Smolders, C. A. J Membr Sci 1987, 34, 45.
7. Reuvers, A. J.; Smolders, C. A. J Membr Sci 1987, 34, 67.
8. Cabasso, I. In Synthetic Membranes: Desalination; Turbak, A. F., Ed.; ACS Symposium Series 153, American Chemical Society, Washington, DC, 1981, p. 267.
9. Yilmaz, L.; McHugh, A. J. J Membr Sci 1988, 28, 287.
10. Gaides, G. E.; McHugh, A. J. J Membr Sci 1992, 74, 83.
11. van de Witte, P.; van den Berg, J. W. A.; Feijen, J.; McHugh, A. J. J Appl Polym Sci 1986, 61, 685. 12. Klamp, H.; Strum, J.; Peticolas, W. L. Ber
Bunsen-ges Phys Chem 1981, 85, 661.
13. Artaki, I.; Zerda, T. W.; Jonas, J. J Non-Cryst Sol-ids 1986, 81, 381.
14. Bansil, R.; Gupta, M. K. Ferroelectrics 1980, 30, 63. 15. Neppel, A.; Butler, I. S.; Brockman, N.; Eisenberg,
A. J Macromol Sci Phys 1981, B19, 61.
16. Anderson, M. E.; Muggli, R. Z. Anal Chem 1981, 53, 1772.
17. Tanaka, H.; Ikeda, T.; Nishi, T. Appl Phys Lett 1986, 48, 393.
18. Adar, F.; Noether, H. Polymer 1985, 26, 1935. 19. Cook, C. J. Laser Microprobe Analysis and Laser
Raman Spectroscopy Analysis Techniques for Iden-tification of Organic surface Contaminates, Abstr. 25335, Energy Res Abstr 1987.
20. Klier, J.; Peppas, N. A. Polym Bull 1986, 16, 359. 21. Kang, Y. S.; Kim, H. J.; Kim, U. Y. J Membr Sci
1991, 60, 219.
22. Adams, W. F. Spectrochim Acta 1994, 50A, 1967. 23. Stuart, B. H. Spectrochim Acta 1997, 53A, 107. 24. Tanaka, N.; Ito, K.; Kitano, H.; Ise, N. Spectrochim
Acta 1992, 48A, 237.
25. Dollish, F. R.; Fateley, W. G.; Bentley, F. F. Char-acteristic Raman Frequencies of Organic Com-pounds; John Wiley & Sons: New York, 1974.
Table I Composition Change at Coagulation Front
Polymer Concentration in
Dope Solution (wt %) PSF NMP EtOH
10 0.090 0.258 0.653
20 0.174 0.218 0.609
30 0.235 0.179 0.587