Publisher’s version / Version de l'éditeur:
Vous avez des questions? Nous pouvons vous aider. Pour communiquer directement avec un auteur, consultez la première page de la revue dans laquelle son article a été publié afin de trouver ses coordonnées. Si vous n’arrivez pas à les repérer, communiquez avec nous à [email protected].
Questions? Contact the NRC Publications Archive team at
[email protected]. If you wish to email the authors directly, please see the first page of the publication for their contact information.
https://publications-cnrc.canada.ca/fra/droits
L’accès à ce site Web et l’utilisation de son contenu sont assujettis aux conditions présentées dans le site LISEZ CES CONDITIONS ATTENTIVEMENT AVANT D’UTILISER CE SITE WEB.
Proceedings of IASTED-AI-03 Conference, 2003
READ THESE TERMS AND CONDITIONS CAREFULLY BEFORE USING THIS WEBSITE. https://nrc-publications.canada.ca/eng/copyright
NRC Publications Archive Record / Notice des Archives des publications du CNRC :
https://nrc-publications.canada.ca/eng/view/object/?id=e4c8b611-9770-4f2f-a23d-0ba5b3e54bca https://publications-cnrc.canada.ca/fra/voir/objet/?id=e4c8b611-9770-4f2f-a23d-0ba5b3e54bca
NRC Publications Archive
Archives des publications du CNRC
This publication could be one of several versions: author’s original, accepted manuscript or the publisher’s version. / La version de cette publication peut être l’une des suivantes : la version prépublication de l’auteur, la version acceptée du manuscrit ou la version de l’éditeur.
Access and use of this website and the material on it are subject to the Terms and Conditions set forth at
Data Mining: Understanding Data and Disease Modeling
National Research Council Canada Institute for Information Technology Conseil national de recherches Canada Institut de technologie de l’information
Data Mining: Understanding Data and Disease
Modeling *
Famili, A., Ouyang, J.
February 2003
* published in Proceedings of IASTED-AI-03 Conference. Innsbruck, Austria. February 10-13, 2003. NRC 45789.
Copyright 2003 by
National Research Council of Canada
Permission is granted to quote short excerpts and to reproduce figures and tables from this report, provided that the source of such material is fully acknowledged.
Data mining: understanding data and disease modeling
A. Fazel Famili Junjun Ouyang Institute for Information Technology Institute for Information Technology
National Research Council Canada National Research Council Canada Bldg. M-50, Montreal Rd. Ottawa, Bldg. M-50, Montreal Rd. Ottawa,
Ont. K1A 0R6 Canada Ont. K1A 0R6 Canada
[email protected] [email protected]
ABSTRACT
Analyzing large data sets requires proper understanding of the data in advance. This would help domain experts to influence the data mining process and to properly evaluate the results of a data mining application. In this paper, we introduce an algorithm to identify anomalies in the data. We also propose an approach to include the results of data characteristics checking in a data mining application. The application, reported in this paper, involves developing a disease model from gene expression data using machine learning techniques. We demonstrate how: (i) simple models can be generated from a large set of attributes and (ii) the structure of the models change, when potentially anomalous cases are removed.
Keywords
Data mining, functional genomics, disease modeling, and bioinformatics.
1. INTRODUCTION
One of the key objectives of functional genomics is to take large data sets of biological data, micro-array or others, and elucidate functional interactions between elements in the entire pathway or network. With huge amounts of functional genomics data, this can be done through use of appropriate data mining techniques. Data mining is the process of discovering useful and ideally all previously unknown knowledge from historical or real-time data. Data mining in genomics may vary from the simple task of determining the relationships among a set of genes in a genomics data set to modeling certain tasks, such as disease classification, for the purpose of diagnosis or treatment. Regardless of the application, data mining involves several iterative steps. These are: (i) data pre-processing, that involves preparation, selection and more importantly understanding data characteristics, (ii) data analysis, which is essentially a search for useful patterns of any form in the data, and finally (iii) post-processing which could vary from the complex task of model fusion to combining discovered knowledge with patient information. One of the key points we would like to emphasize in this paper is the crucial importance of understanding data characteristics.
Modeling is the art of developing the best representation from a data set that reflects the structure and behaviour of the phenomena in the real world. Here, in our domain of functional genomics and disease modeling, our goal is to use human genomics data to build models for classification, prediction, diagnosis and future research. For example, a pathologist could use a model obtained from functional genomics data from a group of healthy and disease tissues to distinguish between the different forms or status of a disease for a group of undiagnosed patients. Modeling involves understanding the domain, access to all sources of information (e.g. all the data that influences the process), and a clear objective of why we need a model and where it would be used. More importantly, to develop a useful model from a data set, one has to properly understand the contents of the data to be able to perform all forms of data preprocessing and properly direct the data analysis process to discover meaningful patterns to build models. In this paper, after a short review of some related work, we explain the problem on which we have worked. We will then elaborate our method, show the results and discuss what we have learned from these studies.
2. Related work
Today, there are many papers related to data mining in different domains, including functional genomics. There are also numerous publications related to modeling using data mining techniques. However, there are only a limited number of papers related to data mining and functional genomics that also focus on disease modeling. Aris and Recce [1] investigated techniques to improve the classification of micro-array data through the analysis of present versus absent cells in a certain group of selectively expressed genes. Their study showed that the presence or absence of expression of a subset of the most selective genes (among many) is sufficient to correctly classify a sample in disease studies. Wu et al. [9] introduced a multi-step approach to gene function prediction to overcome with the limitations of clustering techniques. Their approach involved (i) identifying a large set of clusters, assigning annotations and confidence values to each cluster using biological knowledge, (ii) selecting the most relevant clusters using annotation confidence values, (iii) evaluating the annotated genes, clusters and their functional
predictions using visualization methods. The results were obviously quite subjective, as it may work differently for different data sets and the visualization results may be interpreted differently by different biologists.
Golub et al [5] developed a generic class discovery procedure to automatically distinguish between two classes of Leukemia from micro-array data. Their approach did not require any previous knowledge for classification. Their goal was to demonstrate the feasibility of cancer classification using gene expression monitoring and to develop a strategy for discovering and predicting future cases without using previous biological knowledge. And finally a review of some of the discrimination methods by Dudoit, Fridlyand and Speed [4] provide an overview of these techniques and their classification capabilities to analyze micro-array data.
There are other related work are about anomaly detection, some of which are included in the references [2,and 3].
3. Statement of the Problem and the Data
The problem discussed in this paper is how to properly model acute leukemia based on: acute lymphoblastic leukemia (ALL) and acute myeloid leukemia (AML). Correct diagnosis of these two diseases is critical for proper and successful medical treatments and patient monitoring. From a medical perspective, although these are both considered acute leukemia, different treatment procedures are advised for each. Furthermore, the chance of success for patients with myeloid is much higher than those with lymphoblastic. The effects of false positives (when a patient is really acute myeloid and is classified as lymphoblastic) and false negatives (when a patient is really lymphoblastic and is classified as acute myeloid) is sometimes drastic.In spite of several years of traditional progress in morphological and clinical studies, there are still many uncertainties in obtaining an accurate diagnosis. The process is also sometimes subjective and time consuming. Traditionally, several different clinical tests are required collectively to distinguish these two types of leukemia. Golub et al. [5], tried to develop an approach to cancer classification based on gene expression profiles of thousands genes from patients. Similar approaches have been taken by other researchers. For example, Scherf et al [7] used micro-array data to assess gene expression profiles in 6 human cancer cell lines.
The data used in this research comes from Golub et al. [5], who obtained the two micro-array data sets from the two types of leukemia patients (AML and ALL) mentioned above. One data set contained expression levels of 6817 human genes from bone marrow samples of 38 patients (consisting of 27 ALL and 11 AML), and is used for training a prediction model and for cross validation. The other was a similar collection of broader range (bone
marrow and peripheral blood) of 34 different patient samples (consisting of 20 ALL and 14 AML) to be used for independent validation on the predictor built from the training set. Figure 1 shows the contents of our data that consists of a matrix containing p genes for n patients and
an attribute vector containing n labels for all patients. The overall goal of our research reported here was (i) how to find, among all these genes, the most informative genes that are highly related to the classification of ALL and AML, and (ii) a model (set of rules) consisting of one or more genes that contain a particular threshold to be used for accurate discrimination of one class of patients from the others.
With a method of ‘neighborhood analysis”, Golub et al [5] selected the most informative genes based on their correlations with distinction between AML and ALL. A class predictor was then built on the most informative genes, and the corresponding weights of those genes. An incoming case would be assigned to one of the winning classes (ALL or AML), based on votes by the informative genes and their weights. The vote was accepted if “prediction strength” computed from voting results was over a predefined threshold. Cross-validation (38 training samples) and application to 34 independent samples showed that their model and the predictor built from it are quite effective for this leukemia classification.
4. Our Method
The prime objective of our research was first to identify all the hidden anomalous patterns in the data and then attempt to search for other useful information to build a model. We used our BioMiner data mining software system for this research. This software has been designed and built in house to provide support for biologists and bioinformaticians to perform data mining research in functional genomics. One of the key advantages of this software is that all forms of data pre-processing and data analysis functionalities are integrated into one
Genes Labels X11 X12 X13 X1p L1 X21 X22 X23 X2p L2 . . . . . X n*p= . . . . . . . . . , Xn1 Xn2 Xn3 Xnp Ln
Labels = Patient classes (i.e. ALL or AML) Figure 1: Structure of gene expression data
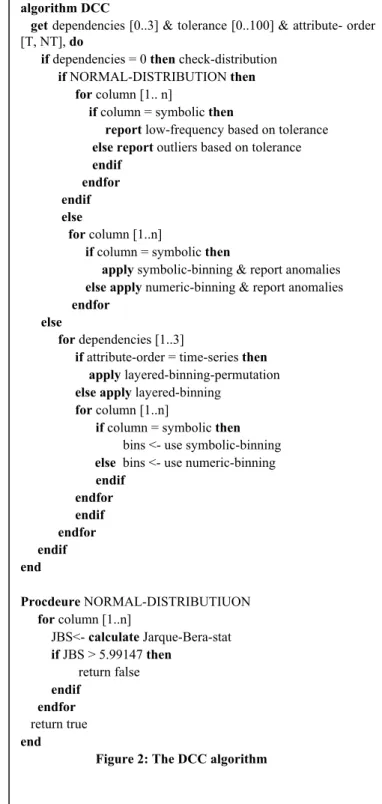
algorithm DCC
get dependencies [0..3] & tolerance [0..100] & attribute- order [T, NT], do
if dependencies = 0 then check-distribution if NORMAL-DISTRIBUTION then for column [1.. n]
if column = symbolic then
report low-frequency based on tolerance else report outliers based on tolerance endif
endfor endif else
for column [1..n]
if column = symbolic then
apply symbolic-binning & report anomalies else apply numeric-binning & report anomalies endfor
else
for dependencies [1..3]
if attribute-order = time-series then apply layered-binning-permutation else apply layered-binning
for column [1..n]
if column = symbolic then bins <- use symbolic-binning
else bins <- use numeric-binning endif endfor endif endfor endif end Procdeure NORMAL-DISTRIBUTIUON for column [1..n] JBS<- calculate Jarque-Bera-stat if JBS > 5.99147 then return false endif endfor return true end
Figure 2: The DCC algorithm
environment. The pre-processing and data analysis modules consist of a collection of algorithms and tools to support data mining research activities in an interactive and iterative manner.
The original data from Golub et al [5] was first transposed to represent rows as patients and columns as genes, and formatted as required by BioMiner. The independent data set was then used as new cases for validation.
First, the data preprocessing functionalities were applied to examine the data. This helped to obtain a general view of the data. It was also possible to identify abnormal or interesting characteristics, such as anomalies in the data. Figure 2 shows the algorithm for data characteristics checking. The algorithm takes as input the number of dependencies, tolerance and type of data, all specified by the user. It then identifies and reports anomalies based on its own method of identifying the characteristics of all attribute vectors.
The data characteristics checking algorithm identifies anomalies based on: (i) the number of dependencies selected (0-3), (ii) preferred tolerance, and (iii) the order of attributes (time-series or non-time-series). Other powerful tools used in the data pre-processing layer of BioMiner used for this research were data visualization facilities that allow viewing the data in two or three-dimensional spaces. 3-D virtual reality was also used in this study to validate the results of our data characteristics checking. This functionality maps high-dimensional objects (patients with thousands of genes) into a three-dimensional space. During the transformation, the information or underlying structure defined by the original attributes are maintained as much intact as possible. Therefore, characteristics of the data and relationships between objects described in the data could be studied spatially and intuitively.
With a clear understanding of the data, acquired knowledge from preprocessing, and knowing that the data was labeled, we then initiated our search for patterns through the Pattern Recognition module in BioMiner. This module provides support for various forms of pattern recognition (through supervised techniques) such as (i) association, in which one can identify meaningful relationships between cases/objects, (ii) discrimination, where one can distinguish objects of different classes, and (iii) prediction, in which one can develop models from historical data to predict future cases.
There are several algorithms for discrimination, prediction and association that are mainly from WEKA [8]. The algorithms are Decision Tree induction, Rule Learner, K-Nearest Neighbor Learner (KNN), Naïve Bayes Learner, and Majority Class. The last one is quite simple; it just assigns a new case to a class to which the majority of training set belongs. Decision trees and rule learners generate tree structures or rules directly for class
assignments. “A decision tree can be used to classify a case by starting at the root of the tree and moving through it until a leaf is encountered”[6]. Rules are in L->R formats, in which L represents attributes-based tests and R is a class [6]. Rules could be derived from decision trees. KNN is based on the distances of new cases from the classes in the training set. Naïve Bayes Learner is a probabilistic approach based on a Bayesian Network. All of these
options provide statistics of testing on the training set so that users can have clear pictures about how well their predictors (models) perform in cross-validation. For this study, the conventional and common one, decision tree is chosen for leukemia classification and prediction.
The decision tree results in something like a biological classification tree with the important attributes, here genes, as branching nodes. Therefore, several genes are involved in each tree. To see the relative importance of other genes, the first computed genes were filtered out from the training set. The data was then reloaded into the Pattern Recognition module to compute the next decision tree that as expected reported the next most informative genes as nodes. If repeated for enough times, a relative ranking of all genes could be generated correlated with their ability to distinguish between AML and ALL.
5. Results
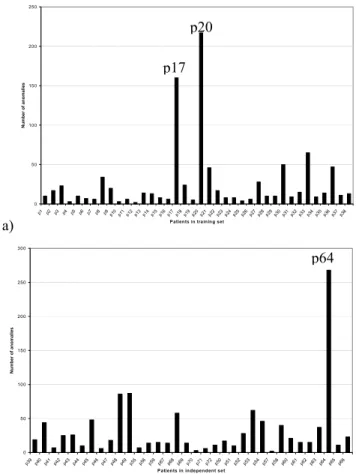
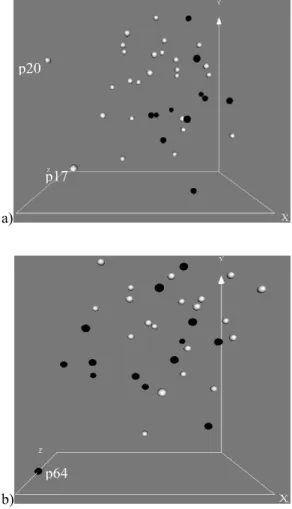
When the results from the data characteristics module were analyzed and displayed, two patients (p20 and p17) in the training data set and one (p64) in the independent data set were shown having many more anomalies compared to others (Figure 3 – a and b). We therefore decided to investigate this, as these results were quite important for our research. The anomalies were further validated through viewing the data in Virtual Reality (Figure 4 – a and b), which shows the deviation of these three patients from the main clouds of all other patients.
Note that in all of these figures patient numbers are not in any particular order and are simply reference numbers obtained from the original data set.
The questions at this point were: (i) Why are these patients so different from others? (ii) Do they have significant influence on building classification models? (iii) How do we build good models without loosing valuable information? In the following section, some of the answers to these questions and our method of investigation are explained.
Another observation is that no clear spatial separation between two types of acute leukemia patients, (ALL and AML) exists (Figure 4 – a and b). Even though there are many informative genes correlated with Leukemia class distinction, they may be overwhelmed by “noise” from all attributes that are relatively irrelevant to ALL and AML classification. The Virtual Reality facilities, as introduced above, preserve as much information as possible from all features. With all attributes preserved during transformation, this three dimensional representation reveals the difficulty in distinguishing the AML and ALL objects. a) 0 50 100 150 200 250 p1 p2 p3 p4 p5 p6 p7 p8 p9 p10p11p12p13p14p15p16p17p18p19p20p21p22p23p24p25p26p27p28p29p30p31p32p33p34p35p36p37p38 Patients in training set
N u mbe r of a noma li e s 0 50 100 150 200 250 300 p39 p40 p41 p42 p43 p44 p45 p46 p47 p48 p49 p55 p56 p59 p67 p68 p69 p70 p71 p72 p50 p51 p52 p53 p54 p57 p58 p60 p61 p62 p63 p64 p65 p66 Patients in independent set
N
u
mber of anomalies
b)
Figure 3: Anomaly detection of the training (a), and the independent (b) data sets. Along X-axis are patients in these two data sets; and Y-axis represents the number of anomalies detected through data characteristics checking. The three patients with significantly more anomalies are labeled (p20, p17 and p64). The numbers (20, 17, 64 and so on) are used by Golub et al. [5] to label and identify each patient.
Given all the above information about the contents of these data sets, a series of experiments were designed to investigate all possibilities for including and excluding the patients that showed anomalous patterns. The experiments, a summary of which is shown in Table 1, involved using one of the decision tree algorithms available in the BioMiner software. The results of each experiment consisted of one or more rules that contained four pieces of information: (i) one or more genes selected from among all the genes listed in the data sets, (ii) a threshold that applies to the intensity of this gene, (iii) the mathematical relationship, and (iv) a confidence factor. Below is an example of one of these rules for this classification task.
p20 p17
a)
b)
Figure 4: Virtual Reality representation of the training (a) and the independent (b) data sets. The three patients with many more anomalies are also labeled, i.e. p20, p17 and p64. Black balls represent AML and White balls correspond to ALL.
In this rule, X95735 is the Accession number of the gene Zyxin that is related to cell adhesion and was also identified as one of the most informative genes for leukemia classification by Golub et al. [5] and used in their
classifier. This rule states that if the expression level of this gene is over 938, the patient is AML, otherwise ALL. The accuracy obtained for this model through cross validation, was near 82%. It should be noted that this rule was generated with all 38 patients in the data set (without removing any patients with anomalies). When this rule was applied to the independent data set (i.e. new patients or cases not encountered before), it had over 91% of success. In total, we ran 12 experiments the results of which are summarized in Table 1 (below).
To answer some of the questions listed earlier, we can look at the results of the experiments given in Table 1, which shows:
(i) when patient 20 was removed from the data set, the structure of the model remained the same and yet its accuracy was improved through cross-validation (from 81.58% to 86.49%). This shows that patient 20 does not deviate the classification model much, if any at all, from the correct leukemia classification.
(ii) when patient 17 was removed from the data set the structure of the model changed – a new gene was identified with a new threshold. This was with a slightly higher accuracy than the first two experiments in this column. (iii) when both patients 20 and 17 were removed, the results were similar to the previous experiment in which only patient 17 had been removed (same model was generated). The above two experiments show that patient 17 may contain useful information for modeling ALL and AML.
(iv) next group of 4 experiments involved evaluating previous generated models using independent data (group of 34 patients). The accuracies are given in the column of New Cases. The model discovered in the first two experiments performed very well using independent data set with an accuracy of 91.18%. However, for the last two experiments in which patients 17 only or 20 and 17 together were removed, the accuracy was 79.41%.
Table 1: Results of all experiments. The first column lists data sets used, second column lists genes, third and fourth are threshold and prediction. All accuracies are given on the last three columns with original data set in column 5, independent on column 6 and independent (no p64) on last.
p64 p20
p17
If X95735 ≤ 938 then ALL; else AML
Experiments Genes Discovered
Threshold Prediction Cross
Validation
New Cases
New Cases (p64 removed)
All 38 patients X95735 938 <=:ALL;>: AML 81.58% 91.18% 90.91%
P20 removed X95735 938 <=:ALL;>: AML 86.49% 91.18% 90.91%
P17 removed M55150 1286 <=;ALL;>: AML 89.19% 79.41% 78.79%
(v) experiments related to removing the anomalous patient in the independent data set (p64) are listed in the last column of table 1 in which the results are similar to the previous group of experiments. The model generated from all patients and only patient 20 removed performed better than the other two experiments.
Looking at the results given in Table 1, the basic question still remains: Are these patients pathologically different from other leukemia patients in the original data set? One may also suggest that this is subject to further investigation or further lab experiments and analyses based on these observations.
The modeling approach proposed by Golub et al. [5] involved choosing 50 genes for building predictors because they were computed as highly correlated with the distinction between ALL and AML. The accuracy reported for their top 50 genes was 95% for cross validation and only 85% on new cases. The better performance of BioMiner’s predictor on new cases suggests that this simple rule actually comprehends more generally the concept of the distinction between ALL and AML.
We also followed a similar approach and identified our top 50 genes. This was done though an iterative process of building models and continuously removing identified genes until the top 50 genes were listed. This study is outside of the scope of this paper and therefore we do not report here.
6. Discussion
This paper presents an approach to disease modeling using data mining techniques and in particular use of anomaly detection and machine learning algorithms. The main objective of this study was to demonstrate that data mining requires proper understanding of the data. We demonstra-ted that understanding the data in advance would help in developing reliable models from gene expression data that could be used for classification and diagnosis. The basic idea was to obtain a clear picture of the data first before attempting to build a model. Our results showed that including or removing objects (e.g. patients in our case) that contain unusual number of anomalies may or may not affect the data mining process. Since the data comes from a medical application, the results justify the need for further investigation, as there may be significant pathological differences that were behind the entire process.
The data used in this study is related to developing a model to distinguish between two types of leukemia, ALL and AML. We demonstrated how simple models with relatively high accuracy could be created from data sets that contain a
small number of cases but consist of many attributes. In fact, our simple rules with one attribute, achieved an accuracy of 80% or more. Finally, we hope the approach proposed in this paper can be fully automated in our BioMiner data mining software where a large number of experiments could be designed, performed and results presented automatically.
Acknowledgements
The authors would like to acknowledge the contributions of all members of the BioMine project: Alan Barton, Julio Valdes, Ziying Liu, Youlian Pan from IIT, Roy Walker, Qing Yan Liu, Brandon Smith and Melanie Lehman from the Institute for Biological Sciences at NRC and a number of former students who worked in this project.
REFERENCES
[1] Aris V. and Recce M., A method to improve detection of disease using selectively expressed genes in micro-array data, in Methods of Micro-array Data Analysis, edited by Lin S. and Johnson K., (Kluwer Academic Publishers, Boston 2001).
[2] Buschkes R., Borning M. and Kesdogan D. Transaction-based anomaly detection, Proceedings of the workshop on Intrusion Detection and Network Monitoring, (1999) CA, USA.
[3] Desgupta D. and Majumdar N.S. Anomaly detection in multidimensional data using negative selection algorithm, IEEE World Congress on Evolutionary Computation, Hawaii, (2002) pp. 1039-1044.
[4] Dudiot S., Fridlyand J and Speed T. Comparison of discrimination methods for the classification of tumors using gene expression data, Tech. (2000) Report #576, Department of Statistics, UC Berkeley, CA.
[5] Golub, T.R., etal. Molecular classification of cancer: class discovery and class prediction by gene expression monitoring. Science, (286) (1999), 531-537.
[6] Quinlan, J. R. C4.5: programs for machine learning. (Morgan Kaufmann, San Mateo, CA, 1993).
[7] Schref U. etal, A gene expression database for the molecular pharmacology of cancer, Nature Genetics, (2000) 24(3): 236-244.
[8] Witten I. and Eibe F. Data Mining: Practical Machine Learning Tools and Techniques with Java Implementations, (Morgan Kaufmann. San Mateo, CA, 1999).
[9] Wu L.F. etal, Large-scale prediction of saccharomyces cerevisiae gene function using overlapping transcriptional clusters, Nature Genetics, V.31, (2002) pp.255-265.