HAL Id: hal-00330306
https://hal.archives-ouvertes.fr/hal-00330306
Submitted on 17 Feb 2005
HAL is a multi-disciplinary open access
archive for the deposit and dissemination of
sci-entific research documents, whether they are
pub-lished or not. The documents may come from
teaching and research institutions in France or
abroad, or from public or private research centers.
L’archive ouverte pluridisciplinaire HAL, est
destinée au dépôt et à la diffusion de documents
scientifiques de niveau recherche, publiés ou non,
émanant des établissements d’enseignement et de
recherche français ou étrangers, des laboratoires
publics ou privés.
The carbon budget of terrestrial ecosystems at
country-scale – a European case study
I. A. Janssens, A. Freibauer, B. Schlamadinger, R. Ceulemans, P. Ciais, A. J.
Dolman, M. Heimann, G.-J. Nabuurs, P. Smith, R. Valentini, et al.
To cite this version:
I. A. Janssens, A. Freibauer, B. Schlamadinger, R. Ceulemans, P. Ciais, et al.. The carbon budget of
terrestrial ecosystems at country-scale – a European case study. Biogeosciences, European Geosciences
Union, 2005, 2 (1), pp.15-26. �10.5194/bg-2-15-2005�. �hal-00330306�
Biogeosciences, 2, 15–26, 2005 www.biogeosciences.net/bg/2/15/ SRef-ID: 1726-4189/bg/2005-2-15 European Geosciences Union
Biogeosciences
The carbon budget of terrestrial ecosystems at country-scale – a
European case study
I. A. Janssens1, A. Freibauer2, B. Schlamadinger3, R. Ceulemans1, P. Ciais4, A. J. Dolman5, M. Heimann2, G.-J. Nabuurs6, 7, P. Smith8, R. Valentini9, and E.-D. Schulze2
1Department of Biology, Universiteit Antwerpen, Belgium
2Max-Planck-Institute for Biogeochemistry, Jena, Germany
3Joanneum Research, Graz, Austria
4Laboratoire des Sciences du Climat et de l’Environnement, Gif sur Yvette, France
5Department of Geo-Environmental Sciences, Free University Amsterdam, The Netherlands
6Alterra, Wageningen, The Netherlands
7European Forest Institute, Joensuu, Finland
8School of Biological Sciences, University of Aberdeen, UK
9Department of Forest Science and Environment, University of Tuscia, Italy
Received: 21 June 2004 – Published in Biogeosciences Discussions: 22 July 2004 Revised: 3 January 2005 – Accepted: 16 February 2005 – Published: 17 February 2005
Abstract. We summed estimates of the carbon balance of forests, grasslands, arable lands and peatlands to obtain country-specific estimates of the terrestrial carbon balance during the 1990s. Forests and grasslands were a net sink for carbon, whereas croplands were carbon sources in all Euro-pean countries. Hence, countries dominated by arable lands tended to be losing carbon from their terrestrial ecosystems, whereas forest-dominated countries tended to be sequester-ing carbon. In some countries, drainsequester-ing and extraction of peatlands caused substantial reductions in the net carbon bal-ance.
Net terrestrial carbon balances were typically an order of magnitude smaller than the fossil fuel-related carbon emis-sions. Exceptions to this overall picture were countries where population density and industrialization are small. It is, how-ever, of utmost importance to acknowledge that the typically small net carbon balance represents the small difference be-tween two large but opposing fluxes: uptake by forests and grasslands and losses from arable lands and peatlands. This suggests that relatively small changes in either or both of these large component fluxes could induce large effects on the net total, indicating that mitigation schemes should not be discarded a priori.
In the absence of carbon-oriented land management, the current net carbon uptake is bound to decline soon. Protect-ing it will require actions at three levels; a) maintainProtect-ing the
Correspondence to: I. A. Janssens
(ivan.janssens@ua.ac.be)
current sink activity of forests, b) altered agricultural man-agement practices to reduce the emissions from arable soils or turn into carbon sinks and c) protecting current large reser-voirs (wetlands and old forests), since carbon is lost more rapidly than sequestered.
1 Introduction
The accumulation of CO2 in the atmosphere proceeds at a
much slower rate than expected from the burning of fossil fu-els and from deforestation on land (IPCC, 2001). Part of the reason for this is the current net uptake of carbon (C) by the terrestrial biosphere, which originates from the combination of increased photosynthesis and vegetation rebound in the northern hemisphere (IPCC, 2001; Nabuurs, 2004; Ciais et al., 1995). Thus, there is evidence for a large (1–2 Pg C yr−1)
terrestrial C sink. The mechanisms by which this occurs have been identified but their relative importance still remains un-clear. Research teams in Europe and the US have applied a dual constraint approach – a combination of atmospheric-based techniques and land-atmospheric-based methods – to assess the continental-scale terrestrial C budgets of Europe and con-tiguous America. For concon-tiguous America, the terrestrial C
sink during the 1980’s was estimated at 0.3–0.6 Pg C yr−1
(Pacala et al., 2001), while for Europe the terrestrial C sink
during the 1990’s is believed to amount to 0.1–0.2 Pg C yr−1
16 I. A. Janssens et al.: European terrestrial carbon balance at national scale
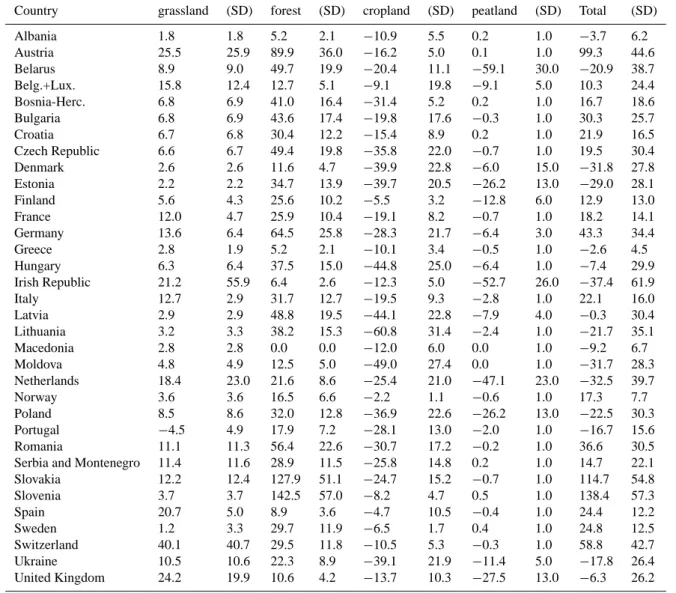
Table 1. Country-specific carbon balances and their uncertainties (both in g C m−2total land area yr−1)of grasslands, forests, croplands and peatlands for individual European countries. Positive is carbon gain, negative carbon loss.
Country grassland (SD) forest (SD) cropland (SD) peatland (SD) Total (SD) Albania 1.8 1.8 5.2 2.1 −10.9 5.5 0.2 1.0 −3.7 6.2 Austria 25.5 25.9 89.9 36.0 −16.2 5.0 0.1 1.0 99.3 44.6 Belarus 8.9 9.0 49.7 19.9 −20.4 11.1 −59.1 30.0 −20.9 38.7 Belg.+Lux. 15.8 12.4 12.7 5.1 −9.1 19.8 −9.1 5.0 10.3 24.4 Bosnia-Herc. 6.8 6.9 41.0 16.4 −31.4 5.2 0.2 1.0 16.7 18.6 Bulgaria 6.8 6.9 43.6 17.4 −19.8 17.6 −0.3 1.0 30.3 25.7 Croatia 6.7 6.8 30.4 12.2 −15.4 8.9 0.2 1.0 21.9 16.5 Czech Republic 6.6 6.7 49.4 19.8 −35.8 22.0 −0.7 1.0 19.5 30.4 Denmark 2.6 2.6 11.6 4.7 −39.9 22.8 −6.0 15.0 −31.8 27.8 Estonia 2.2 2.2 34.7 13.9 −39.7 20.5 −26.2 13.0 −29.0 28.1 Finland 5.6 4.3 25.6 10.2 −5.5 3.2 −12.8 6.0 12.9 13.0 France 12.0 4.7 25.9 10.4 −19.1 8.2 −0.7 1.0 18.2 14.1 Germany 13.6 6.4 64.5 25.8 −28.3 21.7 −6.4 3.0 43.3 34.4 Greece 2.8 1.9 5.2 2.1 −10.1 3.4 −0.5 1.0 −2.6 4.5 Hungary 6.3 6.4 37.5 15.0 −44.8 25.0 −6.4 1.0 −7.4 29.9 Irish Republic 21.2 55.9 6.4 2.6 −12.3 5.0 −52.7 26.0 −37.4 61.9 Italy 12.7 2.9 31.7 12.7 −19.5 9.3 −2.8 1.0 22.1 16.0 Latvia 2.9 2.9 48.8 19.5 −44.1 22.8 −7.9 4.0 −0.3 30.4 Lithuania 3.2 3.3 38.2 15.3 −60.8 31.4 −2.4 1.0 −21.7 35.1 Macedonia 2.8 2.8 0.0 0.0 −12.0 6.0 0.0 1.0 −9.2 6.7 Moldova 4.8 4.9 12.5 5.0 −49.0 27.4 0.0 1.0 −31.7 28.3 Netherlands 18.4 23.0 21.6 8.6 −25.4 21.0 −47.1 23.0 −32.5 39.7 Norway 3.6 3.6 16.5 6.6 −2.2 1.1 −0.6 1.0 17.3 7.7 Poland 8.5 8.6 32.0 12.8 −36.9 22.6 −26.2 13.0 −22.5 30.3 Portugal −4.5 4.9 17.9 7.2 −28.1 13.0 −2.0 1.0 −16.7 15.6 Romania 11.1 11.3 56.4 22.6 −30.7 17.2 −0.2 1.0 36.6 30.5 Serbia and Montenegro 11.4 11.6 28.9 11.5 −25.8 14.8 0.2 1.0 14.7 22.1 Slovakia 12.2 12.4 127.9 51.1 −24.7 15.2 −0.7 1.0 114.7 54.8 Slovenia 3.7 3.7 142.5 57.0 −8.2 4.7 0.5 1.0 138.4 57.3 Spain 20.7 5.0 8.9 3.6 −4.7 10.5 −0.4 1.0 24.4 12.2 Sweden 1.2 3.3 29.7 11.9 −6.5 1.7 0.4 1.0 24.8 12.5 Switzerland 40.1 40.7 29.5 11.8 −10.5 5.3 −0.3 1.0 58.8 42.7 Ukraine 10.5 10.6 22.3 8.9 −39.1 21.9 −11.4 5.0 −17.8 26.4 United Kingdom 24.2 19.9 10.6 4.2 −13.7 10.3 −27.5 13.0 −6.3 26.2
such as the Global Terrestrial Carbon Observation network (http://www.fao.org/GTOS/tcoABT.html) aim to improve the spatial resolution to the sub-continental scale and further re-duce the substantial uncertainty of these estimates. While the spatial resolution of the atmospheric approach is currently constrained by the limited number of atmospheric monitor-ing stations, the land-based methods have a much larger spa-tial resolution and also provide information about the contri-butions of different ecosystem-types. Because terrestrial C sequestration substantially mitigates global warming, at least in the short term, estimates of the terrestrial C balance for in-dividual European countries, and understanding which veg-etation types and which driving factors are determinant for the national balance, has become an important issue for pol-icy makers. Because alternatives for the post-2012 period
are already being discussed, policy makers are eager to know what implications certain regimes may have for their specific country.
Hence, the objective of this study is to apply a land-based approach to explore the full terrestrial C balance of individ-ual European countries with a view to determining which ecosystems dominate the terrestrial C balance within the in-dividual European countries. Thus, we aim to identify where gains can be made in enhancing the terrestrial C uptake from, or reducing the net C losses to, the atmosphere.
2 Materials and methods
We estimated the country-specific C balances for all Eu-ropean countries except Russia and the Islands in the
I. A. Janssens et al.: European terrestrial carbon balance at national scale 17 Mediterranean Sea and in the Atlantic Ocean (except for the
UK and Ireland; Table 1). Carbon balances were estimated by adding up changes in the C reservoirs in forests, grass-lands, arable soils and peatlands. As will be discussed in more detail below, we accounted for changes in soil C stocks in all four vegetation types, whereas changes in biomass C stocks were only accounted for in forests and wood (agri-cultural product pools were assumed to be constant). Other ecosystems, such as urban areas and parks, or inland wa-ter bodies were not included because of lack of information. Nonetheless, the four ecosystem types included in this study covered about 85% of the surface area, which underscores the representative character of our study.
2.1 Forest stock changes
We used the forest productivity estimates reported in TBFRA (2000) and combined these with modeled changes in soil C content (Liski et al., 2002) to obtain forest net biome productivity. In brief, the forest productivity estimate is based on repeated forest inventory data from over 420 000 study plots throughout Europe (Ney et al., 2002). Forest in-ventories contain data on stem volume increment that are subsequently converted to biomass C using expansion fac-tors and mean C densities (Ney et al., 2002; Schelhaas and Nabuurs, 2001). Estimates of soil C inputs are obtained by applying turnover estimates to each of the biomass compart-ments (bole, branches, foliage, fine roots and coarse roots), and accounting for slash inputs following thinning or harvest (Nabuurs et al., 2003; Liski et al., 2002). Carbon losses from soils are estimated by dynamic decomposition models with different decay rates for different litter pools (non-woody, branches and logs) and different humification/mineralization ratios (how much is lost to the atmosphere and how much is stored as soil organic matter; SOM). These models also in-clude slow- and rapidly-cycling SOM pools, with turnover rates that depend on climate variables (Liski et al., 2002; Nabuurs et al., 2003).
Given the large sample size (Ney et al., 2002), inventory-based methods give balanced weight to most areas and veg-etation types in terms of stem growth. Another advantage of inventory-based methods is that they implicitly account for disturbances. The main disadvantage is that these models are only based on measurements of stem volume increment. All other C stock changes (total biomass- and wood prod-ucts stock change, litter and dead wood stock changes, and changes in soil C stocks) are simulated through the use of a combination of dynamic book-keeping models and process-based models as described briefly above.
Estimates of C stock changes in the wood product pools were not included because we did not have access to esti-mates for each of the countries, and also because these C sinks are small in comparison to the stock changes within the forests (Harmon et al., 1992).
2.2 Agricultural stock changes
Agricultural (arable soils and grasslands) C fluxes were lim-ited to soil C stock changes, under the assumption that all harvested products (a potential long-term C sink from the at-mosphere) were consumed within the same year (i.e. all C is returned to the atmosphere and therefore there is no net sink) and that there were no changes in standing biomass. This latter assumption is based on the fact that arable fields are frequently harvested (and so the standing biomass cannot be a C sink), and also that standing biomass in grasslands is con-stant from year to year. Even if this last assumption is false, the grassland soil C pool is one to two orders of magnitude larger than the biomass pool. Hence, ignoring small changes in grassland biomass is not going to create a substantial er-ror in the total grassland C sink estimate. Excluding crop and grass biomass is consistent with the fact that agricultural products are not included in inventories under the Kyoto Pro-tocol.
For countries within the European Union (EU-15), C stock changes were calculated by multiplying country-specific C sequestration rates estimated by the CESAR model (Vleeshouwers and Verhagen, 2002) with the mean sur-face area reported by Mucher (2000) and http://www.fao.org/ waicent/portal/statistics en.asp. In brief, CESAR calculates changes in soil C by separately quantifying C inputs and C losses. Carbon inputs are derived from crop residues remain-ing in the field after harvest (in meadows also the excretion of faeces is accounted for). Thus, crop yields obtained from FAO statistical databases for different countries and 7 differ-ent crops are first converted into crop residue production us-ing ratios derived from literature values. The residue inputs are then converted to C inputs using a humification coeffi-cient of the crop residues. Climate and management factors are thus included in the reported yield, and the uncertain-ties in the inputs originate from the assumed ratios described above. Carbon losses are estimated by multiplying C stocks with specific decomposition rates. Carbon pools were taken from IGBP-DIS (2000). Specific decomposition rates were taken from decomposition measurements in the Netherlands, Denmark and the UK, which were scaled in space and time using a temperature- and soil moisture response function. Vleeshouwers and Verhagen (2002) acknowledge a consid-erable uncertainty in agricultural C stock changes due to un-certainty in initial soil C stocks. We used the reference sce-narios for our national estimates. However, they exclude the effects of manure application and therefore represent a mini-mum scenario of organic C input to soil. Consequently, soil C losses tend to be overestimated. Indeed, the CESAR model tended to overestimate the soil C losses in comparison with four other national scale estimates (cf. below). To account for this, we did not use the mean output of the model for arable soils. Instead we used the value halfway between the mean and the highest estimate (i.e. lowest losses). After this ad-justment, the model output agreed much better with national
18 I. A. Janssens et al.: European terrestrial carbon balance at national scale
Table 2. Predicted versus reported soil carbon losses from arable soils for four European countries for which carbon losses have been
reported.
Country Reported flux Model prediction Reported flux Model prediction Reference (Tg C yr−1) (Tg C yr−1) g C m−2yr−1 g C m−2yr−1
Finland 0.55 1.86 Finnish Ministry of Environment (2001)
UK 3.3 3.4 Milne et al. (2001)
Austria 24 73 Dersch and Boehm (1997) Belgium 76 61 Sleutel et al. (2003)
estimates (Table 2). For grassland soils we used the mean output.
To estimate C balances in non-EU-15 countries, the following assumptions were made: sequestration rates in Macedonia and Albania equal those in Greece; Switzerland equals Austria; Norway equals Sweden; Baltic states equals Finland; Denmark equals The Netherlands; all former-Yugoslavian countries equals mean of Italy and Greece; Czech Republic, Slovakia and Poland equals Germany; all other eastern European countries equals mean of EU-15.
2.3 Peatland stock changes
National estimates of the C budget of the peat sector were ob-tained by summing up C stock changes in undisturbed peat-lands, in drained peatpeat-lands, and in peatlands where peat is being extracted, including peat use.
Carbon sequestration in undisturbed peatlands was esti-mated by multiplying remaining areas of undisturbed peat-lands (Armentano and Menges, 1986; Botch et al., 1995; Lappalainen, 1996) with biome-specific C sequestration rates
(between 20–50 g C m−2 yr−1; Armentano and Menges,
1986; Armentano and Verhoeven, 1990; Botch et al., 1995). Estimates of areas drained to create cropland, pastures and forest were derived from Armentano and Verhoeven (1990) and Lappalainen (1996). Combined with biome-specific C
losses following drainage (56–281 g C m−2 yr−1 for forest
and pasture, 205–1125 g C m−2 yr−1for cropland;
Armen-tano and Verhoeven (1990), this gives an estimate of total C losses from drained peatlands.
Carbon losses related to the use of peat in horticul-ture/agriculture, and as fuel were estimated by correcting ex-traction data from Lappalainen (1996) for bulk density, car-bon content and water content. For those countries where peat extraction was reported in volumetric units, a bulk
den-sity of 0.14 g cm−3was assumed (Botch et al., 1995). Where
extraction was reported in tons, we assumed a water content of 40% and a C content of 0.57% (Botch et al., 1995).
3 Results and discussion
3.1 Forests
Forests are C sinks in almost all European countries (Ta-ble 1). The main reason for this is that annual production rates are larger than annual wood harvests (TBFRA, 2000). Forest productivity is very high in Europe because of
increas-ing atmospheric CO2, high nitrogen deposition and global
warming (longer growing season), but mainly because Euro-pean forests are relatively young and still in an exponential growth phase (TBFRA, 2000; Nabuurs et al., 2003).
On average, European forests annually sequester
124 g C m−2forest area from the atmosphere (coefficient of
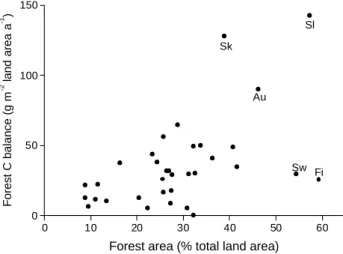
variance, C.V., among different countries=0.62), of which about 70% is in biomass and 30% is in litter and soil (Liski et al., 2000, 2002; Nabuurs et al., 2001). Obviously, countries with high forest cover tend to have a higher forest C sink per unit total land area than countries with low forest cover, as is indicated by the weak but statistically significant positive relationship between the forest C uptake per unit country area and the proportion of the total country area under forest (Fig. 1). It is, however, noteworthy that there is a much smaller C stock change (when normalized per unit land area) in Finland and Sweden than in central-European countries such as Slovakia, Slovenia and Austria (Fig. 1). Therefore, in addition to the obvious effect of differences in relative forest cover, there must be a number of other factors that explain differences in the forest C balance among countries. First, most European forests are production forests. Hence, the forest C balance is primarily determined by the harvest ratio, i.e. the proportion of the annual wood increment that is harvested. Thus, the substantial differences in the harvest ratio among countries (TBFRA, 2000) contribute to the low R2in Fig. 1.
Second, inventory-based models rely heavily on so-called biomass expansion factors (BEF). These BEF’s are used to convert stem volume to entire-tree biomass, and vary with species, climate and tree age (Weiss and Schlamadinger, 2000; Schelhaas and Nabuurs, 2001; Lehtonen et al., 2004; Wirth et al., 2004). Therefore, BEF’s are expected to vary among countries and contribute to the poor relationship
I. A. Janssens et al.: European terrestrial carbon balance at national scale 19
Janssens et al. European terrestrial C balance at national scale
1 0 10 20 30 40 50 60 0 50 100 150 Sk Au Sw Sl Fi Forest C balance (g m -2 land area a -1 )
Forest area (% total land area)
Fig. 1. Country-specific carbon balance of forest ecosystems
ex-pressed per unit total land area (i.e. carbon balance in forest area only per unit surface of entire country) versus the percentage of land covered by forest (allows comparisons among countries of different sizes; positive values indicates net carbon uptake; Sk denotes Slo-vakia, Sl denotes Slovenia, Au denotes Austria, Sw denotes Swe-den, Fi denotes Finland). Regression (not shown): y=1.25x; n=34; p<0.001, R2=0.29.
in Fig. 1. However, forest inventory studies such as
TBFRA (2000) use BEF estimates supplied by the individual countries, and these reported BEF’s vary much more than can be explained by natural factors. Thus, part of the observed variation in forest C balance among countries is related to the use of strongly differing BEF’s.
Third, regional differences in tree growth may also
con-tribute to the differences in forest C balance. Figure 2
shows the forest productivity in the European countries, and it is clear that in northern and southern countries trees grow slower than in temperate central European countries. There are multiple reasons why tree growth differs region-ally. Northern forests grow more slowly because the grow-ing season is short and because nutrient cyclgrow-ing is retarded. Southern forests may produce less because drought often oc-curs during the period with optimal light conditions, when potential photosynthesis rates are highest. In addition, the temperate countries with faster tree growth tend to have higher nitrogen deposition loads (http://europa.eu.int/comm/ environment/water/water-nitrates/report407parta.pdf). Fur-ther, regional variation in tree growth may also be related to different management practices.
3.2 Arable soils
Croplands and grasslands represent important ecosystems in Europe, but there are only few large-scale inventory data that can be used to estimate changes in C stocks and thus vali-date the output of the CESAR model. Because the CESAR model overestimated the national-scale estimates for those
Janssens et al. European terrestrial C balance at national scale
30 Fig. 2
Fig. 2. Country-specific mean forest productivity estimates
ex-pressed per unit forest area (t C ha−1yr−1).
countries where validation data were available, we did not use the mean output of the model. Instead we used the value halfway between the mean and highest estimate (i.e. lowest losses). After this adjustment, the model output agreed much better with the national estimates (Table 2).
Arable soils are predicted to be losing C in all European
countries (Table 1). The modelled European-wide mean
change in soil C was a loss of 70 g C m−2yr−1(C.V. among
countries=0.43). There was a close negative relationship be-tween the C stock change per unit country area and the pro-portion of the total land area under arable land (Fig. 3).
To our knowledge, only two large-scale (national) and long-term inventories of organic matter in agricultural soils have been published. In the study by Sleutel et al. (2003), a repeated soil sampling of Belgian cropland soils (210 000 samples taken between 1989 and 1999) indicated a mean
an-nual soil C loss of 76 g C m−2 yr−1. This estimate was
slightly higher than the predicted loss of 61 g C m−2 yr−1
from Belgian cropland soils (Fig. 3 and Tables 1 and 2), but related to a change in cropland management – an effect unaccounted for by the CESAR model. For Austrian crop-land soils, however, the mean C loss predicted by the model
was 73 g C m−2 yr−1, which was much larger than the C
losses measured in a repeated, large-scale inventory study
(24 g C m−2 yr−1; Dersch and Boehm, 1997). Two other
countries reported estimates of agricultural soil C changes (Table 2). For the UK, the output of the CESAR model was very close to the reported value (Milne et al., 2001), but C losses in the UK were driven by land use change from grassland to cropland – again unaccounted for by the model. For Finland the model estimate was much higher than the value reported to the UNFCCC (Finnish Ministry of the En-vironment, 2001). The CESAR model clearly overestimated soil C losses in countries without significant changes in land use or management. However, European agricultural statis-tics contain only indirect information on net changes in the application of manure and crop residues, but not on their
20 I. A. Janssens et al.: European terrestrial carbon balance at national scale
Janssens et al. European terrestrial C balance at national scale
1 0 10 20 30 40 50 60 70 80 -90 -80 -70 -60 -50 -40 -30 -20 -10 0 Au BLx Fi UK Cropland C balance (g C m -2 land area a -1 )
Cropland area (% of total land area)
Fig. 3. Country-specific carbon balance of arable soils expressed
per unit total land area (i.e. the carbon balance in cropland area only per unit surface of entire country) versus the percentage of land covered by crops (allows comparisons among countries differing in size; positive values indicate net carbon gain). For four countries where validation was possible the independent estimates are also given, are modeled estimates, are independent published esti-mates (see also Table 1; Fi denotes Finland, Au denotes Austria, UK denotes United Kingdom, BLx denotes Belgium plus Luxembourg). Regression (not shown): y=−0.68x; n=34; p<0.0001; R2=0.66.
geographically explicit distribution. The latter would be re-quired to quantify gross changes, which determine the mag-nitude of the C stock changes.
These differences between predicted and observed soil C changes at the national level not only highlight the uncer-tainty in the predicted soil C losses, and thus the need for a model specifically developed to predict the current changes in arable soil C, but also indicate the need for more repeated soil C inventories to help better constrain the modelled soil C losses. Such repeated inventories would also be useful for databases of regional C balance estimates based on soil prop-erties, agricultural management practices, and land-use his-tory.
Despite the difference in size, both model estimate and ob-servations suggest a net loss of C from arable soils (Table 2). The model further indicates that arable soils are losing C con-sistently throughout Europe (Fig. 3). This net loss occurs be-cause, in arable soils, harvest reduces C returns to the soil, while C losses may be enhanced due to agricultural practices such as tillage. Thus, land conversion from other land-uses to cropland is likely to lead to an overall decline in soil C. Because these losses can continue for a number of years, the current loss of C from cropland soils may be the legacy of conversion of land to cropland during the past 20–30 years, as is the case in the UK (Milne et al., 2001). However, in most European countries the major net land use changes oc-curred much longer than 20–30 years ago and recent trends are more towards conversion of arable land to other land uses.
Janssens et al. European terrestrial C balance at national scale
1 0 20 40 60 -10 0 10 20 30 40 Por Es Au Swi Nl UK Ir Grassland C balance (g C m -2 land area a -1 )
Grassland area (% total land area)
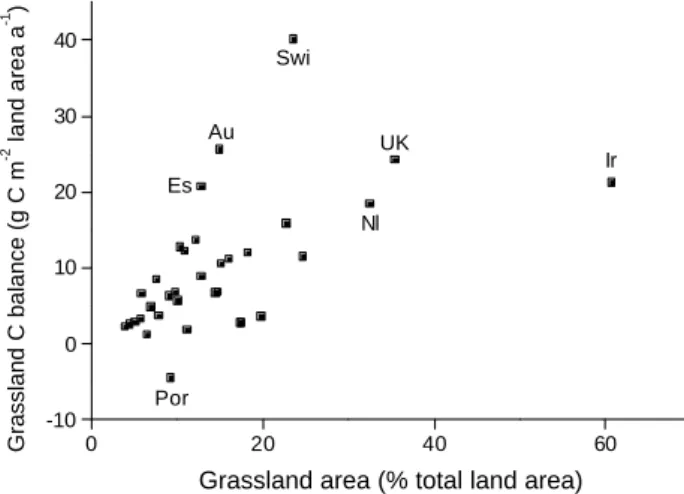
Fig. 4. Country-specific carbon balance of grassland ecosystems
expressed per unit total land area (i.e. the carbon balance in grass-land area only per unit surface of entire country) versus the per-centage of land covered by grass (allows comparisons among coun-tries differing in size; positive values indicate net carbon gain; Por denotes Portugal, Es denotes Spain, Au denotes Austria, Swi de-notes Switzerland, Nl dede-notes The Netherlands, UK dede-notes The United Kingdom, Ir denotes Ireland). Regression (not shown):
y=2.9+0.46x; n=34; p<0.001, R2=0.32.
Despite this, arable soils are losing C even in those countries with no new cropland (see Belgian example above, Sleutel et al., 2003). These measured soil C losses can therefore not be related to land use change, but are probably due to changes in management practice, such as decreased application of or-ganic manure to cropland (Sleutel et al., 2003). Another pos-sible hypothesis that could explain why arable soils can lose C without net land use changes is rotation. If the conversion from cropland to grassland is equal to the conversion from grassland to cropland, national statistics will indicate no net land use change while in reality the gross changes exist. Un-der such conditions, arable soils can continue to lose C, and grasslands to gain C. Because national statistics only report net land use changes, this hypothesis could not be tested.
3.3 Grassland soils
In contrast to arable soils, grassland soils are predicted to be a net C sink in most European countries (Fig. 4). The
over-all C sink averages 60 g m−2yr−1and is thus almost twice
as high as the forest soil sink (30% of 124 g C m−2 yr−1,
i.e. 37 g C m−2yr−1). However, in many countries the
un-certainty surrounding this estimate is larger than the sink it-self (Table 1; Vleeshouwers and Verhagen, 2002). As for forests, the relationship between the grassland C uptake per unit country area and the proportion of the total country area under grassland (Fig. 4) is weak but significant. The pre-dicted grassland soil C balance ranges from a net loss of 50 g m−2grassland yr−1to a net sink of 170 g m−2grassland
I. A. Janssens et al.: European terrestrial carbon balance at national scale 21
yr−1(C.V. among countries=0.69). Thus, as with forests,
dif-ferences in the grassland C balance among countries depend not only on the relative grassland area within each country, but also on regional differences in productivity and decom-position. Hence, most of the above-mentioned factors that explain the regional differences in forest productivity also explain the regional differences in grassland productivity.
3.4 Importance of land use
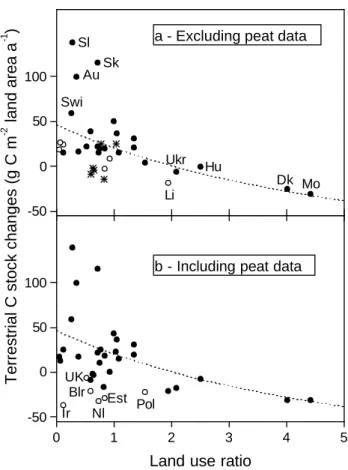
While forests and grasslands are predominantly C sinks, arable soils are C sources. Therefore, we expected coun-tries with large forest and/or grassland areas to be major C sinks, and those dominated by arable land to be C sources. Such an overriding effect of land use on terrestrial C stock changes is indeed apparent in our data set (for example, the cropland-dominated countries Denmark and Moldavia are the largest C sources; Fig. 5, upper panel). To describe the relative importance of arable land versus forest or grassland, we coined the term “land-use ratio” as the ratio of the crop-land area in a country over the sum of the forest and grass-land areas (Fig. 5). It is clear that as a country becomes cropland-dominated (high land-use ratio), it is bound to lose C, whereas most countries with low land-use ratio are ab-sorbing C. However, Scandinavian and Baltic states are be-low the mean trendline, as are most of the Mediterranean countries (Fig. 5a). In contrast, the central European coun-tries dominated by forest and/or grassland sequester much more than expected from their land use ratio. Thus, in addi-tion to land use, geographic features also contribute to re-gional differences in terrestrial C stock changes. We did not test which mechanisms are responsible for these geo-graphic differences, but most likely drought limits uptake in the Mediterranean countries, while in the northern countries light and temperature may be the rate-limiting factors.
3.5 Peatlands
Most undisturbed organic soil wetlands accumulate C at rates
ranging between 0 and 80 g C m−2yr−1, depending on age,
climate and the type of wetland ecosystem, such as mires, fens, marshes, . . . (Armentano and Menges, 1986; Botch et al., 1995). Because of the relatively small area (Lappalainen, 1996) and (predominantly) slow accretion rates, undisturbed European peatlands constitute only a negligible C sink (0–
6 g m−2 total land area yr−1 compared to 60 in grasslands
and 120 in forests).
However, large peat areas are still being drained for pas-ture, cropland, and forestry purposes (Lappalainen, 1996; Armentano and Verhoeven, 1990). Drainage of organic soils enhances their aeration and the subsequent enhancement of decomposition results in significant soil C losses (Armen-tano and Verhoeven, 1990). Our estimate of the C loss from Europe’s drained peatlands indicates that, despite a much smaller area, more C is lost due to drainage than is
se-Janssens et al. European terrestrial C balance at national scale
1 0 1 2 3 4 5 -50 0 50 100 UK Dk Mo
b - Including peat data
Swi Blr Est Nl Hu Ukr Li Pol AuSk Ir Sl
Terrestrial C stock changes (g C m
-2
land area a
-1
)
Land use ratio
-50 0 50 100
a - Excluding peat data
Fig. 5. (a) Country-specific carbon stock changes in terrestrial
ecosystems (sum of forests, grassland and arable soils) expressed per unit total land area versus the land use ratio (i.e. cropland area divided by sum of forest and grassland areas; * indicates Mediter-ranean countries, indicates Baltic and Scandinavian countries; Sl denotes Slovenia, Sk denotes Slovakia, Au denotes Austria, Swi denotes Switzerland, Ukr denotes Ukraine, Li denotes Lithuania, Hu denotes Hungary, Dk denotes Denmark, Mo denotes Moldova).
(b) Country-specific carbon stock changes in terrestrial ecosystems
(sum of forests, grassland, arable soils and peatlands) expressed per unit total land area versus the land use ratio (i.e. cropland area di-vided by sum of forest and grassland areas; indicates countries with substantial carbon losses from peatlands; Uk denotes United Kingdom, Blr denotes Belarus, Ir denotes Ireland, Nl denotes The Netherlands, Est denotes Estonia, Pol denotes Poland).
questered in undisturbed peatlands (0–47 g m−2 total land
area yr−1). In a number of countries, this situation is further exacerbated by the extraction of peat and use in horticulture,
agriculture and in the energy sector (0–36 g m−2total land
area yr−1; Lappalainen, 1996).
Peat disturbance strongly changes the regional pattern in terrestrial C stock changes (Fig. 5). Thus, in addition to land use and geographical location, also peat disturbance con-tributes to the regional differences in the terrestrial C balance (Fig. 6).
22 I. A. Janssens et al.: European terrestrial carbon balance at national scale
Janssens et al. European terrestrial C balance at national scale
34 Fig. 6
Fig. 6. Country-specific changes in terrestrial carbon stocks (sum
of forests, grassland, arable soils and peatlands) expressed per unit total land area (g m−2land area yr−1; allows comparisons among countries differing in size). Negative values indicate net losses, pos-itive values indicate net gains.
3.6 Biospheric C balance at the national scale
In most countries, the net terrestrial C balance estimate is thus much smaller than the component fluxes (Table 1) or the fossil fuel-derived C emissions (see below). However, at the continental scale, most inverse atmospheric models estimate a 60% higher sink than the land-based approach in this study (Janssens et al., 2003). This discrepancy may suggest that we miss C uptake (e.g. in urban areas or aquatic sediments) or losing C through unaccounted pathways (e.g. riverine C into oceans). The discrepancy could also be related to errors associated with the difficulties in measuring and modelling soil C dynamics, and the need to use simplified models in such a complex landscape.
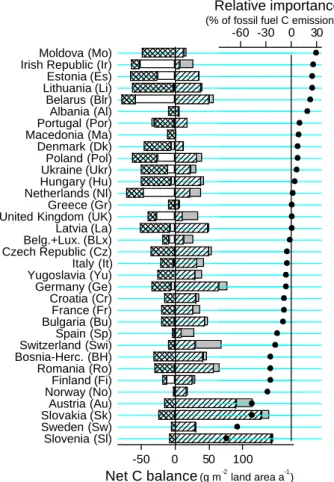
Nonetheless, the typically small net terrestrial C balance often conceals two large but opposing trends: C uptake by forests (and grasslands) versus C losses from arable soils (and in some countries from disturbed peatlands; Fig. 7). The fact that the small net C balance results from a balance be-tween large C sinks and large C sources has two important implications. First, as discussed at great length before, since forestry-oriented countries are sequestering C into their ter-restrial ecosystems and agriculture-dominated countries tend to lose C, there is very large regional variability in the net bio-spheric C uptake among individual European countries. For example, in Slovenia and Sweden, terrestrial ecosystems se-quester more than 50% of the C emitted to the atmosphere via fossil fuel consumption and cement manufacture (Fig. 7). In contrast, in cropland-dominated countries such as Moldova and Lithuania, and in countries with considerable extraction of peat deposits such as Ireland and Belarus, terrestrial C stocks are estimated to decline at a rate equivalent to more than 25% of the nation’s fossil fuel emissions. Thus, not only
Janssens et al. European terrestrial C balance at national scale
1 Slovenia (Sl) Sweden (Sw) Slovakia (Sk) Austria (Au) Norway (No) Finland (Fi) Romania (Ro) Bosnia-Herc. (BH)Switzerland (Swi) Spain (Sp) Bulgaria (Bu) France (Fr) Croatia (Cr) Germany (Ge) Yugoslavia (Yu) Italy (It) Czech Republic (Cz) Belg.+Lux. (BLx) Latvia (La) United Kingdom (UK) Greece (Gr) Netherlands (Nl) Hungary (Hu)Ukraine (Ukr) Poland (Pol) Denmark (Dk) Macedonia (Ma)Portugal (Por) Albania (Al) Belarus (Blr) Lithuania (Li) Estonia (Es) Irish Republic (Ir) Moldova (Mo)
-50 0 50 100
(g m-2 land area a-1)
Net C balance
cropsink peatsink forestsink grasssink -60 -30 0 30 (% of fossil fuel C emissions)
Relative importance
Fig. 7. National estimates of the carbon balance of the four main
terrestrial ecosystems (negative is loss, positive is gain) and the im-portance of the total terrestrial carbon balance relative to the 1995 fossil fuel C emissions. negative is reduced emissions by uptake, positive is enhanced emissions by losses).
is there a large regional variability, but it is also clear that bio-spheric C sinks and sources are substantial in certain coun-tries, even in a continent dominated by fossil fuel-derived C fluxes. However, it should be noted that changes in land use and management, which are significant in Central and East-ern Europe since 1990, could not be considered. Therefore, the estimates for these countries should be interpreted with caution.
Second, major implication of the balance between large sinks and large sources is that minor relative changes on ei-ther side of the balance could strongly affect the current small net C uptake by the European terrestrial biosphere. Hence, biospheric schemes should not a priori be discarded as an option to mitigate Europe’s contribution to the rise in
I. A. Janssens et al.: European terrestrial carbon balance at national scale 23
3.7 The sponge analogy
Functionally, the European biosphere is comparable with an unsaturated sponge. Some pores are currently filling up, while others are leaking C at a rate almost equal to that of the C being added, resulting in only minor changes in the total C content of the sponge. To fill up the sponge at a faster rate (enhance the net C sink), management policies should focus on three levels: a) ensure that pores that are currently filling up continue to fill up (managed forests and grasslands); b) reduce C losses from leaking pores (mitigation options for arable soils); and c) reduce the pressure on pores that are al-most saturated (peat deposits and old forests).
3.7.1 Continue filling up. . .
During the 1990s European forests have reduced the
in-crease in atmospheric CO2 by absorbing no less than 20%
of Europe’s fossil C emissions (Janssens et al., 2003), al-most the equivalent of all C emitted by the transport sec-tor or the manufacturing industry (http://reports.eea.eu.int/ environmental assessment report 2003 10/en). The current sink behavior of Europe’s forest sector primarily originates from a reduction in the harvest ratio and from the uneven age structure of Europe’s production forests, with a significant share of young forest stands. However, in the absence of pro-tective measures, the forest C sink will revert within a couple of decades as a result of the progressing tree age structure (the same harvest ratio results in less C uptake when forests are older and less productive – a wave-like effect in trajec-tories). In this case, European countries will increasingly stop sequestering C in their forests, potentially resulting in negative terrestrial C balances. If economic stimuli were to change forest management towards shorter rotations, this process would be accelerated, because the average soil and biomass pools would be lower than under the current man-agement. In contrast, C-oriented forest management prac-tices such as selective- rather than clear-cut harvesting, and continuous-cover forestry, provide mechanisms via which the current sink strength of European forests may be sus-tained over longer time periods, although these are still very speculative because experimental evidence is scarce (but see Mund, 2004).
It is important that future C-oriented forest management focuses not only on C storage in the forest itself, but on the full sectorial C balance. For instance, over-protection of production forests could result in increased emissions from energy and wood-product using sectors (e.g. biomass fuels could be replaced by fossil fuels; construction wood could be replaced by steel, concrete, glass, etc.; Matthews, 1996). An increased use of wood for energy production has the po-tential to extend the period over which European production forests maintain their C mitigation potential. In this case, the C gain is not within the ecosystem itself but originates from substitution effects (i.e. less fossil fuel consumption) and has
the additional advantage that it does not saturate in the long term and is less sensitive to disturbance.
Alternatively, recent evidence suggests that, in contrast to production forests where canopies are frequently thinned, unmanaged old-growth forests remain considerable net C sinks, even after several centuries (Knohl et al., 2003; Schulze et al., 2002). Setting aside a part of the produc-tion forests could thus contribute to maintaining the positive forest sector C balance over longer time periods, and would also be beneficial to biodiversity. However, long-term stor-age in terrestrial ecosystems increases the risk of rapid losses of C in case of disturbance by fire, in particular in boreal and Mediterranean climates where fire risk is large.
In terms of maintaining or extending the current C sink in the forest sector via changes in forest management, gov-ernment policies are likely to drive future developments. In this matter, the Kyoto Protocol could play an important role. Two articles in the Kyoto Protocol address crediting for certain forestry practices (http://unfccc.int/resource/docs/ convkp/kpeng.pdf). Article 3.3 includes the C stock changes and other GHG emissions resulting from afforestation, re-forestation and dere-forestation, that is, it restricts itself to the conversion of non-forest lands into forests, and to perma-nent losses of forest lands. Article 3.4 accounts for C stock changes in existing managed forests up to a politically de-fined national cap that is only a fraction of the predicted to-tal forest C sink. The rationale for restricting the C credits for forest management was that not all of the C uptake in forest management is due to direct human influence (as
op-posed to indirect or natural effects such as CO2- or nitrogen
fertilization, climate change) or to management actions un-dertaken since 1990 as stipulated in Article 3.4. Therefore, a discount factor of 85% was initially chosen in the negotia-tions as a means of factoring out indirect and natural effects and pre-1990 management actions. Another reason for cap-ping the credits in Article 3.4 is that in the Kyoto negotia-tions, emission reduction targets were agreed before the op-portunities for meeting these targets with C sinks. Hence, there was a large potential for “windfall” credits in coun-tries with large biospheric sinks, resulting in lower reduc-tions of anthropogenic emissions of greenhouse gases than would have been the case if biospheric sinks were not in-cluded. If rules for inclusion of C sinks had been agreed before the emission limitation targets, the extent of sink in-clusion could have been factored in when setting the targets, and then there would not have been the need for an artificial cap on the C sink in forests. Because of the artificial cap and because the current forest C sink results from management practices that occurred long ago, the Kyoto Protocol does not give full credit to the sink in European forests, and therefore does not provide incentives to protect or improve the current C sink, unless the actual forest sink is below the cap.
24 I. A. Janssens et al.: European terrestrial carbon balance at national scale
3.7.2 Reduce the leak. . .
At the pan-European scale, arable soils are losing C at a rate equivalent to 10% of total fossil fuel emissions, although uncertainties remain large. In the absence of management changes, arable soils are bound reach a new dynamic equi-librium at a lower C content and thus stop losing C within a couple of decades. However, considering that management changes turned arable soils in North-America into large C sinks (Pacala et al., 2001), it should also be possible to con-siderably reduce C losses from European arable soils even before the end of the first commitment period of the Kyoto protocol (2012), provided that policy measures are taken to stimulate such practices (Smith, 2004). Using biological, so-cial and economical constraints, the realistic potential for re-ducing the current C losses by the year 2010 was estimated
at 16–19 Tg yr−1for the EU-15 (Freibauer et al., 2003) and
46 Tg yr−1for continental Europe (Smith, 2004). This
emis-sion reduction potential estimate is smaller than the current C
losses (estimated at 120 Mt yr−1for Europe excluding
Rus-sia), but uncertainty in both estimates is very large.
Agricul-ture is Europe’s largest emitter of N2O and CH4(Freibauer,
2003), so mitigation should focus not only on C sequestra-tion, but also on the other biogenic greenhouse gases.
In its current form, the Kyoto protocol does not contain broadly applicable mechanisms to credit past and present sustainable land management. Countries that have managed their land in a sustainable way and have small C losses are therefore not eligible for credits, whereas countries that have not managed land sustainably will have. Also, the Kyoto Protocol does allow credits for reductions in greenhouse gas emissions or enhancement of sinks due to agricultural man-agement changes since 1990, but in the case of C, the re-ported gains need to be verifiable, and only the net changes relative to the 1990 baseline are accepted. To date, estimat-ing this net change based on trends in management remains challenging, limiting the capacity of the Kyoto Protocol to stimulate changes in agricultural practices to reduce emis-sions of CO2, N2O and CH4.
3.7.3 Protect existing large reservoirs
In addition to preserving the inflow, and reducing the out-flow of C, there is also a need to “protect existing large reser-voirs”. For example, European forests (Dixon et al., 1994) and peatlands (Armentano and Menges, 1986) are both esti-mated to contain 30–40 Pg C, and a 5% reduction of either of these C pools would equal the annual fossil fuel C emissions from the continent. Harmon et al. (1990) clearly showed that conversion of old-growth forest to rotation forestry resulted in a long-term net C loss to the atmosphere. Cox et al. (2000) and Huntingford et al. (2004) clearly showed that a loss of C from the Amazon basin following climate change could be larger than any attempts to reduce fossil fuel emissions.
Because the rate of C losses from terrestrial ecosystems is an order of magnitude faster than that of C sequestration (K¨orner, 2003), an effective protection of the already existing C stocks therefore appears to be another important strategy. In its present form, the Kyoto protocol does not offer suffi-cient protection of large terrestrial C pools.
If Europe were to maintain its current forest and grass-land sink and stop all C losses from arable soils and peat soils, the terrestrial C sponge would absorb 16% of the Euro-pean C emissions from fossil fuel consumption, as opposed to the current 4.5% (this 4.5% estimate is smaller than that reported in Janssens et al. (2003), because our new estimate excludes Russia). Taking into account social and economical constraints, a more realistic potential for C sequestration dur-ing the first commitment period of the Kyoto Protocol is 9% (twice the current uptake). An additional uptake of almost 5% of the European anthropogenic emissions would
signifi-cantly slow the current increase in atmospheric CO2. At the
individual country level mitigation options could have even larger effects, turning most agriculture-dominated and peat-consuming countries into C sinks. Furthermore, in addition to the climatic benefits of soaking up large amounts of C, also the water and nutrient budgets and biodiversity in terrestrial ecosystems would be positively affected by increasing soil C (Smith, 2004).
At the individual country level, more focused guidelines can be derived from results presented in Table 1. For ex-ample, if Austria, Slovenia and Slovakia are to protect their current large terrestrial C sinks, they will need to protect the current uptake by forests. Moldova and Lithuania, in con-trast, could gain much more by reducing C losses from arable soils than by protecting their current sink in forests. In Be-larus and the Irish Republic, peat disturbance is the dominant C loss and thus deserves most attention.
In the absence of management changes, however, the ter-restrial C sink is bound to decline. National administrations are unlikely to change local land-use policies only for the
sake of reducing the rise in atmospheric CO2. To change
current management practices, economical incentives should originate from international initiatives such as the Kyoto pro-tocol. This calls for more flexibility and simplified treatment of the terrestrial sink in international negotiations, in order to create the prospect of providing better incentives for C-oriented land management via international protocols.
4 Conclusions
In all European countries, forests and grasslands were net carbon sinks, whereas arable lands were net sources of car-bon to the atmosphere. Thus, at the national scale, cur-rent land use was a dominant determinant for the net car-bon balance of the terrestrial biosphere. Other important drivers were geographic position (climate) and peat distur-bance. Although at the continental scale European terrestrial
I. A. Janssens et al.: European terrestrial carbon balance at national scale 25 ecosystems are a net carbon sink, many individual countries
are net sources.
In the absence of land use – and land management changes, the terrestrial carbon sinks and sources are likely to decline. Carbon-oriented land management offers the poten-tial to reduce carbon losses from arable lands and extend the net carbon uptake by forests and could thus partly offset fos-sil fuel emissions. Although this should not be regarded as a solution, it also should not be dismissed as a helpful tool that can retard climate warming for a limited time period (decade or so).
In order to be effective, carbon-oriented land management should focus on three levels: 1) Disturbance of wetlands or old-growth forests results in a rapid loss of carbon, whereas carbon uptake proceeds at a much slower rate. Thus, pro-tection of existing large carbon stores is critical. 2) Revers-ing the current carbon losses from arable soils by adoptRevers-ing revised management schemes that enhance carbon inputs to the soil and reduce soil disturbance. 3) Preserving the cur-rent carbon sink in European forests. This could be achieved by adopting less-disturbing management practices, by substi-tuting fossil fuels with wood products and by creating more protected forest reserves.
All data and detailed methodologies can be obtained from the corresponding author.
Acknowledgements. We thank J. Siemens, M. Lindner, an
anony-mous referee and subject editor T. Battin for their constructive criticism on the previous version of this manuscript. All authors are members of CarboEurope-IP (a project to understand and quantify the C balance of Europe; http://www.carboeurope.org/), supported by the European Commission (Directorate-General Research, Sixth Framework Programme, Contract No. GOCE-CT-2003-505572). Edited by: T. J. Battin
References
Armentano, T. V. and Menges, E. S.: Patterns of change in the car-bon balance of organic soil wetlands of the temperate zone, J. Ecol., 74, 755–774, 1986.
Armentano, T. V. and Verhoeven, J. T. A.: Biogeochemical cy-cles: global, in: Wetlands and Shallow Continental Water Bod-ies, edited by: Patten, B. C., SPB Academic Publishing, The Hague, 281–311, 1990.
Botch, M. S., Kobak, K. I., Vinson, T. S., and Kolchugina, T. P.: Carbon pools and accumulation in peatlands of the former Soviet Union, Glob. Biogeochem. Cycles, 9, 37–46, 1995.
Ciais, P., Tans, P. P., Trolier, M., White, J. W. C., and Francey, R. J.: A large northern hemisphere terrestrial CO2sink indicated by
the13C/12C ratio of atmospheric CO2, Science, 269, 1098–1102,
1995.
Cox, P. M., Betts, R. A., Jones, C. D., Spall, S. A., and Totterdell, I. J.: Acceleration of global warming due to carbon-cycle feed-backs in a coupled climate model, Nature, 408, 184–187, 2000. Dersch, G. and Boehm, K.: Bodenschutz in ¨Osterreich, edited
by: Blum, W. E. H., Klaghofer, E., Loechl, A., and
Ruck-enbauer, P., Bundesamt und Forschungszentrum fur Land-wirtschaft, ¨Osterreich, Germany, 411–432, 1997.
Dixon, R. K., Brown, S., Houghton, R. A., Solomon, A. M., Trexler, M. C., and Wisniewski, J.: Carbon pools and flux of global forest ecosystems, Science, 263, 185–190, 1994.
FAO statistical databases: http://www.fao.org/waicent/portal/ statistics en.asp.
Finnish Ministry of the Environment: Finland’s Third National Communication under the United Nations Framework Conven-tion on Climate Change, Ministry of the Environment, Helsinki, 2001.
Freibauer, A.: Biogenic Emissions of Greenhouse Gases from Eu-ropean Agriculture, EuEu-ropean J. Agron., 19, 135–160, 2003. Harmon, M. E., Ferrell, W. K., and Franklin, J. F.: Effects on
car-bon storage of conversion of old-growth forests to young forests, Science, 247, 699–702, 1990.
Huntingford, C., Harris, P. P., Gedney, N., Cox, P. M., Betts, R. A., Marengo, J. A., and Gash, J. H. C.: Using a GCM analogue model to investigate the potential for Amazonian dieback, Theo-retical and Applied Climatology, 78, 177–185, 2004.
Intergovernmental Panel on Climate Change (IPCC): Climate Change 2001: The Scientific Basis, Cambridge University Press, Cambridge, 2001.
Janssens, I. A., Freibauer, A., Ciais, P., Smith, P., Nabuurs, G.-J., Folberth, G., Schlamadinger, B., Hutjes, R. W. A., Ceule-mans, R., Schulze, E.-D., Valentini, R., and Dolman, A. J.: Eu-rope’s terrestrial biosphere absorbs 7 to 12% of European An-thropogenic CO2emissions, Science, 300, 1538–1542, 2003. Knohl, A., Schulze, E.-D., Kolle, O., and Buchmann, N.: Large
carbon uptake by an unmanaged 250-year-old deciduous forest in Central Germany, Ag. For. Met., 118, 151–167, 2003. K¨orner, C.: Slow in, rapid out – carbon flux studies and Kyoto
tar-gets, Science, 300, 1242–1243, 2003.
Lappalainen, E.: Global Peat Resources, International Peat Society, Jysk¨a, 1996.
Lehtonen, A., Makipaa, R., Heikkinen, J., Sievanen, R., and Liski, J.: Biomass expansion factors (BEFs) for Scots pine, Norway spruce and birch according to stand age for boreal forests, For. Ecol. Manage., 188, 211–224, 2004.
Liski, J., Karjalainen, T., Pussinen, A., Nabuurs, G.-J., and Kauppi, P.: Trees as carbon sinks and sources in the European Union, Env. Sci. Pol., 3, 91–97, 2000.
Liski, J., Perruchoud, D., and Karjalainen, T.: Increasing carbon stocks in the forest soils of western Europe, For. Ecol. Manage., 169, 159–175, 2002.
Matthews, R. W.: Forest Ecosystems, edited by: Apps, M. J. and Price, D. T., Forest Management and the Global Carbon Cy-cle, NATO ASI Series Vol. 40, Springer-Verlag, Berlin, 233–243, 1996.
Milne, R., Tomlinson, R., and Gauld, J.: UK Emissions by Sources and Removals by Sinks due to Land Use, Land Use Change and Forestry Activities, DEFRA, available at: http://www.nbu.ac.uk/ ukcarbon/, 2001.
Mucher, C. A.: PELCOM, Pan-European Land Use and Land Cover Monitoring, ALTERRA, Wageningen, 2000.
Mund, M.: Carbon pools of European beech forests (Fagus sylvat-ica) under different silvicultural management, PhD thesis, Uni-versity of Goettingen, 2004.
26 I. A. Janssens et al.: European terrestrial carbon balance at national scale
separate direct from indirect, edited by: Field, C. B. and Rau-pach, M., The Global Carbon Cycle, Island Press, Washington, 317–326, 2004.
Nabuurs, G.-J., Pussinen, A., Liski, J., and Karjalainen, T.: Long-Term Effects of Climate Change on Carbon Budgets of Forests in Europe, edited by: Kramer, K. and Mohren, G. M. J., Alterra, Wageningen, 220–234, 2001.
Nabuurs, G.-J., Schelhaas, M. J., Mohren, G. M. J., and Field, C. B.: Temporal evolution of the European forest sector carbon sink 1950–1999, Glob. Change Biol., 9, 152–160, 2003.
Ney, R. A., Schnoor, J. L., and Mancuso, M. A.: A methodology to estimate carbon storage and flux in forestland using existing forest and soils databases, Environ. Monit. Assess., 78, 291–307, 2002.
Olivier, J. G. J. and Berdowski, J. J. M.: Global emissions sources and sinks, in: The Climate System, edited by: Berdowski, J., Guicherit, R., and Heij, B. J., A. A. Balkema Publishers/Swets & Zeitlinger Publishers, Lisse, 33–78, 2001.
Pacala, S. W., Hurtt, G. C., Baker, D., Peylin, P., Houghton, R. A., Birdsey, R. A., et al.: Consistent land- and atmosphere-based U.S. carbon sink estimates, Science, 292, 2316–2320, 2001.
Sleutel, S., De Neve, S., and Hofman, G.: Estimates of carbon stock changes in Belgian cropland, Soil Use & Manage., 19, 166–171, 2003.
Smith, P.: Engineered biological sinks on land, edited by: Field, C. B. and Raupach, M., The Global Carbon Cycle, Island Press, Washington, 479–491, 2004.
TBFRA: Forest Resources of Europe, CIS, North America, Aus-tralia, Japan and New Zealand, UN-ECE/FAO, Geneva, 2000. Vleeshouwers, L. M. and Verhagen, A.: Carbon emissions and
se-questration by agricultural land use: a model study for Europe, Glob. Change Biol., 8, 519–530, 2002.
Weiss, P. and Schlamadinger, B.: Research activities related to the role of forests and forestry in climate change mitigation in Aus-tria, Biotech. Agron. Soc. Environ., 4, 252–258, 2000.
Wirth, C., Schumacher J., and Schulze, E.-D.: Generic biomass functions for Norway spruce in Central Europe – a meta-analysis approach toward prediction and uncertainty estimation, Tree Physiol., 24, 121–139, 2004.