HAL Id: hal-02344506
https://hal.archives-ouvertes.fr/hal-02344506
Submitted on 4 Nov 2019HAL is a multi-disciplinary open access archive for the deposit and dissemination of sci-entific research documents, whether they are pub-lished or not. The documents may come from teaching and research institutions in France or abroad, or from public or private research centers.
L’archive ouverte pluridisciplinaire HAL, est destinée au dépôt et à la diffusion de documents scientifiques de niveau recherche, publiés ou non, émanant des établissements d’enseignement et de recherche français ou étrangers, des laboratoires publics ou privés.
Rovibrational laser jet-cooled spectroscopy of SF 6 –rare
gas complexes in the ν 3 region of SF 6
Pierre Asselin, Andrew Turner, Laurent Bruel, Valérie Brenner, Marc-André
Gaveau, Michel Mons
To cite this version:
Pierre Asselin, Andrew Turner, Laurent Bruel, Valérie Brenner, Marc-André Gaveau, et al.. Rovi-brational laser jet-cooled spectroscopy of SF 6 –rare gas complexes in the ν 3 region of SF 6. Physical Chemistry Chemical Physics, Royal Society of Chemistry, 2018, 20 (44), pp.28105-28113. �10.1039/c8cp04387f�. �hal-02344506�
1
Rovibrational laser jet-cooled spectroscopy
of SF
6-rare gas complexes in the
3region of SF
6Pierre Asselina, Andrew C. Turnerb
, Laurent Bruelc, Valérie Brennerd, Marc-André Gaveaud and Michel Monsd
a
Sorbonne Université, CNRS, MONARIS, UMR 8233, 4 place Jussieu, Paris, F-75005 France.
b
Department of Earth and Planetary Science, University of California, Berkeley, California 94720 USA.
c
CEA Marcoule, DEN, 30207 Bagnols-sur-Cèze, France
d
LIDYL, CEA, CNRS, Université Paris-Saclay, CEA Saclay 91191 Gif-sur-Yvette France
Abstract
High resolution infrared spectroscopy combining an external cavity quantum cascade laser with a pulsed pin hole supersonic jet is used to investigate small van der Waals (vdW) hetero clusters containing SF6 and rare gas (Rg) atoms in the 3 region of SF6. In a first analysis, the
rovibrational band contours of parallel and perpendicular transitions of 1:1 SF6-Rg hetero
dimers (Rg = Ar, Kr, Xe) are simulated to derive ground and excited state parameters and hence ground state and equilibrium S-Rg distances with a precision better than 0. 5 pm. These values are used to assess quantum chemistry calculations (DFT-D method) as well as semi-empirical predictions (combination rules). In a second step, the spectral signatures of the 1:1 heterodimers and of larger heteroclusters containing up to three Rg atoms have been identified by considering reduced vibrational red shifts, i.e., shifts normalized to the average 1:1 red shift. The reduced vibrational red shifts within the series of bands observed and assigned to 1:1 and 1:2 complexes are found to be independent upon the Rg atom, which suggests similar 1:1 and 1:2 structures along the Rg series. In addition, the increasing number of bands when going from monomer to 1:2 complexes illustrates the increased lifting of vibrational degeneracy induced by Rg solvation. Finally, the vibrational shifts of the 1:1 SF6-Rg hetero
dimers are found to fit an intermolecular interaction model in which long–range attractive and short-range repulsive contributions to the vibrational shift are found to partially compensate, the former being dominant. From the same model, well depths are obtained and are found to compare well with quantum chemistry calculations and semi-empirical combination rules.
I-
Introduction
Weak intermolecular forces such as van der Waals interactions play an important role in molecular sciences, ranging from the control of the conformational landscape of flexible biomolecules to the structure of molecular crystals.1 These non-covalent interactions are much weaker than covalent bonds and even hydrogen bonds but their multicentric character leads to a significant contribution which turns out to control the structures and properties of van der Waals (vdW) molecular complexes. High resolution spectroscopy has proved to be a suitable method to provide information on the structures and intermolecular interactions of these systems: in the microwave region a large number of studies using molecular beam electric resonance2 or pulsed nozzle Fourier transform techniques3 enabled the characterization of
2
structure and internal dynamics in the ground state. In the near-UV region, laser induced fluorescence electronic spectroscopy has been used to provide a detailed description of the solvation of aromatic molecules by rare gas atoms and document the role of vdW modes in molecular dynamics.4,5
The development of high resolution (HR) infrared (IR) spectroscopy in supersonic jets has allowed direct determinations of the potential energy surface (PES) of several diatomic (HF, HCl)6,7,8,9 and linear triatomic molecules such as CO2,10,11,12 N2O13,14 and
OCS15,16,17 interacting with rare gases (Rg). For more details the reader can refer to the
website devoted to the bibliography of weakly bound complexes (involving Rg or not).18 The rovibrational analysis of such small complexes provided very precise structural parameters used to model the intermolecular PES. The dynamical picture is indeed more challenging in the case of floppy weakly bonded vdW Rg complexes with partners having large amplitude motions such as H2O19,20 and NH321,22: HR IR spectra of such complexes directly probe the
rovibrational states related to a nearly flat PES with low energetic barriers along angular coordinates of the species. Compared to microwave spectroscopy, very few infrared studies have been reported so far about mixed vdW clusters associating rare gases and large polyatomic molecules.18,23,24,25,26 Taking advantage of powerful line-tunable cw CO2 lasers,
Gough et al.24 implemented infrared photofragmentation spectroscopy in molecular beams to study the low resolution IR spectrum of argon clusters seeded with a single SF6 molecule in
the spectral region of the triply degenerate 3 vibration at 948 cm-1. The 3 band of SF6 in SF6
clusters was found to shift monotonically to the red when increasing the backing pressure as a consequence of increasing average cluster size. Thereafter, Hartmann et al.27 achieved the first high resolution laser spectroscopic study of vdW clusters of SF6 and mixed SF6-rare gas
clusters in helium droplets at 0.37 K. Partially resolved rotational contours split into parallel and perpendicular bands are observed but no structural information transposable to the gas phase could be extracted.
In a recent paper, we reported a high resolution infrared laser jet-cooled study of the SF6 dimer and (SF6)2-Rg heterotrimers in the 3 mode region.28 Taking advantage of our
versatile set-up, various experimental conditions of nozzle geometry, axial distance and SF6
concentration were explored to revisit the conformational landscape of the SF6 dimer.
The present paper is devoted to the spectroscopic characterization of the 1:1 SF6-Rg
heterodimers in the 3 mode region using the same infrared tunable laser spectrometer
recently implemented in our laboratory. The high resolution rovibrational spectra of parallel and perpendicular bands of SF6-Rg complexes enable us to extract precise S-Rg bond lengths
and band origin shifts. Lastly, vibrational signatures assigned to larger heteroclusters up to SF6-(Rg)3 on the red side of the 1:1 heterodimer constitute an interesting benchmark to test
the evolution of red shift with cluster size at least for the first solvation steps. These experimental data are then used to parameterize a simple model for the intermolecular potential.
3
II- Experimental details
The vibration-rotation spectra of SF6-rare gas clusters have been recorded using an
external-cavity quantum cascade laser (EC-QCL) coupled to a pulsed supersonic jet. This set-up has been already described in previous papers28,29 and only the main characteristics will be described in the present study.
The light source is a continuous-wave room-temperature mode-hop-free EC-QCL with a spectral width of 10 MHz, which covers the 930-990 cm-1 range (Daylight Solutions). About 8% of the total light power (about 120 mW around 950 cm-1) is sent through two laser channels for relative and absolute frequency calibrations. The remaining light is sent through a multipass astigmatic cavity according to a 182-pass pattern which crosses almost perpendicularly the jet expansion.
In our recent study on pure (SF6)2 and mixed (SF6)2-rare gas clusters,28 molecular
complexes were stabilized regardless of the geometry of the supersonic expansion used, which enabled to vary the rotational temperature (between 3 K and 0.8 K, respectively in planar and axisymmetric expansions under comparable generating conditions) and promote one conformer with respect to the other. In the present work, (SF6)-Rg complexes were
investigated in the same manner from the expansion of a molecular jet at very high dilution of a SF6/Rg mixture (corresponding to about 1% of the total gas flow injected for Ar, Kr and Xe)
seeded in helium at backing pressures as high as 8 bar. Two nozzle geometries were tested: a pulsed circular pin hole nozzle (General Valve Series 9) in standard configuration with a 0.35 mm diameter (D) pin hole and a slit nozzle obtained by fitting the pin hole nozzle with two modified industrial blades, forming a 30 mm length x 50 µm width (l) slit opening. With the pin hole nozzle, the van der Waals heterodimers were formed and rotationally cooled at temperatures TR below 1 K and then probed by the many infrared laser spots distributed in a
broad region of the expansion, at z average distances from the nozzle comprised between 9 and 18 mm with a length z of about 10 mm. These z values correspond to a range of reduced
distances z/D between 25 and 50. A good balance between efficient rovibrational cooling and high molecular density was found at about z = 15 mm (z/D = 43) for the present pin hole jet expansions with translational temperatures largely below 1 K in the region z probed.
Our rapid scan scheme is similar to previous designs developed for high resolution molecular spectroscopy.30 A baseline-free transmittance through the multipass cavity is obtained by taking the ratio of signals recorded in presence and absence of the jet (by opening or not the valve). The procedure for absolute frequency calibration is achieved a posteriori by measuring the deviation between experimental and HITRAN12 database C2H4 frequencies to
correct the free spectral range value of the etalon fixed at the beginning of each experiment. The accuracy of the frequency calibration is around 0.0005 cm-1.
III Experimental results
Guided by the results of previous infrared experiments on SF6-Rg clusters,24,27
rovibrational signatures have been searched on the red side of the 3 band origin of SF6
monomer using SF6/Rg equimolar mixtures and different dilutions of SF6 in He at backing
pressures of 8 bar. While SF6-Rg clusters are expected to be more easily detected in planar
4
complex absorption could be detected with the slit nozzle at any dilution used. The absence of such 1:1 complex signals can be ascribed to a lower stability of the 1:1 complex compared to the homodimer, which hampers their observation in the higher temperature conditions of planar expansions. On the other hand, new bands were observed on the red side of the SF6
monomer 3 band and assigned to SF6-Rg (Rg = Ne, Ar, Kr, Xe) 1:1 clusters when replacing
with the pin hole nozzle. The 1:1 absorption signal observed was maximized by tuning the SF6:Rg ratio to 1:8 for heavier rare gases and 1:100 for Ne. Due to the very close presence of
the intense 3 band of SF6 monomer, jet-cooled spectra of SF6 monomer were recorded with
the same SF6/He dilution as that used with the SF6/Rg/He ternary mixtures, and then
subtracted to isolate the contribution of the vdW SF6-Rg heterodimers. Figure S1 (in the
SupMat file) displays the example of the SF6-Ar spectrum, exhibiting a large contribution of
the SF6 monomer 3 band which can be efficiently removed following this subtraction
procedure. Figure 1 displays the four EC-QCL jet-cooled spectra of SF6-Rg for Rg = Ne, Ar,
Kr and Xe after subtraction. Rotational analyses
By analogy with the the SF6 dimer,28 it is expected to observe parallel and
perpendicular bands of SF6-Rg arising from the degeneracy lifting of the triply degenerate
state (3) of the SF6 monomer in complexes of C3v symmetry, in which the Rg atom lies above
the center of a face of the SF6 octahedral molecule.
Q-branch maxima of parallel bands for SF6-Ar, SF6-Kr and SF6-Xe are clearly visible (Fig. 1)
at 946.977, 946.638 and 946.221 cm-1, respectively with well resolved P- and R-branch structures. The K structure is not resolved within our experimental linewidth (150 MHz), limited by residual collisional and Doppler broadenings. For the three heaviest rare gases, Q-branch maxima of SF6-Rg bands exhibit increasing red shifts with respect to the 3 band of
SF6, reaching values up to 1.8 cm-1 for SF6-Xe. With Ne, the red shift is so weak that several
features of the SF6-Ne spectrum overlap with intense P branch lines of the SF6 monomer
band, which prevented any rovibrational analysis. A sharp maximum is observed at about 947.86 cm-1 but no splitting between parallel and perpendicular bands could be evidenced in agreement with the helium droplet study27.
All perpendicular bands display characteristic P,RQ(J,K) branches, in particular very
strong RQ(J,0) ones at 947.392, 947.175 and 946.897 cm-1 for SF6-Ar, SF6-Kr and SF6-Xe,
respectively, as well as broader PQ(J,K>0) and RQ(J,K>0) branches, observed on both sides
of RQ(J,0). Similarly to the perpendicular band of the SF6 dimer, SF6-Kr and SF6-Xe
complexes display a first-order Coriolis interaction, as proven by experimental spacings between nearby Q branch peaks, which are close to the calculated value of 2(A(1-)-B)
0.027 cm-1 for SF6-Kr and 0.034 cm-1 for SF6-Xe, by taking the Coriolis parameter equal to
that of the SF6 monomer, 0.69374.32
From the perpendicular band contour of SF6-Ar, the first-order Coriolis interaction is more
difficult to identify: very few intense RQ(J,K>0) branch peaks at 947.409, 947.422 and
947.435 cm-1 are found to be spaced by 0.013 cm-1 in agreement with the calculated spacing value while PQ(J,K>0) branch peaks are too weak to be observed. Additionally, a series of
5
intense features is observed on the R branch side with a spacing ranging between 0.055 and 0.063 cm-1, which could belong to RR(J,K) or PR(J,K) lines.
Our experiments confirm the reduction of the three-fold degeneracy of the 3 mode of
the SF6 monomer through a first-order Coriolis interaction, consistent with the existence of A
and E states in complexes of C3v symmetry. A two-step band contour analysis was carried out:
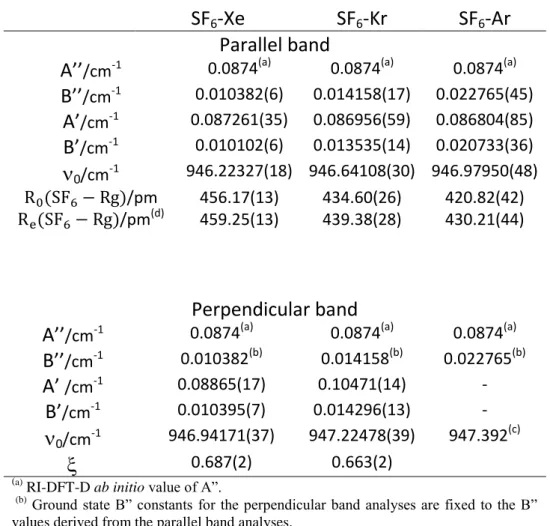
firstly, the three parallel bands of SF6-Ar, SF6-Kr and SF6-Xe (Figure 2) were simulated
according a symmetric top structure in order to derive best fit molecular parameters //, A’, B”
and B’. The ground and 3 excited states experimental rotational constants were used to obtain
accurate experimental ground state ( ) and equilibrium ( ) distances of SF6-Rgcomplexes,
(Table 1), assuming an unchanged monomer structure upon heterodimer formation. Secondly, perpendicular bands were simulated by fixing A” to the ab initio value and B” to the value derived from the parallel band contour simulation to obtain the best fit molecular parameters
A’, B’, and . Figure 3 displays the satisfactory comparison between jet-cooled perpendicular band spectra of SF6-Kr and SF6-Xe and our best simulations. In contrast, the
observed perpendicular band of SF6-Ar could not be correctly fitted : the small number of
R
Q(J,K>0) branch bands prevented us to carry out a rovibrational analysis. Table 1 reports the
sets of molecular parameters derived from these band contour analyses. The transition frequencies of parallel and perpendicular bands of the SF6-Rg heterodimers are listed in the
Table S1 of Supplementary Material File. Finally one can notice that, in contrast to our previous work on SF6 dimers28, no spectroscopic evidence for the presence of ternary SF6
-Rg-He clusters could be found, presumably because of a too weak binding energy of the helium atom to the heterodimers under the present jet conditions.
Spectral shifts
On the red side of both parallel and perpendicular bands of heterodimers, ten additional weaker bands are observed: at 946.693, 946.483, 946.220 and 945.664 cm-1 in the SF6-Ar spectrum, at 946.241, 945.938, 945.612 and 945.320 cm-1 in the SF6-Kr spectrum and
at 945.857 and 945.371 cm-1 in the SF6-Xe spectrum (indicated by stars in Figure 1). The
corresponding red shifts range between 1 and 3 cm-1, which is consistent with the signature of larger heteroclusters containing up to three Rg atoms, assuming a red shift additivity rule. In addition, since the larger complexes are expected to exhibit a complete degeneracy lifting of the 3 vibration, a set of three bands can be anticipated for each of them, leading to increased
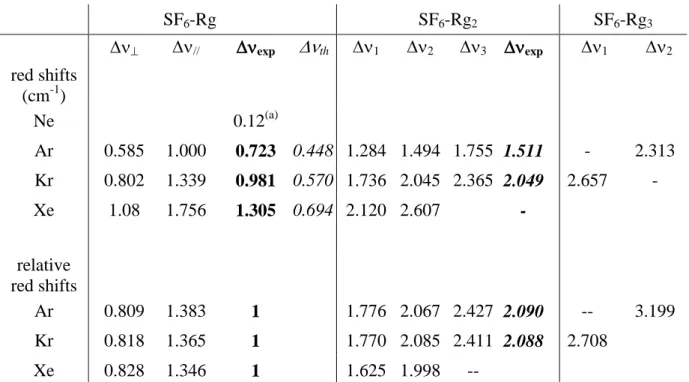
complexity of the spectral pattern. In order to assign the spectra and assess their robustness relative to the nature of the rare gas, reduced red shifts have been considered (Table 2), i.e., red shifts normalized to the average red shift measured for the corresponding 1:1 complex, which is defined as :
(1)
where
and correspond to the red shift of parallel and perpendicular bands,respectively.
For the 1:1 complexes, reduced red shifts obtained for both the parallel and perpendicular bands are nearly independent upon the nature of the rare gas, with values close to 0.81 and 1.36 respectively. This suggests comparable structures and symmetry for this
6
complex along the rare gas series, in agreement with the C3v symmetry anticipated, due to
three simultaneous F-Rg close contacts. Interestingly, the three next reduced shifts obtained along the series of Ar, Kr and Xe rare gases beyond the 1:1 complex also turn out to be nearly independent upon the nature of the rare gas, with values close to 1.7, 2.0 and 2.4, and an average value of about 2.0.
IV Discussion
Comparison between experimental and theoretical structural parameters
The ground and excited state rotational constants derived from the present study provide reliable intermolecular and distances for the three SF6-Rg complexes containing
heavier rare gases (Table 1) with an accuracy ranging between 0.13 pm for SF6-Xe and 0.44
pm for SF6-Ar. It is worth comparing experimental distances with both ab initio
calculations and simple theoretical models to evaluate the predictive character of these methods.
In order to account for the dispersive character of the vdW SF6-Rg interactions,
geometry optimizations have been carried out using density functional theory corrected by explicit dispersion terms (DFT-D), at the RI-B97-D/def2-TZVPPD level of theory with the D3 type Grimme correction (including the Becke-Johnson damping and three-body terms), and using an adapted pseudo potential (effective core potential) for Xe.33 All calculations were carried out using the TurboMole34 package. This method was first validated on purely dispersive Rg-Rg dimers, as a test case before applying it to SF6-Rg systems. Relative
discrepancies ranging between 3 and 7 % were obtained for these homodimers , always with an overestimation of the Rg-Rg distances, compared to distances derived from various fitting procedures of experimental data. 35,36,37,38 Geometry optimization of the SF6-Rg complexes
were carried out, either with or without a C3v geometry constraint. The C3v geometry minima
are found to be saddle points connecting three minima of Cs symmetry. For the three heavier
Rg atoms from Ar, the (three equivalent) minima differ from the corresponding C3v symmetry
structure by a slight off-C3v axis position of the rare gas (by less than 5 pm towards the gap
between two neighbouring F atoms) and slightly shorter S-Rg distances (typically 2-5 pm). The energy difference between the Cs minima and the C3v saddle point is lower than 0.3
kJ/mol (i.e. 13 % of the SF6-Ar well depth, and 7 % for the heavier rare gases). Such a
peculiarity suggests a relatively flat surface with multiple minima for the motions of the Rg perpendicularly to the C3v axis, potentially already connected in the vibrational ground state,
since the intermolecular ZPE typically amounts to 0.5 kJ/mol in all three species. These results can thus be considered as compatible with the spectroscopic evidence for the C3v
symmetry (at least from Ar), taking vibrational averaging into account. The case of Ne is similar but differs quantitatively by an off-axis position of the Ne atom in the minimum more shifted (by 60 pm) than with heavy rare gases. The energy difference between the off-axis Cs
minima and the C3v minimum remains modest (0.26 kJ/mol) but the relative variation is larger
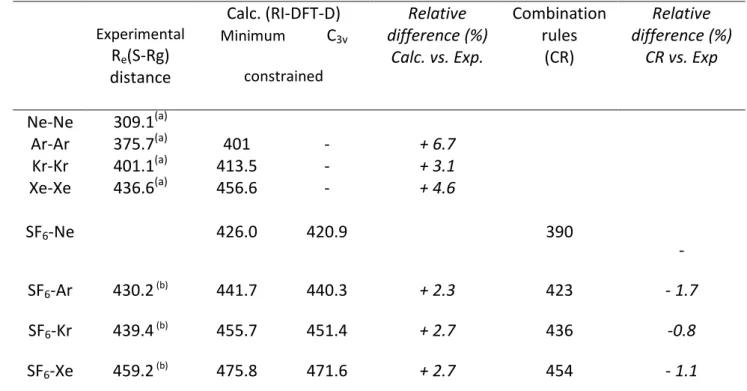
than with heavier atoms (~21%) due to a smaller well depth ; from the similar intermolecular ZPE than previously, the same extensive vibrational averaging can be expected. The distances obtained from DFT-D calculations (Table 3) compare well with the experimental
7
data, with a relative discrepancy in the 2-3% range weaker than in the Rg-Rg dimers (see above), neglecting any averaging effect due to zero point vibrational energy.
The same distances can be also predicted from the combination rules (CR),39,40 currently used to derive the vdW Lennard-Jones well depths and equilibrium interatomic distances from of (SF6)2 and of (Rg)2 homodimers. For
our comparisons, the distance of heterodimers is obtained from the arithmetic mean of the vdW radii of corresponding homodimers, i.e. . The value of 470.5 pm has been taken from Aziz et al.41 who derived it from virial data, viscosity and a Morse-Morse-Spline-van der Waals (MMSV) potential; for the distances, values experimentally determined from the fit of literature data have been used.35-38 The distances predicted from the combination rules40 (Table 3) are in good agreement with the present measurements, with a -1.2(5) % deviation in average with respect to experiment, suggesting that the combination rules provide a relevant alternative to quantum chemistry calculations, at least at the level of theory used. Owing to the opposite trends of these theoretical approaches (systematic overestimation vs. underestimation of the distances from DFT-D calculations and combination rules, respectively), the theoretical results can be used to bracket the distance, which could not be deduced from the rovibrational analysis. This distance can be reasonably estimated around 405 pm, with a precision not better than 15 pm.
In the following, we will exploit these intermolecular distances as well as the parallel and perpendicular experimental shifts derived from the present high resolution jet-cooled infrared study to assess the quality of a model intermolecular potential for SF6-Rg.
Signature of larger SF6-Rg2,3 heteroclusters
The red shift patterns reported in Table 2 suggest three remarks: (i) the reduced shift patterns observed do not depend significantly upon the rare gas considered . This result suggests that the complexes retain the same symmetry and similar geometries all along the rare gas series.. The pattern observed (number of bands and positions) are consistent with a 1:1 complex of C3v symmetry and a 1:2 complex of lower symmetry, with partially and fully
lifted 3 degeneracy. (ii) a red shift additivity rule seems to hold, if one considers the average
reduced red shift of the bands assigned to the 1:2 complex. (iii) beyond the SF6-Rg2
signatures, the two remaining bands are assigned to SF6-Ar3 and SF6-Kr3 heterotetramers.
Their reduced shifts are around 3, as expected from the additivity rule, but are either above or below 3, which suggests that these bands do not correspond to the same vibrational component.
These measurements are remarkably consistent with an addition of vibrational shifts when increasing the number of Rg atoms. Moreover, the present frequency shift increment of 0.72 cm-1 per argon atom agrees well with that roughly derived from photofragmentation experiments23 which measured a total shift of 7 cm-1 for SF6-Arn clusters distributed between
8
Vibrational shift and intermolecular potential for SF6-Rg
Theoretical models were developed in the past to predict the vibrational frequency shifts of complexes between molecules of high symmetry (SiF4, SF6) and rare gases.25,42,43.
One of the issues, in particular, was to determine the several physical contributions to the shifts observed.
For such systems, a first attempt to model the band shift in the SF6-Arn clusters
assumed that it is controlled by a dipole-induced dipole mechanism, where the vibrationally-induced instantaneous dipole of the SF6 molecule interacts with the dipole induced in the Rg
atom environment.42 Though the model provided red shifts, it proved to be unable to reproduce the relative shifts of the parallel and perpendicular bands, even despite taking into account additional atom-atom pairwise contacts.
An alternative approach consists in considering directly the effects of vibrational excitation of the SF6 molecule on the parameters that describe the intermolecular potential.
Such an approach was developed by Howard and coworkers, in their study of linear molecules (N2O, CO2 and OCS) in interaction with rare gases,11,1316. Following their approach, we
describe the interaction between the highly symmetric SF6 molecule with a rare gas atom by a
radial one-dimensional Buckingham-type potential of the form44
(2) and assume that the spectral shift effects are described by changes in the repulsive and , and attractive parameters upon vibrational excitation of the SF6 molecule.
In this model, the intermolecular distance at the minimum obeys the following relationship
(3) and the well depth at the minimum (>0) is given by
) (4) Vibrational excitation induces a change of the repulsive and attractive parameters, and
respectively, while the change in repulsive parameter is assumed to be negligible. Under these assumptions, the change in the position of the radial minimum is obtained by differentiating Eqs (3) and (4) and can be expressed in the form
(5) The resulting change in the well depth is given by
9
Considering that the relative variations of ZPE due to intramolecular SF6 vibrations remain
negligible, can be replaced by . From Eq.(6), it appears that the fractional change
in the well depth results from a delicate balance between the change in attractive and repulsive contributions.
An important question is to determine how these terms vary along the series of the SF6-Rg complexes observed. On a one hand, the long range attractive forces scale with the
polarizability of the Rg atom which defines the usual order of well depths from Ne to Xe. On vibrational excitation of SF6, only the properties of SF6 do change and it is therefore
expected that the fractional change in attraction should be independent upon the nature of the Rg atom. On the other hand, the repulsive forces between the Rg atom and each of the atoms of SF6 are modulated by the individual motions of the atoms in SF6. The change
in the repulsion term can be approximated to where represents the change in the square of the amplitude of vibrational motion and should be identical for all the complexes of the same series. Hence at given only depends on , and Eq.(6) becomes:
(7)
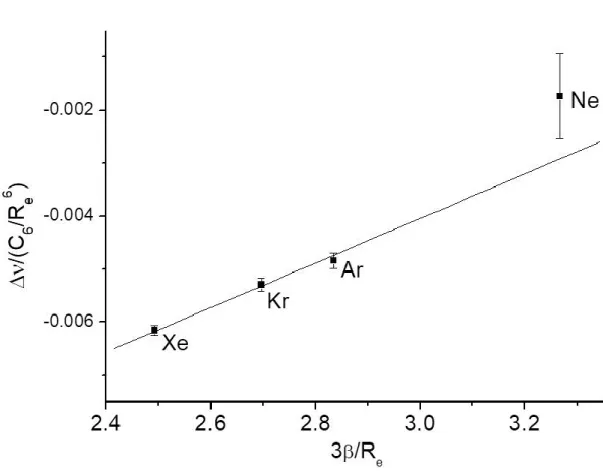
Owing to the independence of the and upon the rare gas, a linear dependence should be observed between the terms and , according to Eq. (7)
.
Inorder to check this, the relevant parameters have been quantified: Rm are taken from the
present experimental data or from combination rules (case of Ne, see Table 3) ; the repulsion parameters and the vdW coefficients for all SF6-Rg heterodimers have been derived
according to a procedure detailed in the Supplementary Material).
Table S4 in the Supplementary Material gathers all the parameters required to plot the graph of as a function of (see Fig. 4). Satisfactorily, a linear dependence is observed with a standard deviation of 2 x10⁻⁴, providing a slope of 0.00421(53) Å-2 and an intercept equal to - 0.0167(14). The strong uncertainties about the distance and the vibrational shift of the SF6-Ne heterodimer explain why a
significant deviation with respect to the linear dependence is observed with Ne (Fig. 4). However the accurate parameters derived from spectra with heavier rare gases clearly validate the modelling approach which accounts for the interaction whatever the rare gas partner. From these data, the contributions of the attraction and repulsion terms to the shift relative to the well depth can be estimated from Eq. 7, derived from Eq. 6.
(8)
The term being nearly independent from the rare gas (~1.53), one obtains a negative relative shift (red shift) due to the attractive contribution of ~ -2.5 %, independently of the Rg atom. The dependence of the shift upon the rare gas essentially arises from the repulsive term, through , whose blue shift relative contribution amounts to +2.1% with Ne and decreases to +1.6 % with Xe. As a matter of fact, these contributions of opposite signs
10
nearly compensate each other, especially in the case of Ne, rationalizing the dependence of the shift upon the rare gas.
Interestingly enough, the validity of the model along the Rg series provided by the linear correlation of Fig. 4 suggests to use the corresponding parameters to derive the well depth of these complexes (Table 4). These values are compared (Table 4) to the results of simple combination rules from well depths of Rg and SF6 homodimers,41,45 as well as to the
BSSE-corrected RI-B97-D3/def2-TZVPPD interaction energies obtained in the present work. The agreement between these three sets of data is remarkable; the DFT-D values lying between the two sets of well depths obtained from the application of combination rules and the fit of the Buckingham model As expected the well depth increases dramatically from Ne to Xe, typically by a factor 3. This trend is still more marked when dissociation energies D0
are considered (Table 4).
Conclusion
The present work reports an high-resolution IR spectroscopic study of the 1:1 SF6-Rg
(Rg = Ne, Ar, Kr, Xe) heterodimers in the region of the 3 band of SF6 monomer, carried out
using the infrared tunable quantum cascade laser spectrometer coupled to a pulsed supersonic jet developed in Monaris.28 Accurate ground state and equilibrium S-Rg distances for Rg = Ar, Kr , Xe are derived from the rovibrational analysis of parallel band contours of the 3
transition, which are used to assess DFT-D quantum chemistry calculations and semi-empirical approaches (combination rules). For these 1:1 complexes, the similarities in vibrational shift pattern for the parallel and perpendicular bands along the Rg series, together with the rotational analyses, suggest similar C3v symmetry structures all along the series. The
vibrational red shifts observed along the 1:1 SF6-Rg heterodimer series are found to be
consistent with a one-dimensional radial Buckingham PES, whose analysis suggests that the shift is controlled by a subtle equilibrium between attractive and repulsive contributions, which nearly compensate each other in the case of Ne. The well depths estimated from the Buckingham model compare well with semi-empirical combination rules data and with the present DFT-D calculations. Finally, the signatures of larger heteroclusters containing up to three Rg atoms are observed and rationalized assuming a shift additivity rule as well as a cluster geometry independent upon the rare gas at least for the 1:2 complex.
Funding
11
Fig.1 EC-QCL jet cooled spectra of SF6/Rg/He mixtures diluted in 8 bar helium at an axial
distance z = 15 mm for the pin hole nozzle, after subtraction of the spectrum of SF6 monomer
recorded in the same conditions of dilution of the SF6/He mixture. The SF6/Rg/He mixtures
used are 0.12/1/100 for SF6-Rg with Rg = Ar, Kr, Xe and 0.18/18/100 for SF6-Ne. The // and
symbols correspond to parallel and perpendicular band contours of the 1:1 SF6-Rg
heterodimers, respectively. The bands marked by stars have been assigned to larger SF6
12
Fig. 2: EC-QCL jet cooled pin hole spectra of both 3 parallel bands of SF6-Rg heterodimers
(Rg=Ar, Kr, Xe) with 0.12 % SF6 and 1% Rg diluted in 8 bar helium at an axial distance z = 15 mm, compared to our best simulation. The rotational temperature used for these
13
Fig. 3: EC-QCL jet cooled pin hole spectra of both 3 perpendicular bands of SF6-Rg
heterodimers (Rg= Kr, Xe) with 0.12 % SF6 and 1% Rg diluted in 8 bar helium at an axial
distance z = 15 mm, compared to our best simulation. The rotational temperature used for these simulations is 0.7(1) K.
14
Fig. 4: Plot of the and terms for the complexes SF6-Rg and linear
correlation obtained, in agreement with the predictions based on a Buckingham-type intermolecular potential (see text and Eq. 7).
15
SF
6-Xe
SF
6-Kr
SF
6-Ar
Parallel band
A’’
/cm-1 0.0874(a) 0.0874(a) 0.0874(a)B’’
/cm-1 0.010382(6) 0.014158(17) 0.022765(45)A’
/cm-10.087261(35) 0.086956(59) 0.086804(85)
B’
/cm-1 0.010102(6) 0.013535(14) 0.020733(36)
0/cm-1 946.22327(18) 946.64108(30) 946.97950(48) /pm 456.17(13) 434.60(26) 420.82(42) /pm(d) 459.25(13) 439.38(28) 430.21(44)Perpendicular band
A’’
/cm-1 0.0874(a) 0.0874(a) 0.0874(a)B’’
/cm-1 0.010382(b) 0.014158(b) 0.022765(b)A’
/cm-1 0.08865(17) 0.10471(14)-B’
/cm-1 0.010395(7) 0.014296(13)-
0/cm-1 946.94171(37) 947.22478(39) 947.392 (c)
0.687(2) 0.663(2)(a) RI-DFT-D ab initio value of A”.
(b) Ground state B” constants for the perpendicular band analyses are fixed to the B”
values derived from the parallel band analyses.
(c) The
0 frequency for the perpendicular band of SF6-Ar corresponds to the maximum
of the RQ(J,0) branch.
(d)
The equilibrium Be ground state necessary to determine Re is derived from the
relation Be= B’’ + /2 where = B’’-B’ represents the vibration-rotation interaction
constant.
Table 1: Molecular parameters (rotational constants, band centers and S-Rg distances) for the ground and 3 parallel and perpendicular states of the van der Waals SF6-Rg heterodimers
(Rg= Ar, Kr, Xe) derived from the band contour analyses of EC-QCL jet-cooled pin hole spectra.
16 SF6-Rg SF6-Rg2 SF6-Rg3 // exp th 1 2 3 exp 1 2 red shifts (cm-1) Ne 0.12(a) Ar 0.585 1.000 0.723 0.448 1.284 1.494 1.755 1.511 - 2.313 Kr 0.802 1.339 0.981 0.570 1.736 2.045 2.365 2.049 2.657 - Xe 1.08 1.756 1.305 0.694 2.120 2.607 - relative red shifts Ar 0.809 1.383 1 1.776 2.067 2.427 2.090 -- 3.199 Kr 0.818 1.365 1 1.770 2.085 2.411 2.088 2.708 Xe 0.828 1.346 1 1.625 1.998 --
R (a)Estimate of the Q branch maximum from the subtraction spectrum of SF6-Ne (see Fig. 1)
Table 2: Experimental 3 red shifts (upper panel) observed for the parallel and perpendicular
bands of the SF6-Rg heterodimer and the three bands of the SF6-Rgn heteroclusters in the
series of EC-QCL jet-cooled pinhole spectra. For each rare gas, the experimental shifts exp
(calculated according to relation (1)), are compared to the theoretical shifts (th in italics)
derived from a pure induction model42 ; lower panel: relative red shifts after normalization by the experimental red shift (exp in bold), of the 1:1 complex, showing that the spectra of the
17 Experimental Re(S-Rg) distance Calc. (RI-DFT-D) Minimum C3v constrained Relative difference (%) Calc. vs. Exp. Combination rules (CR) Relative difference (%) CR vs. Exp Ne-Ne 309.1(a) Ar-Ar 375.7(a) 401 - + 6.7 Kr-Kr 401.1(a) 413.5 - + 3.1 Xe-Xe 436.6(a) 456.6 - + 4.6 SF6-Ne 426.0 420.9 390 - SF6-Ar 430.2 (b) 441.7 440.3 + 2.3 423 - 1.7 SF6-Kr 439.4 (b) 455.7 451.4 + 2.7 436 -0.8 SF6-Xe 459.2 (b) 475.8 471.6 + 2.7 454 - 1.1
(a) Interatomic distances (in pm) of rare gas dimers derived from the interatomic potential built by fitting
empirically experimental data (Aziz et al.)35-38
(b) Present data; see Table 1 for precision
Table 3: Comparison between experimental distances obtained from the present high resolution infrared jet-cooled study and theoretical SF6-Rg distances calculated from
RI-DFT-D ab initio method (B97D3/def2-TZVPPD) and from combination rules for intermolecular distances.
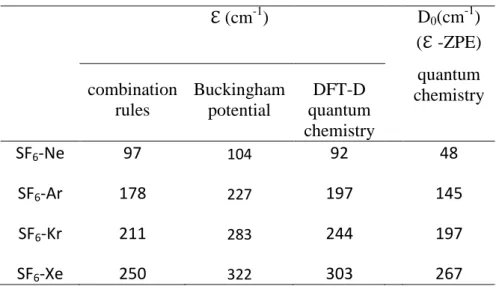
18 (cm-1 ) D0(cm-1) ( -ZPE) combination rules Buckingham potential DFT-D quantum chemistry quantum chemistry SF6-Ne 97 104 92 48 SF6-Ar 178 227 197 145 SF6-Kr 211 283 244 197 SF6-Xe 250 322 303 267
Table 4 : Well depths of the SF6-Rg dimers : Comparison between quantum chemistry
calculations (BSSE-corrected B97-D3/def2-TZVPPD level of theory), estimations from combination rules (obtained from the geometrical mean of the homodimer wells) and from the Buckingham potential (Formula (4) with parameters reported in Tables S2 and S3 of Supp. Material). The last column displays the dissociation energies D0 obtained by quantum
19
References
1
M. Rossi, W. Fang and A. Michaelides, J. Phys. Chem. Lett. 2015, 6, 4233. 2
J. S. Muenter, in ‘‘Atomic and Molecular Beam Methods’’ (G. Scoles, Ed.), Vol. 2. Oxford University Press, Oxford, 1995.
3
A. C. Legon, in ‘‘Atomic and Molecular Beam Methods’’ (G. Scoles, Ed.), Vol. 2. Oxford University Press, Oxford, 1995.
4
D.W.Pratt, Annu. Rev. Phys. Chem. 1998, 49, 481. 5
H.J. Neusser, R. Sussman, in Jet Spectroscopy and Molecular Dynamics, eds. J.M. Hollas, D. Phillips, Springer Media, New York 1995, 118.
6
B.J. Howard and A.S. Pine, Chern. Phys. Lett. 1985, 122, 1. 7
G. T. Fraser and A. S. Pine, J. Chem. Phys. 1986, 85, 2502. 8
D. T. Anderson, S. Davis and D. J. Nesbitt, J. Chem. Phys. 1997, 107, 1115. 9
Z. S. Huang, K. W. Jucks and R. E. Miller , J. Chem. Phys. 1986, 85, 6905. 10
R. W. Randall, M. A. Walsh, and B. J. Howard, Faraday Discuss. Chem. Soc. 1988, 85, 13. 11
G. T. Fraser, A. S. Pine, and R. D. Suenram, J. Chem. Phys. 1988, 88, 6157. 12
M. Iida, Y. Ohshima, and Y. Endo, J. Chem. Phys. 1993, 97, 357. 13
T. A. Hu, E. L. Chappell, and S. W. Sharpe, J. Chem. Phys. 1993, 89, 6162. 14
W. A. Herrebout, H-B Qian, H. Yamaguchi and B. J. Howard, J. Mol. Spectrosc. 1998, 189, 235. 15
G. D. Hayman, J. Hodge, B. J. Howard, J. S. Muenter, and T. R. Dyke, J. Chem. Phys. 1987, 86, 1670.
16
Y. Xu and M. C. L. Gerry, J. Mol. Spectrosc. 1995, 169, 181. 17
Z. Abusara, L. Bovayeh, N. Moazzen-Ahmadi, A. R. W. Mc Kellar, 2006, 125, 144306. 18
See https://wesfiles.wesleyan.edu/home/snovick/SN_webpage/vdw.pdf. 19
R. Lascola and D. J. Nesbitt, J. Chem. Phys. 1995, 95, 7917. 20
X. Liu and Y. Xu, J. Mol. Spectrosc. 2014, 301, 1. 21
G. T. Fraser, A. S. Pine and W. A. Kreiner, J. Chem. Phys. 1991, 94, 7061. 22
P. Asselin, Y. Belkhodja, A. Jabri, A. Potapov, J. Loreau and A. van der Avoird, Mol. Phys. DOI: 10.1080/00268976.2018.1471533 (2018).
23
G. M. Hansford and P. B. Davies, J. Chem. Phys. 1996, 104, 8292. 24
T. E. Gough, D.G. Knight and G. Scoles, Chem. Phys. Lett. 1983, 97, 155. 25
X.J. Gu, D. J. Levandier, B. Zhang, G. Scoles and D. Zhuang, J. Chem. Phys. 1990, 93, 4898. 26
R-D. Urban, L. G. Jörissen, Y. Matsumoto and M. Takami, J. Chem. Phys. 1995, 103, 3960. 27
M. Hartmann, R. E. Miller, J. P. Toennies and A. F. Vilesov, Science, 1996, 272, 1631. 28
P. Asselin, A. Potapov, A. C. Turner, V. Boudon, L. Bruel, M-A. Gaveau, M. Mons, Phys. Chem. Chem. Phys. 2017, 19, 17224.
29
P. Asselin, Y. Berger, T. R. Huet, R. Motiyenko, L. Margulès, R. J. Hendricks, M. R. Tarbutt, S. Tokunaga, B. Darquié, Phys. Chem. Chem. Phys. 2017, 19, 4576.
30
M. D. Brookes, C. Xia, J. A. Anstey, B. G. Fulsom, K.-X. Au Yong, J. M. King and A. R. W. McKellar, Spectrochim. Acta, Part A, 2004, 60, 3235.
31
D. R. Miller, in Atomic and Molecular Beam Methods, ed.G. Scoles, Oxford University Press, New-York, 1988, vol. 1.
32
Ch. J. Bordé, M. Ouhayoun, A. van Lerberghe, C. Salomon, S. Avrillier, C. D. Cantrell, and J. Bordé, Laser Spectroscopy 4, edited by H. Walther and K. W. Rothe ~Springer, New York, 1979. 33
S. Grimme, J. Comput. Chem. 2006, 27, 1787. 34
TURBOMOLE V6.4 2012, a development of University of Karlsruhe and Forschungszentrum Karlsruhe GmbH, 1989–2007, TURBOMOLE GmbH, since 2007; available from http://www.turbomole.com.
35
R. A. Aziz and M. J. Slaman, Chem. Phys. 1989, 130, 187. 36
R. A. Aziz, J. Chem. Phys. 1993, 99, 4518. 37
A. K. Dham, A. R. Allnatt, W. J. Meath, and R. A. Aziz, Mol. Phys. 1991, 67,1291. 38
20
39
H. A Lorentz, Ann. Physik 1881, 12, 127. 40
R,J. Good and C.J. Hope, J. Chem.. Phys. 1971, 55, 111. 41
R. A. Aziz, M. J. Slaman, W. L. Taylor et J. J. Hurly, J. Chem. Phys. 1991, 94, 1034. 42
D. Eichenauer and R. J . Le Roy, J. Chem. Phys. 1988, 88, 2898. 43
T. A. Beu, Y. Okada and K. Takeuchi, Eur. Phys. J. D. 1999, 6, 99. 44
A. J. Stone, ‘‘The Theory of Intermolecular Forces,’’ Clarendon Press, Oxford, 1996. 45