HAL Id: hal-00302646
https://hal.archives-ouvertes.fr/hal-00302646
Submitted on 12 Jul 2005
HAL is a multi-disciplinary open access
archive for the deposit and dissemination of
sci-entific research documents, whether they are
pub-lished or not. The documents may come from
teaching and research institutions in France or
abroad, or from public or private research centers.
L’archive ouverte pluridisciplinaire HAL, est
destinée au dépôt et à la diffusion de documents
scientifiques de niveau recherche, publiés ou non,
émanant des établissements d’enseignement et de
recherche français ou étrangers, des laboratoires
publics ou privés.
variability in global 3-D-modeling of the chemical
system of the upper mesosphere/mesopause region
G. R. Sonnemann, M. Grygalashvyly
To cite this version:
G. R. Sonnemann, M. Grygalashvyly. On the two-day oscillations and the day-to-day variability in
global 3-D-modeling of the chemical system of the upper mesosphere/mesopause region. Nonlinear
Processes in Geophysics, European Geosciences Union (EGU), 2005, 12 (5), pp.691-705. �hal-00302646�
SRef-ID: 1607-7946/npg/2005-12-691 European Geosciences Union
© 2005 Author(s). This work is licensed under a Creative Commons License.
Nonlinear Processes
in Geophysics
On the two-day oscillations and the day-to-day variability in global
3-D-modeling of the chemical system of the upper
mesosphere/mesopause region
G. R. Sonnemann and M. Grygalashvyly
Leibniz-Institute of Atmospheric Physics at the University Rostock in K¨uhlungsborn, D-18225 Ostseebad K¨uhlungsborn, Germany
Received: 23 February 2005 – Revised: 19 April 2005 – Accepted: 5 May 2005 – Published: 12 July 2005
Abstract. The integration of the photochemical system of
the upper mesosphere/mesopause region brought evidence that the system is able to respond in a nonlinear manner un-der certain conditions. Unun-der the action of the diurnally-periodic insolation, the system creates subharmonic oscil-lations or chaos if disregarding strong diffusion, and under special conditions it possesses multiple solutions. The mod-els used in the past were simplified and idealized in view of the number of dimensions and the consideration of the full dynamics. On the basis of our global 3-D-model of the dy-namics and chemistry of the middle atmosphere (COMMA-IAP), we also found a nonlinear response in the photochem-istry under realistic conditions. The model under consider-ation is not yet self-consistent, but the chemical model uses the dynamical fields calculated by the dynamic model. From our calculations we got period-2 oscillations of the photo-chemical system within confined latitudinal regions around the solstices but not during the equinoxes. The consequence of the period-2 oscillation of the chemical active minor con-stituents is that a marked two-day variation of the chemical heating rates is an important thermal pumping mechanism. We discuss these findings particularly in terms of the influ-ence of realistic dynamics on the creation of nonlinear ef-fects.
1 Introduction
As early as 1987 Sonnemann and Fichtelmann found that the photochemical system of the mesosphere represents a non-linear enforced chemical oscillator driven by the diurnally-periodic insolation. This system is able to produce chemi-cal resonances if the characteristic chemichemi-cal response time ranges in the order of 1 day. Precisely this is true in the mesopause region. It was shown in the joint paper by
Fichtel-Correspondence to: G. R. Sonnemann
mann and Sonnemann (1987) that this system is able to create subharmonic oscillations of period-2 and period-3 and chaos depending on the period of an artificial day of insolation. We call such phenomena nonlinear effects. The period of a sub-harmonic oscillation − in short subsub-harmonics − is a multi-ple of the fundamental period amounting to a day in the case of the chemistry of the earth atmosphere which is driven by the diurnally periodic solar insolation. In an ideal case for a period-n, every n days the same diurnal variations for all constituents repeat whereas the diurnal variations of the in-dividual days differ within this period of n days. For n→ a so-called deterministic chaos arises. As early as 1918 Duff-ing showed that such periodically driven nonlinear oscilla-tors were able to create cascades of subharmonic oscillations. There is a rather large body of publications dealing with this subject, and we refer here only to a standard work such as that of Thompson and Stewart (1991) describing its history and fundamentals or the excellent review by Feigin (2002) who summarized and analyzed the current state of the art regarding nonlinear processes in atmospheric photochemi-cal systems. Abarbanel (1995) treated the problem of the analysis of observed chaotic data comprehensively and thor-oughly. The same subject applied to the atmospheric chem-istry considering observed chaotic time series has also been explored by Feigin et al. (2001). Some theoretical investiga-tions and methodical problems of the nonlinear response of the tropospheric photochemical system have been examined, among others, in publications by Krol and Poppe (1998) and Poppe (1999).
The highly idealized system of Sonnemann and Fichtel-mann (1987), considering only the odd oxygen con-stituents O and O3 and the odd hydrogen species H,
OH and HO2 as variable compounds (phase variables),
was improved later on. The behavior of this dynami-cal zero-dimensional model was systematidynami-cally investigated using the water vapor concentration, the ratio of day-time to nightday-time hours (reflecting the season and/or lati-tude) and the air density (reflecting the geometric height)
as control parameters (Fichtelmann and Sonnemann, 1992; Sonnemann and Fichtelmann, 1997). Particularly the pa-per by Sonnemann and Fichtelmann (1997) investigated the behavior from point of view of chaos research. Yang and Brasseur (1994) showed that the photochemical system of the mesosphere possesses a trigger solution if taking into cal-culation fluxes from the thermosphere into the mesosphere. In the meantime the Russian group from Nizhny Novgorod further analyzed the nonlinear response of this system and derived the so-called essential model of the chemistry of the mesopause region (Konovalov et al., 1997; Feigin et al., 1998; Konovalov and Feigin, 2000; Feigin et al., 2001, Fei-gin, 2002). They found that the effect results in essence from an interplay between atomic oxygen and atomic hydrogen. The nonlinear behavior of the system was further investi-gated by Montecinos (1996); Johnson et al. (1998), Monte-cinos and Felmer (1999) and Scott et al. (2000). MonteMonte-cinos and Felmer (1999) found that the period-2 is a stable oscilla-tion of the photochemical system. They also reported about multiple solutions.
The control parameter “frequency of solar insolation” seems to be an unrealistic parameter for the earth’s atmo-sphere as the earth rotation period of 24 h is constant. How-ever, it was shown by Sonnemann (2001) that the zonal wind moving an air parcel around a parallel results in a Doppler shift of the period of solar insolation. Under real conditions the shift of the period amounts to between +4 and −7 h. On the basis of a simplified 1-D-model defined around a parallel and considering a changing zonal wind only, the system created subharmonics again when the zonal wind exceeded a critical velocity. This so-called photochem-ical Doppler effect has been studied in more detail on the basis of three-dimensional calculations by Sonnemann and Grygalashvyly (2003), but a nonlinear response was not ob-served.
Kulikov and Feigin (2004) investigated reaction-diffusion waves in the mesospheric photochemical system caused by horizontal eddy diffusion. It was shown that when the spec-trum of oscillation contains a marked second subharmonics, reaction-diffusion waves in the form of traveling fronts and pulses of the phase of two-day oscillations may be excited.
The influence of the turbulent diffusion on the nonlinear behavior was investigated by means of a one-dimensional model (Sonnemann and Feigin, 1999a and 1999b; Sonne-mann et al., 1999) using the diffusion coefficient as a control parameter. A very complicated system response has been found. Different subtle and catastrophic so-called space-bifurcations creating subharmonic and chaotic attractors oc-cur for a changing diffusion coefficient. The nonlinear re-sponse seems to be restricted to a certain height interval, but actually, the differences between the concentration am-plitudes for consecutive days becomes smaller the more dis-tant the height from this interval is. This behavior has been called the onion bifurcation. The most essential finding was, however, that strong diffusion suppresses the nonlinear re-sponse of the system. The critical values of the diffusion coefficient for the creation of a first subharmonic
oscilla-tion by a subtle bifurcaoscilla-tion, a period-2 oscillaoscilla-tion, ranges in the order of K≈2×105cm2s−1 comparable with real
re-lations at the lower and middle mesopause region. As fre-quently very small diffusion coefficients of the order of K≈n×104cm2s−1 have been derived, particularly around and below 80 km (e.g. L¨ubken 1997), the question arose whether a nonlinear response of the photochemical system can also occur under real conditions. In other words, in this paper we will not only contribute to the basic research in non-linear dynamics, but we will go a step toward a more realistic description of the complicated behavior of the chemistry in the mesopause region. We will search for conditions under which subhamonics either could really occur or, on the other hand, conditions under which an appearance cannot be ex-pected or rather it is very unlikely. We will also point out the shortcomings of the model under consideration and state what we have to improve in order to get reliable results.
2 Brief model description
For calculations we use our global three-dimensional model COMMA-IAP of the dynamics and chemistry of the middle atmosphere (0–150 km). The acronym stands for Cologne Model of the Middle Atmosphere of the Institute of Atmo-spheric Physics in K¨uhlungsborn. It was described in more detail e.g. in Berger (1994); Sonnemann et al. (1998); Kremp et al. (1999); Berger and von Zahn (1999); K¨orner and Son-nemann (2001); SonSon-nemann and K¨orner (2003), Hartogh et al. (2004). The model is designed to investigate particularly the extended mesopause region and the mesosphere. It con-siders all relevant species and chemical families. The reso-lution amounts to about 1.1 km in altitude, 5 (or 2.5) deg in latitude and 5.625 deg in longitude. For the following cal-culations we start with a time step of 900 s but change the variable time resolution to 1 min after 1 year of model time. At the same time we integrate O and O3no longer only as
family, but separately. The system then operates close to a flowing equilibrium but the change to the time-consuming integration represents a certain perturbation of the system so that the transients normally die away sufficiently only after about one or two weeks in that altitude. A flowing equilib-rium expresses the fact that the concentration of short-lived constituents closely follows the slowly changing system con-ditions such as solar insolation, temperature or the concentra-tion of long-lived source gases. It does not, of course, rep-resent a steady state. The chemical transport model uses the dynamical fields of the temperature, the wind components and the pressure from the dynamical model. It considers the advective transport and both the turbulent and molecular dif-fusion. The model calculates climatological means. It is un-able to create such phenomena as planetary waves or strato-spheric warmings. The model does not operate interactively. The chemical model uses the dynamical fields; yet the dy-namical model is not fed online with data from the chemical model.
The quality of the model used has been shown in various papers dealing with very different scientific subjects. Kremp et al. (1999) showed, in comparison with radar wind observa-tions, that the seasonal wind patterns are correctly calculated, and in the article by Berger and von Zahn (1999) even the two level mesopause was modeled correctly. A touchstone for the correctness of the important vertical wind is the cal-culation of the seasonal variation of the middle atmospheric water vapor concentration. K¨orner and Sonnemann (2001) and, using an improved model version, Sonnemann and Gry-galashvyly (2005) computed, among other things, the sea-sonal behavior of the water vapor concentration. Particularly the results in the second paper mirror the seasonal variation observed, and even such special phenomenon as the areas of the possible occurrence of noctilucent clouds (NLC) are sufficiently well calculated. In Hartogh et al. (2004) the so-called tertiary ozone maximum close to the polar night ter-minator was correctly reproduced.
As the diffusion possesses the ability to destroy nonlinear effects, the treatment of all diffusive processes is an impor-tant methodical problem. The turbulent or eddy diffusion coefficient reflects chaotic processes of the air (for exam-ple breaking of gravity waves) which cannot be resolved in the frame of the dynamic model. The eddy diffusion coeffi-cient is an external parameter for the model. There is a large uncertainty and lack of observations relating to the spatio-temporal behavior of the eddy diffusion coefficient in the mesopause region. Actually, it depends on height, latitude, season and local time. There are different estimations (e.g. Hocking 1990; L¨ubken 1997, etc.) and indirect hints (e.g. from meteor trail observations) on the magnitude of the dif-fusion coefficient showing a large scatter over two orders in magnitude in the mesopause region. For calculations we use our so-called standard eddy diffusion profile − an idealized model with a diffusion coefficient of K=2×105cm2s−1 at 80 km increasing to a maximum value of 5.1×105cm2s−1at 90 km. These values exceed even that value of the first cre-ation of a period-2 in case of the 1-D-model (Sonnemann and Feigin, 1999a).
In view of the creation of nonlinear effects in the photo-chemistry, we are interested in the consideration of relatively quiet conditions. However, very important is the suppression of the numerical diffusion due to the treatment of the ver-tical advection. The verver-tical numerical diffusion coefficient is given by Dnum=0.5∗(1z∗|w|−1t∗w2)(e.g. Smolarkiewicz
1984) with w-vertical velocity and 1z−height resolution and
1t−time resolution. The second term is very small, but the first term has an order of n×105cm2s−1and larger within
the mesopause region comparable with or even stronger than the eddy diffusion coefficient. Particularly the strong vertical tidal winds result in a marked numerical diffusion whereas the zonally (diurnally) averaged vertical winds are one order in magnitude smaller than the tidal winds and possess values of maximum few cm s−1.
The procedure of the so-called anti-numerical diffusion re-duces the uncertainties resulting from the advective transport scheme of a constituent marked by a certain concentration
gradient which tends to flatten this gradient (for an extended discussion see e.g. Prather 1986 or Walcek, 2000). There are different procedures of anti-numerical diffusion used (e.g. Smolarkiewicz, 1983; Prather, 1986; Bott, 1989; Bott, 1992) which reduced the diffusivity of the transport scheme but they did not suppress it sufficiently well, particularly under conditions of steep concentration gradients. In our opinion, this fact could be one of the main reasons that global models have not produced a nonlinear response thus far.
However, we cannot assess the models developed by other groups, as information about the numerical treatment is nor-mally outlined only very scanty and limited. Generally, the numerical diffusion works in addition to the turbulent diffu-sion so that an effective acting diffudiffu-sion coefficient can be defined as the sum of both parts. A large diffusivity influ-ences the distribution of the minor constituents such as water vapor just within the mesopause region. So the water vapor mixing ratio in the area of NLC at 83 km at high latitudes in summer calculated by employing the Smolarkiewicz scheme amounted to about 4 ppmb (K¨orner and Sonnemann, 2001).
Now, we have implemented a new advective transport scheme developed by Walcek and Aleksic (1998) and Wal-cek (2000) which is almost free (nearly zero) of numerical diffusion. The water vapor mixing ratio increased to about 6 ppmv after the change and now agrees very well with mea-surements by HALOE of the Upper Atmospheric Research Satellite (UARS) displaying all typical latitudinally-seasonal patterns (Sonnemann and Grygalashvyly, 2004; Sonnemann et al., 2004).
The water vapor concentration is, apart from the diffu-sion coefficient and the vertical wind, the most important control parameter for the consideration of nonlinear effects. The height region of possible nonlinear response was per-haps too dry in the older model versions to create nonlin-ear effects, but more likely the system was too diffusive and the time resolution too poor. The dissociation rate of wa-ter vapor occurs only combined with the wawa-ter vapor con-centration in the chemical code. It determines the hydrogen radical production term of the chemical scheme. The disso-ciation rate of water vapor is chiefly determined by the solar Lyman-α flux above about 75 km. Compared with the pa-per by K¨orner and Sonnemann (2001), the dissociation rates have been corrected according to the flux values given by Woods et al. (2000).
The new measurements by UARS increased the old flux values by about 55 %. For calculations here we use a
Lyman-αflux according to the year 2001 being close to solar max-imum conditions. The changes in the model - the smaller time step, the strong reduction of the numerical diffusion also entailing higher water vapor mixing ratios within the mesopause region and the increase of the water vapor dis-sociation rate – promote the creation of nonlinear effects.
3 Problems of the integration of 3-D-models
There were some hints of a nonlinear response of the complex global three-dimensional model in the past but they had not been considered in more detail thus far. A general drawback of three-dimensional models is connected with the family concept of the integration of the chemical code. Due to the extremely large computer time needed to integrate a very rigid system, an integration of all individual constituents separately is impossible. Their individual char-acteristic chemical times extend over many orders in magni-tude. Particularly, the odd hydrogen and odd oxygen species have, depending on height, extremely small characteristic times. Special attention must be paid to the times of sun-rise and sunset because the solar insolation changes greatly during a relatively short time period and the system comes out of its almost flowing equilibrium. However, within a chemical family the individual members will only be trans-formed into each other without changing their family concen-tration. The family concentration is conserved. An exam-ple for this assertion are the reactions H+O3→OH+O2 and
OH+O→H+O2with the net reaction O+O3→2O2. The odd
oxygen species are catalytically destroyed but the concentra-tion of the odd hydrogen constituents remains constant in this cycle. Hence, the characteristic family time (defined in Son-nemann and Fichtelmann, 1997) is essentially greater than those of the individual family members. Consequently, the families are subjected to transport. The characteristic fam-ily times of both the odd families ranges in the order of 1 day around 80 to 85 km whereas the individual characteris-tic chemical times possess minimum values in the order of seconds up to minutes. We also have to note that in case of a nonlinear response of the system, the response time of the entire system can be essentially greater than the family times if the system operates in the vicinity of a bifurcation point. This can create long-lasting transients of any subharmonics or chaos. A crucial problem is also the fact that the charac-teristic times drastically change from the lower to the upper model domain and between daytime and the night when no photodissociation acts.
In order to integrate the entire system within an accept-able computer time, in three-dimensional models the nec-essary integration time step is often in the order or even essentially larger than the characteristic times of the acting constituents. The integration concept used distinguishes be-tween such species which can be immediately put into a (flowing) equilibrium without having to be time-integrated and transported (e.g. O(1D) and other excited species or the plasma constituents within the D- or E-layer), species which have to be time-integrated, and such species which can be de-rived from the family concentration. The characteristic trans-port times range in the order of days or longer in the middle atmosphere (see also K¨orner and Sonnemann, 2001). The system considers such constituents which have to be time-integrated and transported (such as water vapor, methane, dinitrogen oxide, etc.) and the odd families (such as HOxor
NOx), which also have to be time-integrated and transported.
A serious problem, as mentioned above, consists in the partition of the family concentration into those of the in-dividual members. A necessary requirement is, of course, the conservation of the number of atoms. This is also a re-quest for all procedures of the anti-numerical diffusion. Un-der this condition the concentration of the individual mem-bers can be calculated on the basis of their current equilib-rium concentrations. This procedure loses its validity if a short-living constituent becomes a long-living constituent at a certain height, time of day, season or latitude. This is, for instance, the case for atomic oxygen and atomic hydrogen above the mesopause or for ozone in lower altitudes and dur-ing the night etc. Thus we integrate atomic oxygen and ozone separately but this line of action requires essentially to reduce the time step.
Under the condition that the concentrations of a con-stituent varies close to a flowing equilibrium, the integration time step can be essentially enlarged compared with the nec-essary time step for conditions far from a flowing equilib-rium. Particularly around sunset and sunrise, the dissocia-tion rates vary strongest with time and the chemical system is substantially disturbed. The chemical system runs behind the permanently changing radiation conditions. The charac-teristic time of this perturbation could also be defined by that time during which the dissociation rate changes (decreases or increases) by a factor of e=2718 related to the noon value. There is no step function for the diurnal variation of the dis-sociation rates in reality as used in the older investigations (e.g. Fichtelmann and Sonnemann, 1987, 1992 and Sonne-mann and FichtelSonne-mann, 1997) but, according to the real sun-rise and sunset, a more or less smoothed variation of their values depending on latitude, season and species. Conse-quently, we use dissociation rates according to solar zenith angles as far as 95◦in steps of 1 degree. The characteris-tic time ranges in the order of roughly an hour or larger and consequently, the integration time step should be noticeably below that time for the fastest constituents, which have to be time integrated. In order to be on the safe side, we use a time step of 1 min. A reduction to 15 s yielded virtually the same results and this was also true for an enlarged time step of 150 s. In contrast, in case of non-separated treatment of the odd oxygen constituents we used a time step from 450 s to 5400 s (see also K¨orner, 2002).
We are aware how difficult a trustworthy calculation of a nonlinear response on the basis of such large and complex system is. It was shown by means of the simplified mod-els that even a small change of the control parameters can result in a catastrophic or subtle bifurcation. A subharmon-ics of a certain period changes into another period or into chaos if the conditions are altered only a little. Then the in-tegration time step is rather relevant for the concrete system response. A strong restriction also results from the coarse space resolution particularly with regard to the height res-olution of the order of 1 km. The simplified models have vertical resolutions in the order of 100 m and sometimes be-low that. However, when considering diffusion, the period-2 oscillation is the most prominent subharmonics and the first
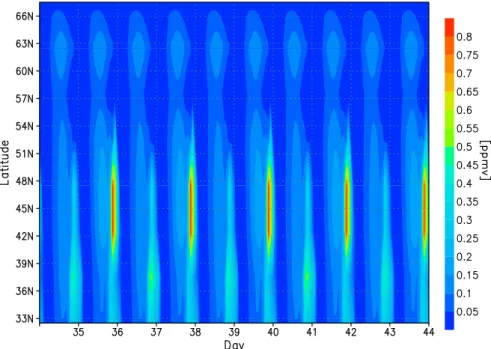
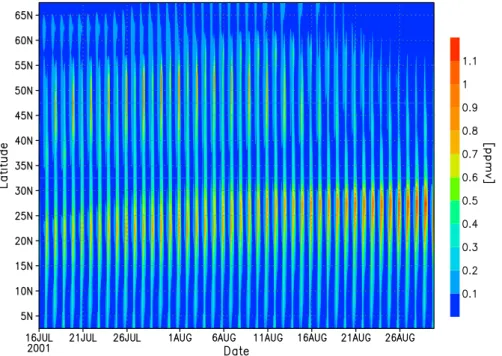
Fig. 1. Ozone mixing ratio of the Northern Hemisphere at 83 km altitude for a permanent 1st July showing a latitudinal region of period-2
oscillation between about 33◦N and 56◦N. The transients nearly died away.
nonlinear response of the system when it comes from a limit cycle of one day period and exceeds a critical control param-eter value. The bifurcation is, as mentioned, subtle in this case. The period-2 occupied the largest control parameter range (such as water vapor concentration, air density, length of the daytime, diffusion coefficient, etc.) from the entire range of nonlinear response. In other words, a period-2 vari-ation as usually results from the calculvari-ations is a very robust subharmonics.
A serious problem in view of observations also consists in the difficulty in deciding between chemically induced sub-harmonics or even chaos and dynamically imprinted varia-tions. Idealized models can calculate the system response under fixed conditions, such as a constant date and constant aeronomic conditions, varying only one control parameter separately. Under real conditions all parameters change per-manently and thus, we have to expect only episodes of a cer-tain system behavior (e.g. the occurrence of a cercer-tain subhar-monic oscillation within a limited space of time) within cer-tain geographic regions. We start the search for a nonlinear response of the chemical transport model with fixed dynam-ical and seasonal conditions according to a permanent fixed date. In this case the model runs until this date with a coarse time resolution (one year, in order to come close to a flowing equilibrium). After that we use the same diurnal variation of all dynamical parameters and dissociation rates according to this date. Then we integrate the system with these data for a long period using a small time step now and transport O and O3separately. In the second case − the so-called real case −we proceed in the same manner but after a given date we change only the time step and integration procedure but do not fix the seasonal conditions.
4 Results
Figure 1 shows a survey of calculations of the ozone mix-ing ratio of the Northern Hemisphere at 83 km altitude for a permanent 1st July after the transients died away (after 34 days). Then the system operates in an almost limit cycle mode. The tick numbers stand for the days left of the tick marks. We show the ozone mixing ratios being indicative for the other constituents because ozone is the best measurable constituent in the mesopause region. The figure clearly dis-plays a period-2 oscillation from about 33◦N to 56◦N. The
largest amplitude difference occurs around 46◦N. Around
37.5◦N a weak period-4 occurs. Only the fundamental
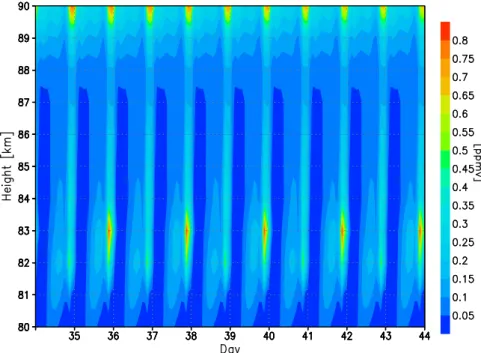
pe-riod has been found on the Southern Hemisphere up to the low northern latitudes. Figure 2 displays, according to the results depicted in Fig. 1, an altitude-time section at 42.5◦N of the same constituent. The figure makes clear that the two-day oscillation occurs approximately between 80 and 85 km with a maximum close to 83 km. Figure 3 displays the same state of affairs at 72.5◦N outside of the occurrence range of period-2 oscillation shown in Fig. 1. There is practically no period-2 at 83 km but a pronounced two-day oscillation be-tween 86 and 90 km with a maximum bebe-tween 88 and 89 km. A phase jump occurs between 87 and 88 km. Generally in our model, the height region of the nonlinear response in-creases with increasing latitude but strongest for the highest latitudes. The same calculation carried out for the equinoxes does not yield a strong indication of a period-2 oscillation anywhere.
The calculations carried out for the south summer season do not result in a simply mirrored behavior. This finding re-sults primarily from the dynamic model which is based on the
Fig. 2. Altitude-time section at 42.5◦N according to the results presented in Fig. 1. The figure demonstrates that the domain of nonlinear response is confined to between about 80 and 85 km.
Fig. 3. The same state of affairs as shown in Fig. 2 but at 72.5◦N. Now the region of nonlinear response occurs between 86 and 90 km whereas at 83 km no period-2 was found (compare with Fig. 1).
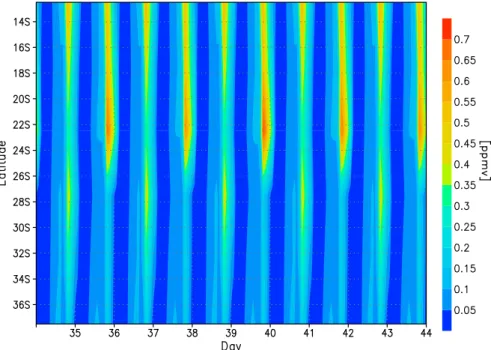
Berlin ozone climatology of the stratosphere (Pawson et al., 1998) being asymmetrical with respect to the hemispheres under comparable seasonal conditions and it is partly due to the eccentricity of the earth’s orbit. Figure 4 shows a cutout between 14◦and 36◦S of the ozone mixing ratio at 83 km for a permanent 22nd December. Now the effect occurs in the southern hemisphere in middle to low latitudes but also in middle to low latitudes of the Northern Hemisphere. The
po-sition of the regions of nonlinear response changes with the date. Period-2 oscillations occur during the entire summer season again. The figure displays clear period-2 oscillations, however, with a phase shift between about 25◦S and 26◦S.
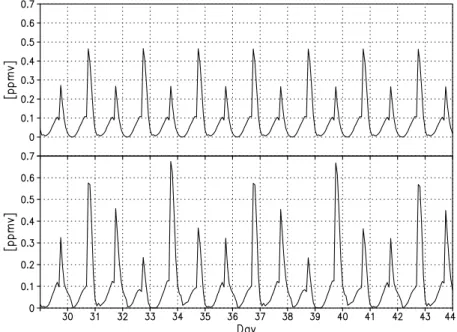
The period-2 is the preferred subharmonics, but as Fig. 5 demonstrates the next period doubling can also be created by the model. The figure shows the diurnal variations of ozone at 2.5◦N at 83 km height for a permanent 31st July after a
Fig. 4. A cutout between 14◦and 36◦S of the ozone mixing ratio at 83 km for a permanent 22nd December. There is a phase shift with
respect to the maximum between about 25◦S and 26◦S.
Fig. 5. Diurnal variations of ozone at 2.5◦N at 83 km height for a permanent 31st July after a long time of calculation showing a clear period-4 oscillation, which demonstrates the potential of the system to create a period doubling cascade.
long time of calculation. The system operates nearly in a limit cycle mode. In reality such amplitude differences are masked by the natural variability and one may observe an alternation between large and small amplitudes. Figure 6 shows an example at 83 km and 12.5◦N for a permanent 31st January. Now the representation starts instantly after the change of the solution procedure. Evidently, the system responds immediately with the creation of a transient
period-2 oscillation. After some periods a transient quasi period-6 occurs and that changes finally into a period-2 again approx-imating nearly a limit cycle.
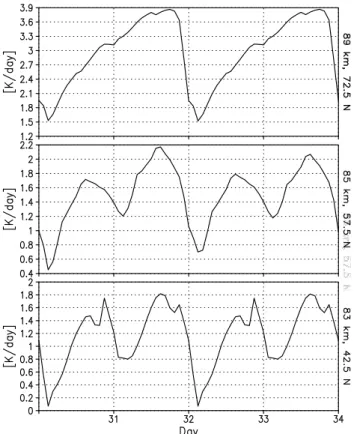
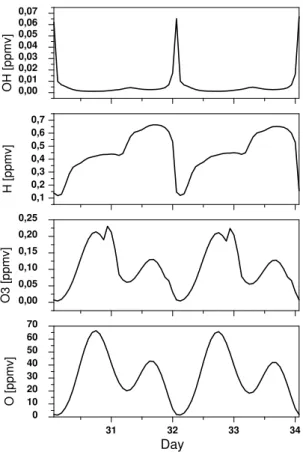
Figure 7 depicts the diurnal variations of the total chemical heating rates for 4 consecutive days at different altitudes and latitudes for the 1st July run. It is evident that the two-day os-cillation of the individual species is connected with a marked thermal two-day variation of the chemical heating. Figure 8
Fig. 6. Example of the occurrence of transient subharmonics at 83 km and 12.5◦N for a permanent 31st January. The figure shows results instantly after the change of the integration procedure. A transient period-2 changes into a transient period-6 and that returns to a period-2 again.
Fig. 7. Diurnal variations of the total chemical heating rate for 4 consecutive days for a permanent 1st July run at different altitudes and latitudes.
displays the diurnal variations of the 4 most important chem-ically active species for four consecutive days at 62.5◦N and at 84 km for a permanent 1st July. All constituents show clear two-day variations of their mixing ratio.
A trajectory describes the movement of a phase point within a sub-phase space and an attractor reflects the motion in case of a limit cycle. Attractors are indicative for the non-linear response of the system. Figure 9 displays an example of a quasi attractor for ozone versus atomic oxygen at 83 km height and 42.5◦N for a permanent 1st July. The data of calculations were stored every 1.5 h and therefore the curves appear to be very angular. In reality they are smoothed. Al-though the calculations based on a permanent date the figure do not represent an ideal limit cycle because the long-living constituents still change slowly during the time period con-sidered. Both the different diurnal variations can be clearly recognized as separate loops.
The results presented here clearly show that a so-called “two-day wave” in the chemistry of the mesopause region can occur under favorable conditions but that the two-day variation is not a general feature of the chemical dynamics. In order to use defined conditions, we integrated the system under the conditions of a continuously lasting date. In reality the conditions change slightly according to the running date. This concerns the slightly seasonally changing radiation con-ditions but it refers more to all influences connected with the changing dynamics. As in climatological mean the dynam-ical patterns does not normally drastdynam-ically change within a period of one or two weeks, we also expect under real condi-tions the creation of, at least, a transient period-2 oscillation in favorable locations. Figure 10 demonstrates this statement
31 32 33 34 0 10 20 30 40 50 60 70 Day O [ppmv] 0,00 0,05 0,10 0,15 0,20 0,25 O3 [ppmv] 0,1 0,2 0,3 0,4 0,5 0,6 0,7 H [ppmv] 0,00 0,01 0,02 0,03 0,04 0,05 0,06 0,07 OH [ppmv]
Fig. 8. Diurnal variations of the 4 most important chemically active
species (odd oxygen O, O3and odd hydrogen H, OH constituents)
for four consecutive days at 84 km and 62.5◦N for a permanent 1st
July.
for the north summer season. The figure shows a latitude-time section at 83 km between 16th July and 26th August. Between about 40◦N and 55◦N a period-2 occurs at this height, but the amplitude decreases considerably in August. Figure 11 displays the diurnal variations of ozone at 83 km and 2.5◦N under real conditions again. Next there is quasi
a period-2 which jumps into a period-4 and returns finally to a period-2 again. The amplitudes of the diurnal variations changes permanently.
The water vapor concentration is the most important chemical parameter. It was found that a atmosphere that is too dry (less than 1 ppmv) or too humid (larger than about 6 ppmv) does not create a period-2. Also the ratio of daytime to nighttime hours plays an important role. In the case studied by Sonnemann and Fichtelmann (1997), the period-2 ampli-tude difference amplified with increasing daytime hours af-ter a subtle start for about 2 daytime hours, but it decreased again after 14 daytime hours. The height range of nonlinear response is shifted upward if the water vapor concentration increases. That may be one reason why in high latitudes this range is located higher because the humidity also increases toward the summer pole. Another fact that has to be con-sidered is the increase of the level of constant air density in summer and the prolongation of the sunshine hours. In
0 20 40 60 80 0,0 0,2 0,4 0,6 0,8 O3 [ppmv] O [ppmv]
Fig. 9. Quasi O3-O attractor at 83 km height and 42.5◦N for a permanent 1st July.
the mesopause region the water vapor concentration acts in the chemical system, above all, via the product JH2O[H2O]
where JH2O stands for the dissociation rate of water vapor.
During the years of high solar activity JH2O is about 50%
larger than the minimum value at the mesopause. Although the water vapor concentration is reduced during this phase due to enhanced photolysis, this effect does not compensate the increased dissociation rate so that the product is larger than under mean conditions anyway (Sonnemann and Gry-galashvyly, 2004). A clear effect is the increase of the ozone concentration for decreasing solar activity due to the de-crease of hydrogen radicals formed destroying the odd oxy-gen constituents ozone and atomic oxyoxy-gen. Figure 12 shows a comparison of the diurnal variations of ozone at 83 km al-titude and 2.5◦N latitude between high (upper panel) and low solar activity (lower panel) after 30 days for a perma-nent 1st July. In case of high solar activity a period-2 is cre-ated, whereas for low solar activity a period-6 occurs - period doubling of a period-3. Fichtelmann and Sonnemann (1992) found that the period-3 is an inherent period of the chemical system, also indicating that the system has the potential to respond chaotically. In other regions of nonlinear response the period-2 oscillation is conserved but the amplitudes of the acting species changes according to the solar activity.
5 Discussion
5.1 Discussion of the model results
In zero-dimensional models, the height range of the nonlin-ear response amounts to only a few kilometers (2 or maxi-mum 3 km). Under the action of diffusion this range theo-retically extends to infinity but practically, when searching for a visible effect, only to about twice as long. An essential drawback of all three-dimensional models consists in their coarse height resolution. We use a relatively fine resolu-tion of 1.1 km. Thus, the chemistry responds in a detectable nonlinear manner only at four or maximum at six vertical
Fig. 10. Latitude-time section at 83 km between 16th July and 26th August calculated under real conditions. Between about 40◦N and 55◦N a period-2 occurs in this height but the amplitude decreases considerably in August.
Fig. 11. Diurnal variations of ozone at 83 km and 2.5◦N calculated under real conditions. There occurs a quasi period-2 oscillation in the first stage which jumps into a period-4 and returns finally to a period-2 again.
grid points. The nonlinear effects should be suppressed in all models which have a height resolution of about half a scale height. The characteristic transport time due to verti-cal wind is defined as that time needed to traverse the dis-tance of a scale height. The zonally averaged vertical winds in the domain of nonlinear response have an order of few cm s−1. An air parcel that moves upward or downward with a moderate constant speed of 1.736 cm s−1needs two days to
cross a distance of 3 km. The essentially stronger tidal winds result in an up-and-down motion of the air parcels by ap-proximately 1 km or a little more in high latitudes (Berger and von Zahn, 2002) but essentially more in low latitudes. The height gradient of the water vapor mixing ratio within the entire mesopause region is strong. This fact also entails, according to the vertical tidal motion, a considerable peri-odic diurnal and semi-diurnal variation of the water vapor
Fig. 12. Comparison of the diurnal variations of ozone at 83 km altitude and 2.5◦N latitude between high (upper panel) and low solar activity (lower panel) after 30 days for a permanent 1st July. In case of high solar activity a period-2 is created whereas for low solar activity a period-6 occurs.
Fig. 13. Snapshot of the diurnal variation of the vertical wind in m s−1around the parallels at 83 km altitude for the 1st July. (For a fixed universal time, the local time depends on the longitude.) Clearly recognizable are the patterns of the strong semi-diurnal tidal wind.
concentration in constant height, likewise acting as an en-forcing mechanism. The vertical wind transports air not sub-jected to a nonlinear response through the domain of non-linear response where the nonnon-linear response starts to influ-ence the chemistry within the air parcel. Figure 13 exhibits a snapshot of the diurnal variation of the vertical wind in m s−1 around the parallels at 83 km altitude for 1st July. Clearly recognizable are the strong semi-diurnal tidal wind patterns. Obviously, if considering the results of
calcula-tions, a moderate vertical wind does not prevent the creation of a period-2 oscillation, although additionally the eddy dif-fusion acts to destroy the nonlinear effect. But for stronger vertical winds (clearly larger than the speed to traverse the height interval of nonlinear response, say >2 cm s−1) the residence time of an air parcel within the domain of nonlin-ear response is too short to excite a subharmonic oscillation. Consequently, stronger vertical winds can destroy the non-linear response. We found the period-2 oscillation in regions
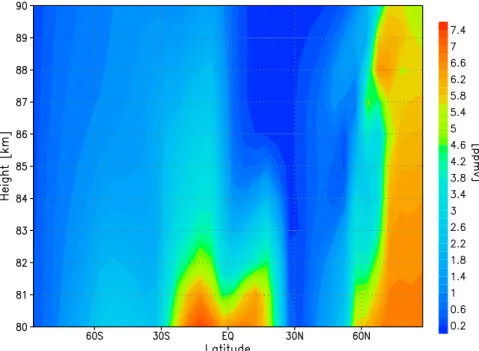
Fig. 14. Altitude-latitude section of the water vapor mixing ratio between 80 and 90 km for 1st July. The water vapor mixing ratio depends strongly on the direction and mean magnitude of the vertical wind.
of more moderate vertical winds. The calculations revealed neighboring regions marked by different behavior, but just as decisive is the transport of humid or dry air by the vertical winds from below or above. Figure 14 displays an altitude-latitude section of the water vapor mixing ratio between 80 and 90 km for 1st July again. The water vapor mixing ratio is small in those latitudinal regions of, on average, down-ward directed vertical winds as found around 30◦N, and vice versa, it is high around the equator according to strong up-ward winds there. Particularly in the polar day region largest water vapor mixing ratios have been observed. They result from a permanent upward flux of humid air within the sum-mery polar high pressure regime and from the autocatalytic water vapor formation under the action of strong solar inso-lation (Sonnemann et al., 2005).
The creation of subharmonic oscillations in the chemistry within the mesopause region could be a real effect in the at-mosphere under favorable conditions of relatively low turbu-lent diffusion (the 1-D-calculations by Sonnemann and Fei-gin (1999a) came to a value of <2×105cm2s−1), not too strong vertical wind (< about 2 cm s−1)and not too small
water vapor concentrations (in calculations by means of sim-plified models the mixing ratios had to be >1–2 ppmv) as those occur in the summer hemisphere. But within the re-gion of the polar mesospheric summer echoes and noctilu-cent clouds (PMSE-NLC region) in high latitudes in summer a freeze drying takes place just at that height where the two-day oscillation should occur. Under this condition the water vapor mixing ratio drops to few tenth of a ppmv (Berger and von Zahn, 2002, Rapp, 2003). The model calculations, us-ing simplified models, showed that these values are too small to create a subharmonics (e.g. Sonnemann and Fichtelmann,
1997; Feigin et al., 1998). Therefore, it is rather unlikely that the effect appears under the condition of freeze drying. The model used did not consider a micro-physical code of ice par-ticle genesis causing the freeze dry effect. Therefore, we also got clear period-2 oscillations within the PMSE-NLC region. 5.2 Discussion of observations
Although different hints to a subharmonic period in the mesosphere and mesopause region have been published, no direct evidence could be given for a chemically induced two-day oscillation thus far. Azeem et al. (2001) investigated mesospheric ozone and temperature data obtained by the Mi-crowave Limb Sounder (MLS) on board the UARS and found a 2-day wave in ozone most pronounced near 30 deg latitude in the southern summer hemisphere in late January. The re-sults seem to indicate that the two-day wave in the ozone is chemically driven in the mesosphere region via changes in reaction rates that are strongly temperature dependent. How-ever, the authors could not investigate the mesopause region, but only a region where a chemical two-day wave cannot be created.
The well-known phenomenon of the quasi two-day wave in the prevailing wind detected by Doyle in 1968 and later by M¨uller in 1972 is commonly interpreted in terms of dynam-ical processes. There is a large body of publication on this phenomenon. The same dynamical explanation is given for the two-day variation in the temperature as reported by Wu et al. (1993). The observation of a two-day variation in the oxygen green line volume emission rate by Ward et al. (1997) at a height where the characteristic time for O is too long to produce such an oscillation was interpreted by an excitation
from below. Surprisingly, the same feature with respect to the seasonal and latitudinal occurrence as found for the two-day wave in the prevailing wind have also been found for the period-2 subharmonics. The two-day wave of the pre-vailing wind is a typical summer effect, absent in winter and also nearly absent during the equinoxes. It is stronger in late summer than in early summer and strengthens with increas-ing solar activity. As is typical, the observed two-day wave in the prevailing wind within the mesopause is characterized by periods of transient quasi period-2 sometimes pulse-like oscillations and not of a permanent oscillation over the en-tire season. The oscillations usually remain reasonably sta-ble over a period of several days (e.g. Poole, 1990) up to a month.
The chemical two-day oscillation induces a two-day oscil-lation of the chemical heating rate. As Fig. 7 indicates, the pumping by chemical heating is a robust effect. The tem-perature amplitude of the chemical heating rate ranges in the order necessary to excite a certain two-day wave in the pre-vailing wind in the mesopause region but it is too small to explain the full effect which needs minimum an amplitude of 5 K day−1 (Forbes, 1982). In observations, maximum am-plitudes of the prevailing wind components are usually at-tained at heights between 80 and 95 km (e.g. Craig et al., 1980; Ward et al., 1996) which correspond to the occurrence height of the nonlinear response. However, the two-day vari-ations of the temperature or ozone have been already found at the lower mesosphere and not only in the mesopause re-gion (e.g. Wu et al., 1995; Azeem et al., 2001), but this could be caused by a different effect than that what creates the two-day wave in the mesopause region. The measurements of the prevailing wind indicates a maximum around 90 km altitude and only small values at 75 to 80 km (e.g. Harris, 1994; Palo and Avery, 1996; Thayaparan et al., 1997). Unfortunately, our model is not self-consistent thus far. Therefore, we can-not say whether the chemical heating essentially feeds back to the dynamics, also influencing the vertical transport above and below the region of nonlinear response. Such a transport could amplify the amplitude of the chemical heating rate due to a modulated transport of atomic oxygen (as found by Ward et al., 1997) carrying almost only the latent chemical heat. Actually relating to observations, it would be difficult to dis-tinguish between dynamically induced or chemically caused quasi two-day variation, e.g. of measured ozone, as long as the amplitude difference between alternating days is not very different, meaning not larger than would result from a tem-perature induced variation. As mentioned above, the model only calculates climatological averages, meaning it does not compute variations under real short-periodic changeable con-ditions as they are connected with stratospheric warmings or gravity and planetary wave activity. That is why a period-2 oscillation lasts over several weeks in the model and that no pulse-like periods occur.
The period of all the observed quasi two-day waves in the prevailing wind is not exactly 48 h but varies around that value by some hours, mostly somewhat larger than 48 h. Sur-prisingly, the order of the difference to 48 h agrees with the
shift of the period for two days resulting from the photo-chemical Doppler-effect due to the zonal wind (Sonnemann, 2001). The summer east wind system results in Doppler pe-riods larger than 48 h for two days.
There are different investigations concerning the periodic-ity of PMSE or NLC. A quasi 5-day variation of bright NLC has been found by Gadsden (1985). Merkel et al. (2003) confirmed this finding. In measurements of the polar meso-spheric clouds (PMC − being the NLC occurring in the po-lar region) by means of the Student Nitric Oxide Explorer (SNOE) satellite since 1998, the 5-day wave was observed in both the northern and southern hemisphere polar sum-mers. This variation was interpreted by Sugiyama (1994) and (1998) in terms of a limit cycle of the NLC genesis but Kirkwood et al. (2002) interpreted the 5-day wave as a plan-etary scale wave propagating from below. However, a two-day variation in the NLC occurrence rate has not been found. The occurrence of NLC depends sensitively on the tempera-ture. Rosenlof and Thomas, (1990) reported about a five-day variation of mesospheric ozone between 50 and 90 km. A five-day oscillation in chemistry was found under very ideal-ized conditions (Sonnemann and Feigin, 1999a) but it seems to be rather unlikely in realistic systems. It may be a vague hint at a higher subharmonics that Fig. 6 showed a transient period-6 but it is questionable whether or not such periods can also occur in the real atmosphere.
The chemistry in the highest summery latitudes is not sub-jected to any nonlinear effects in our model. We found still a two-day oscillation at 77.5◦N but not more at 82.5◦N. The
main reason certainly consists in the fact that there is no or only a very short night, meaning only a smoothed diurnal variation which could drive the chemical oscillator (Sonne-mann and Fichtel(Sonne-mann, 1997). The photochemical system has an unequivocal solution for all sets of constant dissoci-ation rates. As the system is a nonlinear radiatively driven chemical oscillator, it needs a radiative excitation by a clear day-to-night difference. In winter additionally, the water va-por concentrations are too small to create a period-2 oscilla-tion.
6 Summary and conclusions
The main goal of this paper was to demonstrate that the chemical system in the mesopause region is able to cre-ate subharmonic oscillations under nearly realistic condi-tions. The global 3-D-model of the dynamics and chem-istry produces these phenomena within the mesopause region and within certain latitudinal regions, particularly during the summer season under the condition of relatively weak ver-tical winds, not too strong turbulent diffusion, and not too small water vapor concentrations. The occurrence of tran-sient subharmonics after a sudden change of a system pa-rameter, such as turbulence, vertical wind velocity or hu-midity, seems to be possible. The two-day oscillation of the active chemical constituents entails a two-day variation of the chemical heating rate which feeds back to the dynamics. As
our model does not operate interactively, this response cannot be calculated by means of our present model version. There-fore, the development of a self-consistent model in which the chemical heating rate also feeds back to the dynamics is the first priority. Different measurements in the upper meso-sphere/mesopause region revealed a periodicity of quasi two days, however, there is no direct observational evidence thus far for a real chemical period-2 oscillation caused by the non-linearity of the photochemical system.
Acknowledgements. We have greatly appreciated the fruitful
cooperation of U. Berger in helping us to use the COMMA-IAP model. This work was supported by the Bundesministerium f¨ur Bildung und Forschung grant 01 LD 0038.
Edited by: H. Dijkstra Reviewed by: two referees
References
Abarbanel, H. D. I.: Analysis of observed chaotic data, Springer-Verlag, New York-Berlin-Heidelberg, 1995.
Azeem, S. M. I., Palo, S. E., Wu, D. L., and Fridevaux, L.: Obser-vations of the 2-day wave in UARS MLS temperature and ozone measurements, Geophys. Res. Lett., 28, 3147–3150, 2001 Berger, U.: Numerische Simulation klimatologischer Prozesse und
thermischer Gezeiten in der mittleren Atmosph¨are, Thesis, Univ. Cologne, Germany, 1994.
Berger, U. and von Zahn, U.: The two-level structure of the mesopause: A model study, J. Geophys. Res., 104, 22 083– 22 093, 1999.
Berger, U. and von Zahn, U.: Icy particles in the summer mesopause region: Three-dimensional modeling of their environment and two-dimensional modeling of their transport, J. Geophys. Res., 107, 1366, doi:10.1029/2001JA000316, 2002.
Bott, A.: A positive definite advection scheme obtained by nonlin-ear renormalization of the advective fluxes, Mon. Weath. Rev., 117, 1006–1015, 1989.
Bott, A.: Monotone flux limitation in the area preserving flux-form advection algorithm, Mon. Weath. Rev., 120, 2592–2602, 1992. Craig, R. L., Vincent, R. A., Fraser, G. J., and Smith, J. M.: The
quasi 2-day wave near 90 km altitude at Adelaide (35◦S), Nature,
287, 319–302, 1980.
Doyle, E. M.: Wind measurements in the upper atmosphere, Ph.D. thesis, University of Adelaide, Australia, 1968.
Duffing, G.: Erzwungene Schwingungen bei ver¨anderlicher Eigen-frequenz, Vieweg, Braunschweig, 1918.
Feigin, A. M.: Nonlinear dynamic models of atmospheric photo-chemical systems: Methods for construction and analysis (Re-view). Izvestiya RAS: Atmos. Ocean. Phys., 38, 513–554, 2002. Feigin, A. M., Konovalov, and Ya., I. B., Mol’kov, I.: Toward an un-derstanding of the nonlinear nature of atmospheric photochem-istry: essential dynamic model of the mesospheric photochemi-cal system, J. Geophys. Res., 103, 25 447–25 460, 1998. Feigin, A. M., Molkov, Ya. I., Mukhin, D. N., and Loskutov, E.
M.: Prognosis of qualitative behavior of a dynamic system by the observed chaotic time series, Radiophys. Quant. Elec., 44, 348–367, 2001.
Fichtelmann, B. and Sonnemann, G.: The strange attractor in the photochemistry of ozone in the mesopause region, Acta. Geod. Geophys. Mont. Hung., 22 (1–2), 313–319, 1987.
Fichtelmann, B. and Sonnemann, G.: Non-linear behaviour of the photochemistry of minor constituents in the mesosphere, Ann. Geophys., 10, 719–728, 1992.
Gadsden, M.: Observations of noctilucent clouds from North-West Europe, Ann. Geophys., 3, 119–126, 1985.
Forbes, J. M.: Atmospheric tides 1. model desciption and results for solar diurnal component, J. Geophys. Res., 87, 5222–5240, 1982.
HALOE: Halogen Occultation Experiment on board of the Up-per Atmosphere Research Satellite, data available on-line: http://haloedata.larc.nasa.gov/home.html
Harris, T. J.: A long-term study of the quasi-two-day wave in the middle atmosphere, J. Atmos. Terr. Phys., 36, 569–579, 1994. Hartogh, P., Jarchow, C., Sonnemann, G. R., and Grygalashvyly,
M.: On the spatiotemporal behavior of ozone within the meso-sphere/mesopause region under nearly polar night conditions, J. Geophys. Res., 109(D18303) doi:10.1029/2004JD004576), 2004.
Hocking, W. K.: Turbulence in the region 80–120 km, Adv. Space Res., 50 (22), 153–161, 1990.
Johnson, B. R., Scott, S. K., and Tinsley, M. R.: A reduced model for complex oscillatory responses in the mesosphere, J. Chem. Soc. Faraday Trans., 94, 2707–2715, 1998.
Kirkwood, S., Barabash, V., Br¨andstr¨om, B. U. E., Mostr¨om, A., Strebel, K., Mitchell, N., and Hocking, W.: Noctilucent clouds, PMSE and 5-day planetary waves: a case study, Geophys. Res. Lett., 29(10), doi:10.1029/2001GL014022, 2002.
Konovalov, I. B. and Feigin, A. M.: Towards an understanding of the nonlinear nature of atmospheric chemistry: origin of the complicated dynamic behavior of the mesospheric photochemi-cal system, Ann. Geophys., 7, 87–104, 2000.
Konovalov, I. B., Feigin, A. M., and Mukhina, A. Y.: Toward an understanding of the nonlinear nature of atmospheric pho-tochemistry: Multiple equilibrium states in the high-latitude lower stratospheric photochemical system, J. Geophys. Res., 104, 8669–8689, 1997.
K¨orner, U. and Sonnemann, G. R.: Global 3-D-modeling of wa-ter vapor concentration of the mesosphere/mesopause region and implications with respect to the NLC region, J. Geophys. Res., 106, 9639–9651, 2001.
K¨orner, U.: Global three-dimensional modelling of minor con-stituents in the middle atmosphere including hydrogen escape flux, Thesis, Univ. Rostock, Germany, 2002.
Kremp, Ch., Berger, U., Hoffmann, P., Keuer, D., and Sonnemann, G. R.: Seasonal variations of middle latitudes wind fields of the mesopause region − a comparison between observation and model calculation, Geophys. Res. Lett., 26, 1279–1289, 1999. Krol, M. C. and Poppe, D.: Nonlinear dynamics in the atmospheric
chemistry rate equations, J. Atmos. Chem., 29, 1–16, 1998. Kulikov, M. Yu. and Feigin, A. M.: Reaction-diffusion waves in
the mesospheric photochemical system, J. Adv. Space Res., ac-cepted, 2005.
Li, T. Y. and Yorke, J. A.: Period three implies chaos, Am. Math. Mon., 82, 985–992, 1975.
L¨ubken, F.-J.: Seasonal variation of turbulent energy dissipation rates at high latitudes as determined by in sit measurements of neutral density fluctuations, J. Geophys. Res., 102, 13 441– 13 456, 1997.
Merkel, A. W., Thomas, G. E., Palo, S. E., and Bailey, S.: Observations of 5-day planetary wave in PMC measurements from Student Nitric Oxide Explorer Satellite, Geophys. Res. Lett., 30(4), 1196, doi:10.1029/2002GL016524, 2003.
Montecinos, S. E.: Reaktionskinetische-photochemische Model-lierung der Ozonekonzentration der Mesosph¨are, Ph.D. thesis, Tech. Univ. Clausthal, Germany, 1996.
Montecinos, S. and Felmer, P.: Multiplicity and stability of solu-tions for a simple Chapman and a more complex mesospheric photochemical model, J. Geophys. Res., 104, 11 799–11 803, 1999.
M¨uller, H. G.: Long-period meteor wind oscillations, Phil. Trans. R. Soc., A271, 585–598, 1972.
Palo, S. E. and Avery, S. K.: Observation of the quasi-two-day wave in the middle and lower atmosphere over Christmas Island, J. Geophys. Res., 101, 12 833–12 846, 1996.
Pawson, S., Langematz, U., Radek, G., Schlese, U., and Strauch, S.: The Berlin Troposphere-Stratosphere-Mesosphere GCM: Sensi-tivity to physical parametrizations, Q. J. R. Meteorol. Soc., 124, 1343–1371, 1998.
Poole, L. M.: The characteristics of mesospheric two-day wave
as observed at Grahamstown (33.3◦S, 26.5◦N), J. Atmos. Terr.
Phys. 32, 259–268, 1990.
Poppe, D.: Time constant analysis of tropospheric gas-phase chem-istry, Phys. Chem. Chem. Phys., 1, 5417–5422, 1999.
Prather, M. J.: Numerical advection by conservation of second order moments, J. Geophys. Res., 91, 6671–6681, 1986.
Scott, S. K., Johnson, B. R., Taylor, A. F., and Tinsley, M. R.: Com-plex chemical reactions − A review, Chem. Engineer. Sci., 55, 209–215, 2000.
Rapp, M.: On the physics of polar mesospheric summer echoes, University lecturing qualification, ISSN 1615–8083, Univ. Ros-tock, Germany, 2004.
Rosenlof, K. H. and Thomas, R. J.: Five-day mesospheric waves observed in Solar Mesospheric Explorer ozone, J. Geophys. Res., 95, 895–899, 1990.
Smolarkiewicz, P. K.: A simple positive definite advection scheme with small implicit diffusion, Mon. Wea. Rev., 111, 479–486, 1983.
Smolarkiewicz, P. K.: A fully multidimensional positive definite ad-vection transport algorithm with small implicit diffusion, J. Com-put. Phys., 54, 325–362, 1984.
Sonnemann, G. R.: The photochemical effects of dynamically in-duced variations in solar insolation, J. Atmos. Sol. Terr. Phys., 63, 781–797, 2001.
Sonnemann, G. R. and Feigin, A. M.: Nonlinear behavior of a reaction-diffusion system of the photochemistry within the mesopause region, Phys. Rev. E, 59, 1719–1726, 1999a. Sonnemann, G. R. and Feigin, A. M.: Nonlinear response of the
up-per mesospheric photochemical system under action of diffusion, Adv. Space Res., 24, No. 5, 557–560, 1999b.
Sonnemann, G. and Fichtelmann, B.: Enforced oscillations and res-onances due to internal non-linear processes of photochemical system in the atmosphere, Acta. Geod. Geophys. Mont. Hung., 22 (1–2), 301–311, 1987.
Sonnemann, G. and Fichtelmann, B.: Subharmonics, cascades of period doublings, and chaotic behavior of photochemistry of the mesopause region, J. Geophys. Res., 102, 1193–1203, 1997. Sonnemann, G. R. and Grygalashvyly, M.: The zonal wind effect
on the photochemistry within the mesosphere/mesopause region, Adv. Space Res., 32, No. 5, 719–724, 2003.
Sonnemann, G. R. and Grygalashvyly, M.: Solar influence on meso-spheric water vapor with impact on NLCs, J. Atmos. Sol. Terr. Phys., 67, 177–190, 2005.
Sonnemann, G. R. and K¨orner, U.: The total hydrogen mixing ratio anomaly around the mesopause region, J. Geophys. Res., 108,
4692, doi:10.1029/2002JD003015, 2003.
Sonnemann, G., Kremp, Ch., Ebel, A., and Berger, U.: A three-dimensional dynamic model of minor constituents of the meso-sphere, Atmos. Environm., 32, 3157–3172, 1998.
Sonnemann, G. R., Feigin, A. M., and Mol’kov, Ya. I.: On the influ-ence of diffusion upon the nonlinear of the photochemistry of the mesopause region, J. Geophys. Res., 104, 30 591–30 603, 1999. Sonnemann, G. R., Grygalashvyly, M., and Berger, U.:
Autocat-alytic water vapor production as a source of high mixing ra-tios within the middle to upper mesosphere, J. Geophys. Res., in press, 2005.
Sugiyama, T.: Ion-recombination nucleation and growth of ice par-ticleas in noctilucent clouds, J. Geophys. Res., 99, 3915–3929, 1994.
Sugiyama, T.: Statistical study of noctilucent cloud occurrence in Westren Europe, Proceedings of the NIPR Symposium on Upper Atmosphere Physics, 11, 81 087, 1998.
Thayaparan, T., Hocking, W. K., MacDougall, J., Manson, A. H., and Meek, C. E.: Simultaneous observations of the 2-day wave
at London (43◦N, 81◦W) and Saskatoon (52◦N, 107◦W) near
91 km altitude during the two years of 1993 and 1994, Ann. Geo-phys., 15, 1324–1339, 1997,
SRef-ID: 1432-0576/ag/1997-15-1324.
Thompson, J. M. T. and Stewart, H. B.: Nonlinear dynamics and chaos, John Wiley, New York, 1991.
Walcek, R. P.: Minor flux adjustment near mixing ratio extremes for simplified yet highly accurate monotonic calculation of tracer advection, J. Geophys. Res., 105, 9335–9348, 2000.
Walcek, R. P. and Aleksic, N. M.: A simple but accurate mass con-servative, peak preserving, mixing ratio bounded advection al-gorithm with Fortran code, Atmos. Environm., 32, 3863–3880, 1998.
Ward, W. E., Wang, D. Y., Solheim, B. H., and Shepherd, G. G.: Observations of the two-day wave in WINDII data during Jan-uary, 1993, Geophys. Res. Lett., 23, 2923–2926, 1996.
Ward, W. E., Solheim, B. H., and Shepherd, G. G.: Two day wave induced variation in the oxygen green line volume emission rate: WINDII observations, Geophys. Res. Lett., 24, 1127–1130, 1997.
Ward, W. E., Oberheide, J., Riese, M., Preusse, P., and Ofermann, D.: Planetary Wave Two Signature in CRISTA 2 Ozone and Tem-perature Data, in: Atmospheric Science Across the Stratopause, Geophysical Monograph, 123, 319–325, 2000.
Woods, T. N., Tobiska, W. K., Rottman, G. J., and Worden, J. R.: Improved solar Lyman i irradiance modeling from 1947 through 1999 based on UARS observations,J. Geophys. Res., 105, 27 195–27 215, 2000.
Wu, D. L., Hays, P. B., Skinner, W. R., Marshal, A. R., Burrage, M. D., Liebermann, R. S., and Ortland, D. A.: Observations of the quasi 2-day wave from the high resolution Doppler imager on UARS, Geophys. Res. Lett., 20, 2853–2856, 1993.
Wu, D. L., Fishbein, E. F., Read, W. G., and Waters, J. W.: Ex-citation and evolution of the quasi -2-day wave observed in UARS/MLS temperature mesurements, J. Atmos. Sci., 53, 728– 738, 1996.
Yang, P. and Brasseur, G.: Dynamics of the oxygen-hydrogen sys-tem in the mesosphere, 1. Photochemical equilibria and catastro-phe, J. Geophys. Res., 99, 20 955–20 965, 1994.