HAL Id: hal-00144530
https://hal.archives-ouvertes.fr/hal-00144530
Submitted on 3 May 2007HAL is a multi-disciplinary open access
archive for the deposit and dissemination of sci-entific research documents, whether they are pub-lished or not. The documents may come from
L’archive ouverte pluridisciplinaire HAL, est destinée au dépôt et à la diffusion de documents scientifiques de niveau recherche, publiés ou non, émanant des établissements d’enseignement et de
Numerical generation and study of synthetic bainitic
microstructures
Nikolay Osipov, Anne-Françoise Gourgues-Lorenzon, Georges Cailletaud,
Olivier Diard, Bernard Marini
To cite this version:
Nikolay Osipov, Anne-Françoise Gourgues-Lorenzon, Georges Cailletaud, Olivier Diard, Bernard Marini. Numerical generation and study of synthetic bainitic microstructures. Matériaux 2006, 2006, Dijon, France. 12 p. �hal-00144530�
Numerical generation and study of synthetic
bainitic microstructures
N. Osipov
a, A.-F. Gourgues-Lorenzon
a, G. Cailletaud
a,
O. Diard
b, B. Marini
caCentre des Matriaux Mines Paris, Paristech CNRS UMR 7633, // BP 87, 91003
Evry Cedex, France
bDivision R&D, EDF Centre des Renardi`eres, ´Electricit´e de France, 77818 Moret
sur Loing, France
cCEA/SRMA, bˆatiment 455, 91191 Gif-sur-Yvette Cedex, France
Abstract
Models classically used to describe the probability of brittle fracture in nuclear power plants are written on the macroscopic scale. Its is not easy to surely capture the physical phenomena in such a type of approach, so that the application of the models far from their identification domain (temperature history, loading path) may become questionable. To improve the quality of the prediction of resistance and life time, microstructural information, describing the heterogeneous character of the material and its deformation mechanisms has to be taken into consideration. This paper is devoted to 16MND5 bainitic steel. Bainitic packets grow in former austenitic grains, and are not randomly oriented. Knowing the macroscopic stress is thus not sufficient to describe the stress–strain state in ferrite. An accurate model must take into account the actual microstructure, in order to provide realistic local stress and strain fields, to be used as inputs of a new class of cleavage models based on the local behavior. The paper shows the first two steps of the study: mesh generation and finite element computations using crystal plasticity.
Key words: Crystal plasticity, 16MND5 steel, bainite, finite element
1 Introduction
A lot of studies have been made on the 16MND5 (A508) steel used for nuclear reactor pressure vessels [Mathieu et al. (2006b)]. The so called local approach has been applied for predicting the brittle and ductile failure of this material, and the transition between different damage mechanismes [Mudry (1987)].
Even if this approach yields good results, it may appear a little limited for large time extrapolations needed to extend the life of the power plants. A new class of models, based on the local behaviour at a microscale, has been proposed recently and requires new improvement [Mathieu et al. (2006a)]. The present study is a contribution to this new modeling type, by providing numerical tools able to describe the actual microstructure and to perform finite element computations using crystal plasticity to predict local stress and strain fields. The paper consists then of the following sections:
• generation of microstructures of a ”bainitic” type; this is obtained in two stages, the first one allows us to obtain an austenitic microstructure by construction of Voronoi polyhedra, the second one consists in cutting the austenitic grains into a certain number of ferritic variants;
• assignment of the crystal orientation on the various grains, trying to re-spect the macroscopic texture and the local crystallographic relations. This includes a quantitative analysis of the obtained results from both a geomet-rical and a crystallographic point of view and their comparison with results of experimental observations;
• description of constitutive equations for crystal plasticity;
• calculation of multi-crystalline aggregates under monotonous loading by a Finite Element Method, allowing to highlight the critical zones and to discuss their presence according to local geometry and crystallography and the misorientation of involved phases.
2 Analysis of a 16MND5 reference microstructure
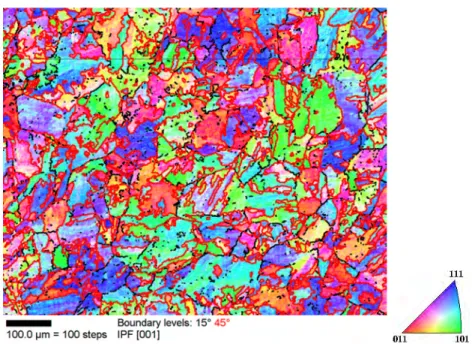
Figure 1 shows the Inverse Pole Figure of a typical microstructure of a 16MND5 bainitic steel. This figure was obtained by electron backscatter diffraction (EBSD) at CEA. The former austenitic grain size is about 30– 40µm. Groups of ferritic laths also called sheaves [Bhadeshia (2001)] (con-toured by red lines) as well as fine cementite and retained austenite phase can be observed so that the microstructure looks very complex. The plots shown in Fig.2 provide a first analysis of the size and shape of bainitic packets. As seen in Fig.2 (a), the investigated microstructure contains a large number of small grains with a size of about 10 µm2. Two peaks near to 0 and 1 in Fig.2 (b) show that the microstructure includes a large number of elongated as well as circular grains. The filtering procedure tells that these types of grain have a very small size (a few pixels): they are probably the result of indexing errors made in EBSD measurements. They will not be considered in the rest of the paper, since a filter is applied to suppress grains smaller than 10 pixels.
Fig. 1. Inverse Pole Figure of a 16MND5 microstructure 0 0.1 0.2 0.3 0.4 0.5 0.6 0.7 0.8 10 100 1000 Number Fraction
Area [square micrometers] 16MND5 microstructure 0 0.005 0.01 0.015 0.02 0.025 0.03 0.035 0.04 0 0.1 0.2 0.3 0.4 0.5 0.6 0.7 0.8 0.9 1 Number Fraction Aspect Ratio 16MND5 microstructure 16MND5 microstructure smoothed (a) (b)
Fig. 2. Bainite packet size and shape analysis: (a) - area (square micrometers) ; (b) - aspect ratio
3 Numerical generation of synthetic bainitic microstructure
3.1 Generation of mesh of the former austenite grains
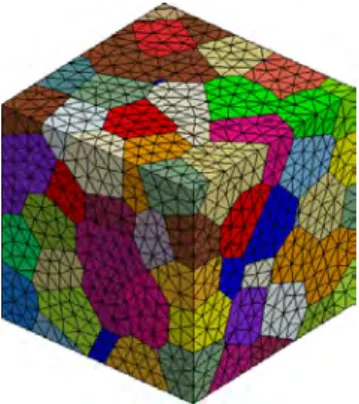
Bainite is the result of a phase transformation starting from an austenitic microstructure. This parent microstructure is modeled by an aggregate gen-erated by means of a Voronoi polyhedral decomposition as shown in Fig.3. An assumption has been made that, due to the heat treatment applied to the material, there is neither crystal no morphological texture in the austenitic phase [Tanguy (2001)]. The crystallographic orientations of austenite grains are then given by a random distribution. The mesh generation introduces tetrahedra [Laug and Borouchaki (2003),George (1997)], so that the grain boundaries are respected.
Fig. 3. Aggregate representing a former austenitic phase by 120 Voronoi cells and free mesh. Each color corresponds to one crystallographic orientation
3.2 Generation of the bainitic packets
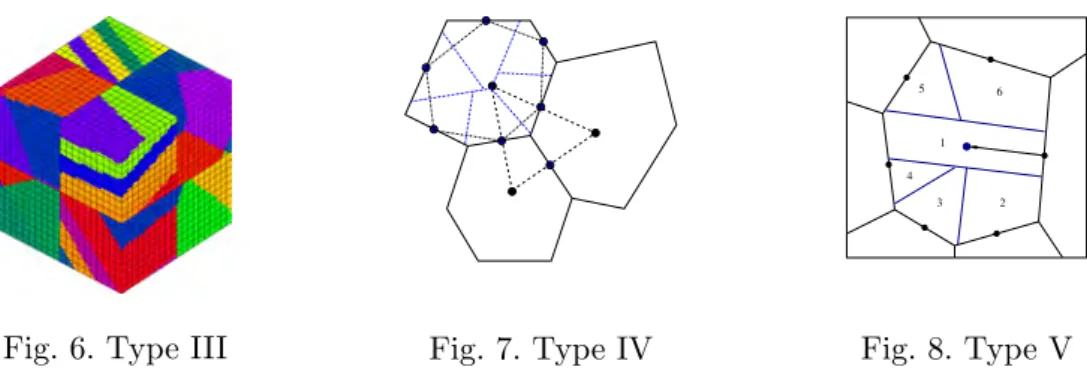
In this study only of only bainitic ferrite is considered for modeling, hence secondary phases such as cementite and residual austenite are not taken into account. The process of definition of bainitic packets is still controversial. Us-ing of sophisticated methods of analysis such as EBSD gives possibility for a better understanding of the morphology and crystallography of the microstruc-ture. Using these observations, several cutting processes have been defined to generate the bainitic packets. Five cutting methods are presented here. They are illustrated in Fig.4–8. As shown in Fig.4, a type I consists in the definition of a given number of packets as parallel slices of the parent grain which are cutted in the given direction. In type II, a volume decomposition (Fig.5) allows various sub-domains to be considered. Type III (Fig.6) is a combination of the first and second types of cutting which change from one grain to the another in the random manner. Analysis of the interrupted tests let suggest that bainitic packets frequently originate from the parent grain boundaries. In this idea is used in the type IV (Fig.7) where the grains are decomposed into subgrains using a Voronoi tessellation with the subgrains nuclei situated in the middle of the grain boundary. As the size of the cleavage fasets is close to the parent austenite grain size, it can be suggested that at least one packet per austenite grain was able to grow freely from one grain boundary to another. This was simulated by type V of cutting (Fig.8). After selection of one particular variant which will expand freely and go through the grain other variants can start to grow from the nuclei situated in the middle of the grain boundary with the equal rates and consequently will fill the retained volume of grain dividing it on subgrains following Voronoi tesselation. For all cases, the procedure is introduced as a mesh update in the framework of the ZSeT/ZeBuLoN code. Starting from an aggregate formed of a series of grains, a new aggregate is obtained. The following parameters can be controlled:
• direction of cutting, • type of cutting (I to V),
• crystal orientations of former austenitic grains,
• orientation relationships between parent austenite and ferrite (Kurdjumov-Sachs(KS) or Nishiyama-Wassermann(NW)).
(a) (b)
Fig. 4. Type I of cutting, direction of cut-ting is (a) non-rotated, (b) rotated with respect to the global axes
(a) (b)
Fig. 5. Type II of cutting, direction of cutting is (a) non-rotated, (b) rotated with respect to the global axes
Fig. 6. Type III Fig. 7. Type IV
5 1 2 3 4 6 Fig. 8. Type V
The current version of the mesher works with aggregates where grains are described by a group of integration points. In order to avoid generation of microstructures composed of laths or without laths at all, types I and II have not been used in their pure definition. The mixture of these two types of cutting was taken as a first example (type III). Types IV and V were also tested. Examples of application of these procedures to the whole austenitic microstructure are shown in Fig.9. A careful observation of the generated microstructures shows that type 5 gives a better result than the other types. The quantitative analysis of the size and shape of the bainitic packets has been made. The area and aspect ratio of the domains were first considered as critical parameters. The result, shown in Fig.10 (a) and (b), demonstrates that the agreement is rather good.
3.3 Bainite packet crystallography
The Kurdjumov-Sachs(KS) or Nishiyama-Wassermann(NW) orientation rela-tionships generally applied to calculate the relative orientations between the
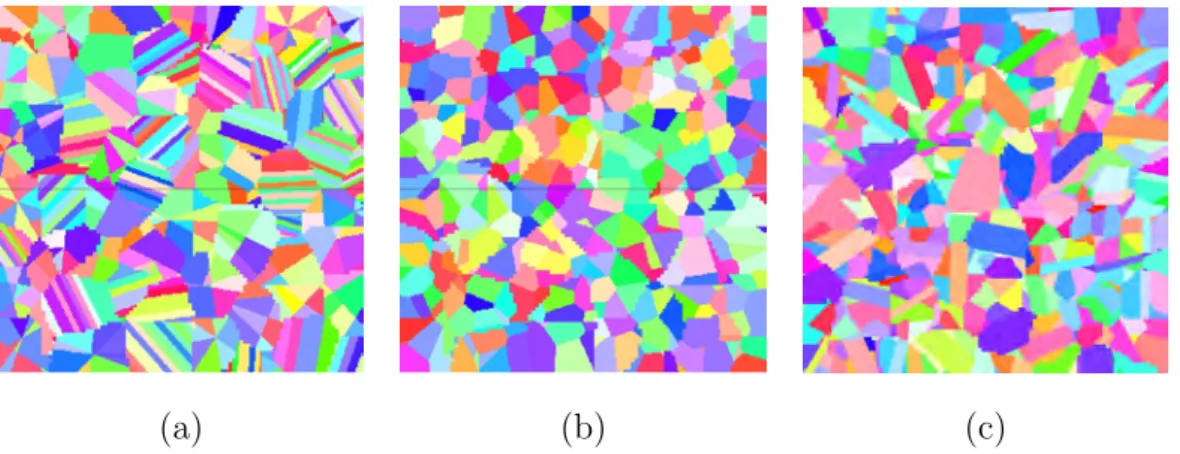
(a) (b) (c)
Fig. 9. Inverse Pole Figure of the microstructures generated using different types of cutting (a) type III; (b) type IV; (c) type V. The same color key as in Fig. 1
packets and a former austenite in the case of bainitic 16MND5 steel. In the present study, relations of type Nishiyama-Wassermann(NW) have been used for this purpose. The orientation for each packet in the parent grain is ran-domly selected among 12 possible variants, which gives an equiprobable pos-sibility of appearing for each variant. The resulting misorientation between two adjacent domains is shown in Fig.10 (c). It is compared with the real one, coming from the EBSD analysis of the image of Fig.1. In the next version of our code, a more sophisticated selection of auto-accommodating variants [Lambert-Perlade et al. (2004)] will be implemented to obtain a more realistic curve of the misorientation angle.
0 0.05 0.1 0.15 0.2 0.25 0.3 0.35 10 100 1000 Number Fraction Area 16MND5 microstructure (cleaned) type 3 type 4 type 5 0 0.005 0.01 0.015 0.02 0.025 0.03 0 0.1 0.2 0.3 0.4 0.5 0.6 0.7 0.8 0.9 1 Number Fraction Aspect Ratio 16MND5 microstructure (cleaned) type 3 type 4 type 5 0 0.05 0.1 0.15 0.2 0.25 0.3 0 10 20 30 40 50 60 70 Number Fraction Angle 16MND5 microstructure synthetic microstructure (a) (b) (c)
Fig. 10. Comparison between real 16MND5 and synthetic microstructures: (a) grain area distribution; (b) grain aspect ratio distribution; (c) misorientation angle
In Fig.10 (c) (blue line), it can be seen that relative orientations distribution of neighbouring grains present a typical slope with a lot of grains having the max-imum misorientation for the cubic microstructure (about 60◦). The angles in the range 0 − 15◦ correspond to the misorientation between the laths of ferrite within the bainitic packet whereas the angles from 40◦ to 62◦ correspond to the misorientation between the bainitic packets in the different grains. Peaks on the curve corresponding to the synthetic microstructure (red line) confirm the theoretical result that in microstructure where the crystallographic relations of only NW type are presented and chosen randomly between 12 variants, only 5 possible misorientations between the bainitic packets can appear in the
same grain. The backgroung curve between the peaks perfectly corresponds to the typical curve of misorientations of grains with a cubic lattice and random angle distribution between grains [Shtremel (1997)].
4 Uniaxial tensile test
Objective of the numerical simulations of a uniaxial tension test is to show the influence of microstructure on the global and the local results. The main points of interest are the morphology of the bainitic zones, which is far from being isotropic due to ferritic laths, and misorienation relationships between variants.
4.1 FE model
Two tests have been performed with two aggregates, the first one having large grains as in the austenitic phase, the second one being a bainitic mi-crostructure. To avoid mesh sensitivity, the mesh sizes are quite similar, with about 700000 10-node tetrahedral elements (with a quadratic integration), that makes about 1 million of nodes. Both aggregates are composed of 120 grains (Fig. 11). For bainitic microstructures (Fig. 11 (b)), each of these grains have been divided into several subgrains, using a type V of cutting which pro-duces about 1200 bainitic packets in the whole microstructure.
(a) (b)
Fig. 11. Synthetic microstructures used in computations: (a) austenitic phase; (b) bainitic phase
4.2 Boundary conditions
Mixed boundary conditions are applied, in order to simulate a one dimensional tensile test:
• axial displacements imposed on the top and bottom faces in such a way as to produce an average axial strain of 10 %;
• the four lateral faces are left free of charge;
• two points on the bottom face are fixed in order to avoid rigid body motion.
4.3 Material model
The single crystal model used here was proposed in Cailletaud (1992). After its initial implementation [M´eric et al. (1991)] in the Finite Element code ZSeT/Z´eBuLoN, it has been used in a series of computations, for industrial applications, like turbine blades [Cailletaud et al. (2001)], or polycrystalline aggregates [Barbe et al. (2001); Diard et al. (2005)].
The model used is briefly recalled here using the finite strain formalism. Man-del’s isocline configuration [Mandel (1973)] is introduced, together with a mul-tiplicative decomposition of the strain gradient:
F∼ = F∼eF∼p (1) The elastic strain is expressed as:
E∼e = 1 2(C∼ e− I ∼) (2) with C∼e = F∼eTF∼e (3) The elasticity relations allows us to compute S∼, the second Piola-Kirchhoff stress, and T∼, the Mandel stress, which will be used to compute the resolved shear stress (eq. 6) :
S∼= L∼ ∼ : E∼ (4) T∼ = 1 JF∼ e S∼F∼eT (5) τs = T∼ : N∼s = (C∼e· S∼) : N∼s0 (6) The plastic part is computed as a sum over all active slip systems:
L∼p = ˙F∼pFp
∼
−1
=X˙γsN∼s0 (7)
where N∼s0 – tensor that describing the slip system geometry. Superscript ’0’ means the relaxed configuration. It is obtained from the initial orientations of
the slip direction ls and of the normal to the slip plane ns:
N∼s0 = ls0⊗ ns0 (8) The following transformation is to be used for getting the actual position in the current configuration:
ls= F∼e· ls0 ns = Fe
∼
−T · ns0 (9)
The slip rate for slip system s, ˙γs is defined by a power law, as a function of the resolved shear stress, τs.
˙γs = * |τs− xs| − rs K +n sign(τs− xs) (10)
Isotropic and kinematic hardening (in a classical Ishlinsky-Prager’s manner) are taken into account by means of the internal variables rs and xs (eq. 11). In order to represent the effect of latent hardening, the resulting isotropic hard-enings for different slip systems are interconnected by means of an interaction matrix hsr. xs = c αs ; rs = R0+ bQ X r hsrqr = R0+ QX r hsrn1 − e−bvro (11) ˙γs = ˙vssign (τs− xs) (12) ˙ αs = ˙γs− d αs˙vs with αs(t = 0) = 0 ; q˙s = (1 − b qs) ˙vs (13) In the present study the area of interest does not exceed a few per cent of deformation, so that the computations will be made with a small strain as-sumption.
4.4 Identification of model parameters
Parameters of the crystalline constitutive model have been identified from experimental data previously obtained at EDF. An isotropic distribution of grains orientations is chosen. Two slip families have been introduced in the model in order to take into account the BCC structure of the material (family < 110 > {111} and family < 112 > {111}). For each of the two slip families, a set of material coefficients characterizes the initial critical resolved shear stress (Rbcc110
0 , Rbcc1120 ), the hardening (Q,b) and the viscosity (n,K). Self hardening and latent hardening due to interactions of slip systems are introduced by the matrices hbcc110
sr and hbcc112sr . Due to the lack of experimental information (monotonic tensile tests only), the kinematic hardening has been set to zero. Only isotropic hardening is present; on the other hand, this hardening is sup-posed to be the same for each slip system family. The value of the material parameters are presented in table 1.
4.5 Results
Figure 12 shows the global curve on the aggregate, that is obtained by taking the volume average of the axial stress and of the axial strain over the aggre-gate. It turns out that stress level is higher in the bainitic microstructure. The materials present an important hardening. In order to check the effect of the microstructure change, two computations are made, on the bainitic mi-crostructure and on the parent austenitic mimi-crostructure. In both cases the material parameters are taken from table 1, so that the ”austenitic microstruc-ture” curve does not refer to a tension on the same material in its austenitic phase : it just gives an evaluation of the additional hardening that comes from the presence of subgrains in the microstructure. Since there is no size effect in the model, this is purely due to the level of internal stresses, which are larger in bainite due to the distribution of grain orientation. Additional computations are also needed to quantify the influence of the mesh size on the results.
350 400 450 500 550 600 650 700 750 800 850 900 0 0.01 0.02 0.03 0.04 0.05 0.06 0.07 0.08 0.09 0.1 0.11 sig22 (MPa) eto22 (mm/mm) austenitic microstructure bainitic microstructure
Fig. 12. Tensile test. Stress–strain curve in direction 22
This fact is confirmed by Fig.13, which shows the contour maps of the von Mises stress for two aggregates at the end of the test (10% deformation). On this figure, black lines highlight the grain boundaries (boundaries of the parent phase for bainitic microstructure). The results differ significantly from one test to another, especially in the areas next to the grain boundaries and triple points:
• in the case of austenitic microstructure, the most important stress concen-trations are found at grain boundaries, whereas in bainitic microstructure
y1111 y1122 y1212 K n Rbcc1120 Rbcc1100 Q b 219540.0 78125.0 70700.0 15.0 12.0 238.0 203.0 307.0 3.63
h1 h2 h3 h4 h5 h6
bcc112 1.0 1.0 0.83 0.83 0.83 0.83 bcc110 1.0 1.0 1.0 0.83 0.83 0.83 Table 1
(a) (b)
Fig. 13. Sigma mises in the microstructures: (a) austenitic, (b) bainitic
these concentrations can be observed also inside the parent grains, in the areas near to the packet boundaries which come from the presence of the laths;
• the maximum value on the bainitic structure is larger than the maximum value in the austenitic one (respectively 2258 MPa instead of 1844 MPa, and the minimum values are the same in both microstructures (399 MPa in austenite and 401 MPa in bainite);
• it is worth noting that the local stress level reaches respectively 2.6 times and 2.2 times the value of the average stress for the bainitic structure and the austenitic structure;
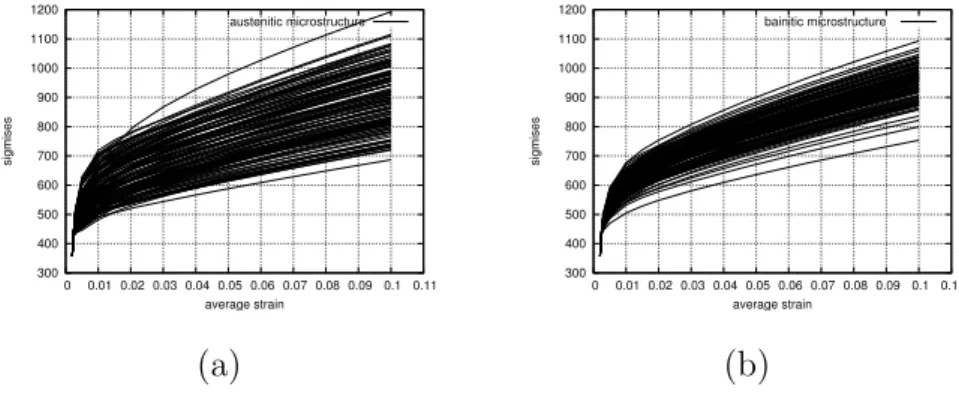
• the average responses (Fig.14 (a) and (b)) of the grains are more hetero-geneous in the austenitic microstructure. This is a consequence of the in-teraction between grains. In the bainitic microstructure this inin-teraction is more pronounced due to neighbouring effect and crystallographic orienta-tion which lead to a higher density of the curves of average reponses.
300 400 500 600 700 800 900 1000 1100 1200 0 0.01 0.02 0.03 0.04 0.05 0.06 0.07 0.08 0.09 0.1 0.11 sigmises average strain austenitic microstructure 300 400 500 600 700 800 900 1000 1100 1200 0 0.01 0.02 0.03 0.04 0.05 0.06 0.07 0.08 0.09 0.1 0.11 sigmises average strain bainitic microstructure (a) (b)
Fig. 14. Von Mises equivalent stress average by grain in the microstructures: (a) austenitic, (b) bainitic
References
Barbe, F., Decker, L., Jeulin, D., and Cailletaud, G. (2001). Intergranular and intragranular behavior of polycrystalline aggregates. Part I: FE model. Int. J. Plast., 17(4):513–536.
Bhadeshia, H.-K.-D.-H. (2001). Bainite in Steels. Cambridge University Press. Cailletaud, G. (1992). A micromechanical approach to inelastic behaviour of
metals. Int. J. Plast., 8:55–73.
Cailletaud, G., Chaboche, J.-L., Forest, S., and R´emy, L. (2001). On the design of single crystal turbine blades. Revue de M´etallurgie, f´evrier 2003:165–172. Diard, O., Leclercq, S., Rousselier, G., and Cailletaud, G. (2005). Evaluation of finite element based analysis of 3D multicrystalline aggregates plasticity. Application to crystal plasticity model identification and the study of stress and strain fields near grain boundaries. Int. J. Plast., 21:691–722.
George, P. (1997). Improvement on Delaunay based 3D automatic mesh gen-erator. Finite Elements in Analysis and Design, 25:297–317.
Lambert-Perlade, A., Gourgues, A., and Pineau, A. (2004). Austenite to bai-nite phase transformation in the heat affected zone of a high strength low alloy steel. ActaMat, 52:2337–2348.
Laug, P. and Borouchaki, H. (2003). Interpolating and Meshing 3-D Surface Grids. Int. J. Numer. Meth. Engng, 58:209–225.
Mandel, J. (1973). Equations constitutives et directeurs dans les milieux plas-tiques et viscoplasplas-tiques. Int. J. Solids Structures, 9:725–740.
Mathieu, J.-P., Berveiller, S., Inal, K., and Diard, O. (2006a). Microscale mod-eling of cleavage fracture at low temperatures: influence of heterogeneities at the granular scale. Fatigue and Fracture of Engng Mat and Struct, 29:725. Mathieu, J.-P., Inal, K., Berveiller, S., and Diard, O. (2006b). Computation of
local probability of brittle fracture of a rpv bainitic steel based on realistic microstructure representation. In Euromech-Mecamat : EMMC9 (9th Eu-ropean Mechanics of Materials Conference - Local Approach to Fracture), Moret sur Loing, France.
M´eric, L., Poubanne, P., and Cailletaud, G. (1991). Single crystal modeling for structural calculations. Part 1: Model presentation. J. Eng. Mater. Technol., 113:162–170.
Mudry, F. (1987). A local approach to cleavage fracture. Nucl. Eng. Design, 105:65–76.
Shtremel, M. A. (1997). Procnost splavov (Strength of alloys - in Russian). MISIS, Moscow.
Tanguy, B. (2001). Mod´elisation de l’essai Charpy par l’approche locale de la rupture. Application au cas de l’acier 16MND5 dans le domaine de transi-tion. PhD thesis, ´Ecole Nationale Sup´erieure des Mines de Paris, France.