HAL Id: hal-01199386
https://hal.inria.fr/hal-01199386
Submitted on 15 Sep 2015
HAL is a multi-disciplinary open access
archive for the deposit and dissemination of
sci-entific research documents, whether they are
pub-lished or not. The documents may come from
teaching and research institutions in France or
abroad, or from public or private research centers.
L’archive ouverte pluridisciplinaire HAL, est
destinée au dépôt et à la diffusion de documents
scientifiques de niveau recherche, publiés ou non,
émanant des établissements d’enseignement et de
recherche français ou étrangers, des laboratoires
publics ou privés.
Minimizing hallucination in Histogram of Oriented
Gradients
Javier Ortiz, Slawomir Bak, Michal Koperski, François Brémond
To cite this version:
Javier Ortiz, Slawomir Bak, Michal Koperski, François Brémond. Minimizing hallucination in
His-togram of Oriented Gradients. The 12th IEEE International Conference on Advanced Video and
Signal-based, Aug 2015, Karlsruhe, Germany. �hal-01199386�
Minimizing hallucination in Histogram of Oriented Gradients
Javier Ortiz
Sławomir B ˛
ak
Michał Koperski
François Brémond
INRIA Sophia Antipolis, STARS group
2004, route des Lucioles, BP93
06902 Sophia Antipolis Cedex - France
firstname.surname@inria.fr
Abstract
Histogram of Oriented Gradients is one of the most ex-tensively used image descriptors in computer vision. It has successfully been applied to various vision tasks such as localization, classification and recognition. As it mainly captures gradient strengths in an image, it is sensitive to local variations in illumination and contrast. In the result, a normalization of this descriptor turns out to be essential for good performance [3,4]. Although different normal-ization schemes have been investigated, all of them usually employ L1 or L2-norm. In this paper we show that an in-cautious application of L-like norms to the HOG descrip-tor might produce a hallucination effect. To overcome this issue, we propose a new normalization scheme that effec-tively minimizes hallucinations. This scheme is built upon a detailed analysis of the gradient distribution resulting in adding an extra bin with a specific value that increases HOG distinctiveness. We validated our approach on per-son re-identification and action recognition, demonstrating significant boost in the performance.
1. Introduction
Histogram of Oriented Gradients (HOG) is one of the most popular descriptors for characterizing image regions. In [3], authors cover the importance of the normalization step when using HOG since the descriptor is sensitive to il-lumination and contrast changes. They claim that without a proper normalization, the performance of their human de-tection framework drops by 27%.
Although many different normalization schemes have been investigated, the core of all of them is L1 or L2-norm. In this paper we show that an incautious application of L-like norms to the HOG descriptor might produce a hallu-cination effect, i.e. specific properties of high texture can appear while describing a texture-less image. An exam-ple of this can be seen in figure1. It illustrates histogram
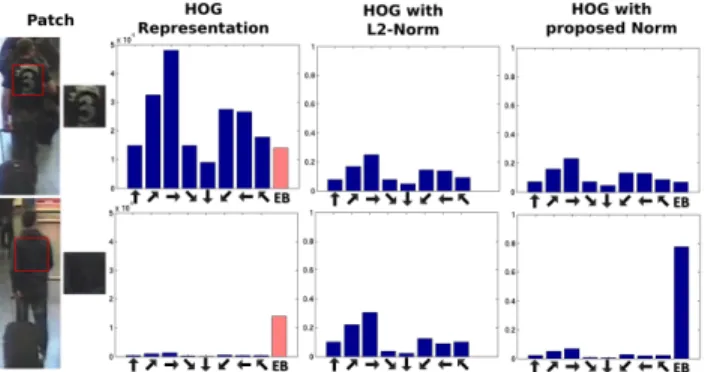
Figure 1: HOG representations of two patches with differ-ent amount of texture. Each bin represdiffer-ents the sum of edge magnitudes in a specific orientation. In the third column it can be seen that after L2-Norm both representations became very similar while they remained different in the fourth col-umn where the proposed bin marked asEBwas added.
representations of two significantly different image regions: high texture (top row) and low texture (bottom row). From the second column (HOG REPRESENTATION) it is clear that there is a big difference between HOG representations (in blue color) because the number of edges in the texture-less patch is at least one order of magnitude lower. However, after L2-normalization, this difference disappears making both image regions indistinguishable. We call this unde-sired effect as hallucination because some elements (in this case edges) appear in the HOG representation while they do not actually exist in the original image. As a result, two image regions can have similar final HOG representation while being actually very different. This might decrease the accuracy in any recognition system based on the HOG de-scriptor.
To overcome this issue, we propose to add an extra bin (EB) with a specific value to the HOG histogram before a normalization step. This bin is illustrated in red in figure1. We claim that theEBhelps to differentiate between patches that contain texture from the ones that do not. Note that the histograms in the last column maintain the difference
after the L2 normalization. The representation for the tex-tured patch does not change considerably while in the non-textured patch, the extra bin becomes significantly higher compared to the rest of the bins.
Normalization withEBadds two types of information for differentiating between textured and non-textured patches: (1) it helps to maintain the scale of bins when their value is low; (2) after the normalizationEBcontains information on the scale of the histogram; it gets higher for non-textured patches and lower for textured ones. We discovered that the value ofEBcan have a significant impact on the perfor-mance w.r.t. the recognition task.
This paper makes the following contributions:
• We propose to add the extra bin (EB) before apply-ing any histogram normalization. This keeps HOG de-scriptor highly discriminative.
• We perform a detailed analysis ofEBw.r.t. its value and the descriptor performance on different vision tasks. We offer a learning scheme of theEBvalue. Our learn-ing is based on modelllearn-ing an integral of gradient as a Mixture of two Gaussian distributions. We found that the optimal value ofEBcorresponds to the intersection of these distributions.
• We validated our method on 3 datasets for person re-identification and 2 datasets for action recognition ob-taining surprising results.
This paper is organized as follows. Related work on HOG descriptor and its normalization schemes are covered in section2. Contributions are described in section3. Fi-nally, we validate our approach in section4and conclude in section5.
2. Related work
Histogram of Oriented Gradients (HOG) is one of the most popular representations for image regions due to its successful application to various vision tasks such as object detection, classification and recognition. Introduced by [3] for detecting pedestrians, it significantly outperformed ex-isting state of the art detectors. Given an image, it extracts intensity (or color) gradient for each pixel using finite dif-ference filters ([−1, 0, +1], [−1, 0, +1]t) computing pixel orientation and magnitude. Pixel magnitudes are grouped w.r.t. their discretized orientations producing histograms. Already [3] illustrates that such representation is sensitive to local variations in illumination and contrast, making a nor-malization step crucial for good performance. Authors use four different normalization factors for obtaining a robust representation. These factors are extracted from surround-ing image regions computed as L2-norms. The final feature vector is a concatenation of given normalization responses.
Same representation is employed in [14] for identity recog-nition.
In [4] on top of this feature vector, principal component analysis is applied for reducing dimensionality. By detailed analysis of eigenvectors, [4] proposes analytic dimensional-ity reduction without loss of the performance. This analytic reduction is also involving L2-norm.
Action recognition is other vision domain that exten-sively employs HOG descriptor for differentiating appear-ance. Although in this domain motion descriptors (e.g. HOF[9], MBH[16]) are the most useful for recognizing ac-tions, [16] shows that appearance based descriptors carry complementary information and can boost performance. HOG descriptor is one of the most popular appearance de-scriptor used together with local spatio-temporal feature methods to encode local appearance. Such combination of motion and appearance based descriptor helps to distinguish actions with similar motion pattern but different appearance (e.g. actions involving different objects). All these methods usually employ L2-norm before the learning step.
The issue related to the previously mentioned halluci-nation effect has recently been mentioned in OTC descrip-tor [11] for scene categorization problem. Authors came up with the idea of adding a fixed small-value bin (0.05) to the histogram before applying L2-norm. We claim that the value of this additional histogram has significant im-pact on the performance (see section4). As a result, instead of having a fixed-value bin, we propose to learn this value based on a gradient distribution computed from a random sampling of the given dataset. Assuming Gaussian distribu-tions of textured and texture-less image regions we employ Expectation Maximization algorithm for finding the opti-mal bin value. Demonstrated experiments on diverse vision tasks and datasets confirm our claims.
3. Approach Overview
3.1. Histogram of Oriented Gradients
As it was explained in previous sections, each HOG bin represents the magnitude of edges that a patch contains in a specific range of orientations. In cases where the image has size or illumination changes, the final representation of the same person in two cameras could be very different. Using histogram normalization in HOG, this variations can be at-tenuated because this step sets the same range of values for each representation. Examples of HOG representations can be seen in fig.1where a patch is extracted from an image and then each bin in the histogram represents the strength of edges in each orientation. Applying L2-norm scheme, the hallucination problem can be seen in the third column where the differences between histograms are very low while they come from two very different images.
bin is added to HOG representations before normalization step. This bin has a specific value that should be found in or-der to have optimal performance. This step is explained be-low while the entire algorithm is detailed in subsection3.4.
3.2. Distribution of the sum of bins
The first step to find the optimal value for the extra bin is to calculate the HOG representation from a considerable number of random patches in the dataset. In this case, each bin represents the sum of magnitudes for all pixels in the patch grouped w.r.t. their orientations.
With this information, the following step is to calculate the sum for all bins in each HOG descriptor and plot them in a histogram that shows the frequency of appearance for each sum of values in this particular dataset. In other words, having bin bi that represents a particular orientation in a
HOG descriptor and number of bins n for each histogram, we express the sum of all bins of a particular patch j as:
sj= n
X
i=1
bi (1)
Following this idea, we sample patches from i-LIDS-MA[1] (person re-identification dataset) and we plot sj
val-ues w.r.t. their frequency, generating distribution S = p(s) (in blue in fig.2).
3.3. Expectation Maximization
From figure2 it is clear that distribution S is a mixture of distributions. Thus, we model S as a mixture of two Gaussian distributions:
S = N1(µ1, σ1) + N2(µ2, σ2). (2)
We believe that the left side of S corresponds to texture-less patches while the right side corresponds to textured patches. We applied Expectation Maximization (EM) algorithm to find the parameters (µ1, µ2, σ1, σ2) of N1and N2that stand
for a Gaussian Mixture Model (GMM).
Following the experiments described in subsection 4.1
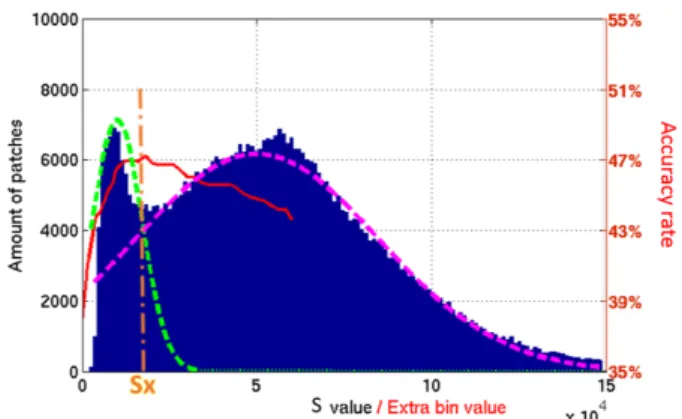
we perform re-identification tests setting different values for EBand we get the results shown in fig. 2 (red curve) for i-LIDS-MA where the highest re-identification rate is ob-tained forEB = sx. Note the red y-axis on the right side
illustrating the recognition performance w.r.t. value ofEB. It can also be seen in fig.2that the value of sxobtained
experimentally corresponds to the value where two Gaus-sian distributions intersect. This relation means that EB value should be chosen in the intersection between the two modelled Gaussians in order to keep as much texture-less patches in the left and textured patches in the right.
Once the intersection is found, we use it to set the EB value in HOG descriptor for all the patches in the dataset. Finally, we normalize descriptors using L2-norm and con-tinue with the normal work flow w.r.t. the given application.
Figure 2: In blue: histogram of S (sum of bins) for HOG descriptors in i-LIDS-MA dataset. Red curve shows the first rank recognition rate w.r.t. to different EB- see the y-axis on the right side). Green and purple curves illustrate two Gaussian distributions obtained by employing Expectation Maximization. Peak of performance can be seen forEB = sx, where two distribution intersect.
3.4. Algorithm
As a summary, we present the steps of our algorithm: Algorithm 1 Proposed algorithm
1: Extract HOG descriptor from randomly sampled patches from the dataset.
2: Generate a distribution of S where sj=P bi.
3: Fit two Gaussian models using EM.
4: Find the intersection sxof two Gaussian curves.
5: AddEB= sxfor each HOG descriptor in the dataset,
6: Normalize descriptors with a L-like norm and continue with the normal work flow.
4. Experiments
4.1. Person re-identification
During the past few years person re-identification has been the focus of intense research bringing new metrics and datasets for evaluation. We carry out our experiments on three challenging datasets: i-LIDS-MA[1], i-LIDS-AA[1] and PRID 2011[6].
In our experiments, we follow a single-shot scheme that uses only a randomly selected single image for generating gallery and probe signatures.
Every cropped pedestrian image is scaled into a fixed size window of 64 × 192pixels. A set of rectangular sub-regions is produced by shifting 32 × 32 sub-regions with a 16 pixels step. This operation results in 33 overlapping rect-angular sub-regions. From each sub-region, we extract a HOG descriptor consisting of 8 bins. These descriptors are concatenated in order to form the subject signature.
Figure 3: Distribution of the sum of bins for randomly sampled patches for each dataset (scale on x-axis is ×104). Modelled distributions are drawn in red and green.
In the evaluation step, each signature is used as a query to the gallery set of signatures from different cameras. We repeat experiments 20 times and then average obtained results. Algorithms performance are analysed in terms of recognition rate for the first rank and using the cumulative matching characteristic (CMC) curve [5]. This curve represents the expectation of finding the correct match in the top n matches. Note that in all experiments we use Euclidean distances for comparing signatures. On top of this framework we can easily apply any metric learning approach. Metric learning performance w.r.t.EBis beyond the scope of this paper.
i-LIDS-MA[1]: This datasets have been extracted from the 2008 i-LIDS Multiple-Camera Tracking Scenario (MCTS) dataset with multiple non-overlapping camera views. It consists of 40 individuals manually selected. For each indi-vidual a set of 46 images is given. Hence, we have in total 40 × 2 × 46 = 3680 images.
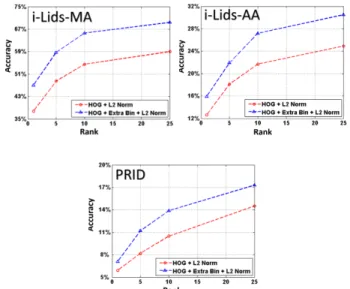
Table1and figure4shows that using our approach, we can obtain +9.2% of improvement compared to not using EB. As it can be seen in fig.3, i-LIDS-MA presents the best distinguishable Gaussian distributions. This means that the dataset contains a well defined difference between patches with and without texture and therefore the use of the pro-posed EB has significant impact on the performance. We also report the HOG performance w.r.t. to differentEB val-ues.
Table 1 also illustrates a comparison with state of the art results on this dataset. Our approach, although very simple, outperforms both OMRR and RDC methods. We do not outperform CML but it is important to note that in experiments we use just a simple Euclidean distance instead of employing Metric Learning. The main reason of such choice is to have fully unsupervised framework for re-identification.
i-LIDS-AA[1]: This dataset contains 100 individuals au-tomatically detected and tracked in two cameras. Cropped images are noisy, which makes the dataset more challeng-ing (e.g. detected boundchalleng-ing boxes are not accurately centred around the people, only part of the people is detected due to
Figure 4: Performance comparison with and with out using our approach on Person Re-identification datasets.
occlusion).
The performance of EBusing our algorithm is also re-ported in Table 1 and fig. 4 illustrates a comparison of the HOG descriptor performance with and without the pro-posed EB. In this case, our approach is outperformed by Metric Learning based algorithms.
The performance improvement is less than in i-LIDS-MA because in this dataset, both distributions are very close between each other so, in consequence, there are a lot of miss-predictions when trying to set a value that differentiate non-textured from textured patches (see fig.3). PRID 2011 dataset[6]: This is a multi-shot dataset that consists of images extracted from multiple person trajec-tories with two static cameras. The dataset contains im-ages from 475 person trajectories from one camera and 753 from the other one with 245 persons appearing in both views. Images present viewpoint, illumination and back-ground changes between cameras but also people are cap-tured with different poses since images are extracted from trajectories. Finally, this dataset contains 5 images per tra-jectory.
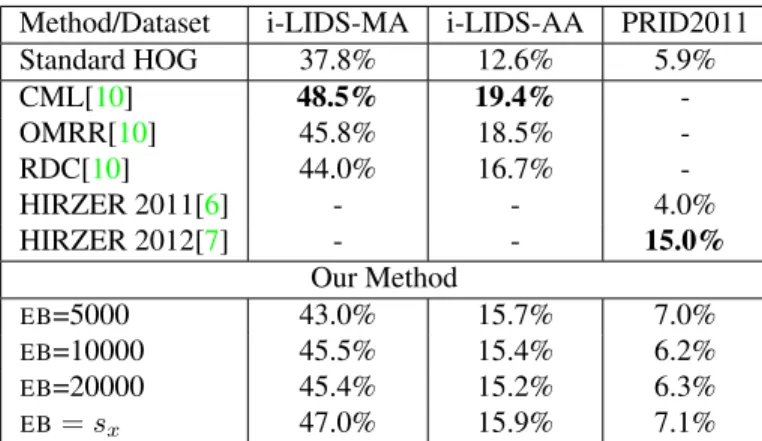
Method/Dataset i-LIDS-MA i-LIDS-AA PRID2011 Standard HOG 37.8% 12.6% 5.9% CML[10] 48.5% 19.4% -OMRR[10] 45.8% 18.5% -RDC[10] 44.0% 16.7% -HIRZER 2011[6] - - 4.0% HIRZER 2012[7] - - 15.0% Our Method EB=5000 43.0% 15.7% 7.0% EB=10000 45.5% 15.4% 6.2% EB=20000 45.4% 15.2% 6.3% EB= sx 47.0% 15.9% 7.1%
Table 1. Accuracy results for first rank on Person Re-identification datasets. Values of sxare 14000, 7000 and 7000 respectively (see
fig.3)
In fig3, PRID 2011 presents a distribution where it can be seen that the amount of non-textured patches is very low compared to textured patches. This situation made that the improvement of our approach is much lower than in other datasets. Table1shows that while our approach performs better than without usingEB, it is still worse than other ap-proaches. This can be explained as we are not using any Metric Learning approach in our framework like in [7].
4.2. Action Recognition
In this section, we present the evaluation of our approach using two state-of-the-art datasets: URADL [12] and MSR-DailyActivity3D [18]. We study the performance of HOG appearance descriptor with and without extra bin. The stan-dard HOG descriptor is the most popular appearance de-scriptor for action recognition, and therefore, it provides a good baseline for comparison. In many works [18, 9] authors combine appearance descriptors with motion-based descriptors. We also combine proposed method with Dense Trajectories motion features (trajectory shape, HOF, MBH). For evaluation we extract local spatio-temporal patches from a video sequence. For this task we use Dense Trajectories detector, but it is worth mentioning that any other detector can be used. We follow the same procedure as in [16] and we cut the patch around each trajectory point. Then for each patch we compute HOG descriptor with standard normalization and with proposed extra bin. Finally we follow standard Fisher Vectors [15] framework, where we encode a video sequence using first and second order statistics of a distribution of a descriptor feature set X. Based on such representation we train linear SVM. To fuse together different descriptors we simply concatenate Fisher Vector representation before training SVM.
URADL dataset[12]: The University of Rochester
Activ-ities of Daily Living dataset contains 10 types of human activities of daily living. In total the dataset contains 150 video sequences. Actions in the data-set are difficult to clas-sify based on a single descriptor (e.g. eating a banana vs. eating snack chips). Thus appearance based descriptor like HOG provides important information, as addition to motion based descriptors.
We use leave-one-person-out cross-validation evaluation scheme. In table 2 we report performance of proposed method with different EB values compared to standard HOG. When we use EB based on proposed Gaussian intersection method, we report a gain in the performance, comparing to standard HOG. However, our results also show that we can find a better EB value by exhaustive search on validation-set. We found that relatively big EB values improve HOG performance. This situation can be explained that extracted patches were selected using Dense Trajectories detector - therefore many patches are highly textured. It is visible in figure3, where distribution for URADL does not have clear separation between two Gaussians. In addition when we select relatively big EB value, it means that we focus more on the fact that EB after normalization contains information on the scale of the histogram (see section 1). Moreover, big values of EB suppress small differences in HOG descriptors (patch details). In the result, two patches that share common pat-tern but differ in details, after addingEBwith a high value become more similar. Such property is desired in action recognition, as very often we look for the rough appearance correspondence of objects involved in the action, rather than exact match. In table 3 we report performance of fusion with motion based descriptors where our approach reaches state-of-the-art results.
MSRDailyAcivity dataset[18]: This dataset consists of 16 actions performed by 10 subjects. In addition each action is performed in standing and sitting position which adds an additional intra-class variation.
We use leave-one-person-out cross-validation evaluation scheme. In table 2we report performance of differentEB values compared to standard HOG. In this dataset, we have the same situation as with URADL dataset. But the dif-ferences between performance of different EB values are smaller than in URADL. This fact can be explained that in MSRDailyActivity3D actors are farther from camera com-paring to URADL, thus appearance of objects involved in action is smaller and HOG descriptor contributes less to overall accuracy. In table4we report performance of fusion with motion based descriptors. Our method is outperformed only by methods which use skeleton, which requires addi-tional segmentation step and depth information from sen-sor. However our method achieves competitive results using only RGB video sequence.
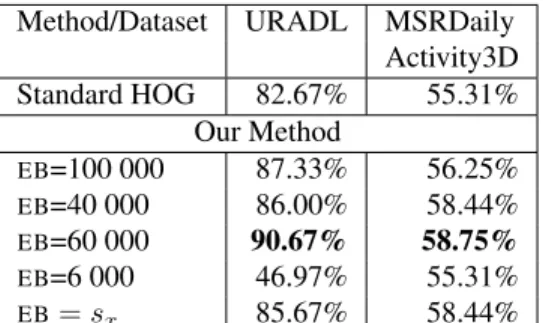
Method/Dataset URADL MSRDaily Activity3D Standard HOG 82.67% 55.31% Our Method EB=100 000 87.33% 56.25% EB=40 000 86.00% 58.44% EB=60 000 90.67% 58.75% EB=6 000 46.97% 55.31% EB= sx 85.67% 58.44%
Table 2. Results on Action Recognition datasets. The sx values
are 27000 and 36000 respectively.
Approach Accuracy
Messing[12] 89.00%
Bilinski[2] 92.00%
Wang[17] 96.00%
DT - DenseTrajectories 93.33% DT - with our method 94.00%
Table 3. Results of fusion with motion model on URADL dataset.
Approach Accuracy
Dynamic Time Warping[18] 54.00%
HON4D[13] 80.00%
Actione Ensemble[18] 85.00% 3D Trajectories[8] 72.00% DT - DenseTrajectories 77.81% DT - with our method 80.31%
Table 4. Results of fusion with motion model on MSRDailyActiv-ity3D dataset. Please note that approaches in italic requires skele-ton detection and depth information.
5. Conclusion
We proposed the new normalization scheme of the HOG descriptor that effectively minimizes a hallucination effect. We modeled the integral of gradient as the Mixture of two Gaussian distributions obtaining a separation of high and low texture images. The intersection of these distribution gives us the value of the extra bin (EB) that is added the set of gradient orientations in the HOG descriptor. We demon-strated that while normalizing HOGs, the value ofEB has significant impact on the performance. We showed that our approach consistently improves recognition rate in both person re-identification and action recognition. The pro-posed EB gave optimal results for person re-identification while performing sub-optimally for action recognition. Fur-ther analysis will focus on searching optimal EB for ac-tion recogniac-tion and on extending re-identificaac-tion by met-ric learning approaches.
References
[1] S. Bak, E. Corvee, F. Bremond, and M. Thonnat. Boosted human re-identification using Riemannian
manifolds. IMAVIS, 2011.3,4
[2] P. Bilinski, E. Corvee, S. Bak, and F. Bremond. Rel-ative dense tracklets for human action recognition. In FG, 2013.6
[3] N. Dalal and B. Triggs. Histograms of oriented gradi-ents for human detection. In CVPR, 2005.1,2
[4] P. F. Felzenszwalb, R. B. Girshick, D. McAllester, and D. Ramanan. Object detection with discriminatively trained part based models. TPAMI, 2010.1,2
[5] D. Gray, S. Brennan, and H. Tao. Evaluating appear-ance models for recognition, reacquisition, and track-ing. In PETS, 2007.4
[6] M. Hirzer, C. Beleznai, P. M. Roth, and H. Bischof. Person re-identification by descriptive and discrimina-tive classification. In SCIA, 2011.3,4,5
[7] M. Hirzer, P. M. Roth, and H. Bischof. Person re-identification by efficient impostor-based metric learn-ing. In AVSS, 2012.5
[8] M. Koperski, P. Bilinski, and F. Bremond. 3D Trajec-tories for Action Recognition. In ICIP, 2014.6
[9] I. Laptev, M. Marszalek, C. Schmid, and B. Rozen-feld. Learning realistic human actions from movies. In CVPR, 2008.2,5
[10] W. Li, Y. Wu, M. Mukunoki, and M. Minoh. Cou-pled metric learning for single-shot versus single-shot person reidentification. Optical Engineering, 2013.5
[11] R. Margolin, L. Zelnik-Manor, and A. Tal. Otc: A novel local descriptor for scene classification. In ECCV, 2014.2
[12] R. Messing, C. Pal, and H. Kautz. Activity recognition using the velocity histories of tracked keypoints. In ICCV, 2009.5,6
[13] O. Oreifej and Z. Liu. Hon4d: Histogram of ori-ented 4d normals for activity recognition from depth sequences. In CVPR, 2013.6
[14] O. Oreifej, R. Mehran, and M. Shah. Human identity recognition in aerial images. In CVPR, 2010.2
[15] F. Perronnin, Y. Liu, J. Sanchez, and H. Poirier. Large-Scale Image Retrieval with Compressed Fisher Vec-tors. In CVPR, 2010.5
[16] H. Wang, A. Klaser, C. Schmid, and C.-L. Liu. Action recognition by dense trajectories. In CVPR, 2011. 2,
5
[17] J. Wang, Z. Chen, and Y. Wu. Action recognition with multiscale spatio-temporal contexts. In CVPR, 2011.
6
[18] Y. Wu. Mining actionlet ensemble for action recogni-tion with depth cameras. In CVPR, 2012.5,6