HAL Id: hal-02184637
https://hal.archives-ouvertes.fr/hal-02184637
Preprint submitted on 16 Jul 2019HAL is a multi-disciplinary open access archive for the deposit and dissemination of sci-entific research documents, whether they are pub-lished or not. The documents may come from teaching and research institutions in France or abroad, or from public or private research centers.
L’archive ouverte pluridisciplinaire HAL, est destinée au dépôt et à la diffusion de documents scientifiques de niveau recherche, publiés ou non, émanant des établissements d’enseignement et de recherche français ou étrangers, des laboratoires publics ou privés.
Nonlinear Modeling of the Effect of n=2 Resonant
Magnetic Field Perturbation on Peeling-Ballooning
Mode in KSTAR
S Kim, S. Pamela, O Kwon, Marina Becoulet, G Hujismans, Y In, M Hoelzl, J
Lee, M Kim, G Park, et al.
To cite this version:
S Kim, S. Pamela, O Kwon, Marina Becoulet, G Hujismans, et al.. Nonlinear Modeling of the Effect of n=2 Resonant Magnetic Field Perturbation on Peeling-Ballooning Mode in KSTAR. 2019. �hal-02184637�
Nonlinear Modeling of the Effect of n=2 Resonant Magnetic Field
Perturbation on Peeling-Ballooning Mode in KSTAR
S.K. Kim1, S. Pamela2, O. Kwon3, M. Becoulet4, G. Hujismans4, Y. In5 , M. Hoelzl6, J. H. Lee7, M. Kim7, G.Y. Park7, H. S. Kim7, Y.H. Lee1, G.J. Choi1, C.Y. Lee1, JOREK team, and Y.–S. Na1*
1
Department of Nuclear Engineering, Seoul National University, Gwanak 08826, Seoul, Korea
2CCFE, Culham Science Centre, Abingdon, Oxon OX14 3DB, United Kigdom 3
Department of Physics, Daegu University, Gyeongsan 38453, Gyeongbuk, Korea
4
CEA, IRFM, 13108 Saint-Paul-Lez-Durance, France
5
Department of Physics, Ulsan National Institute of Technology, UNIST-gil 44919, Ulsan, Korea
6
Max-Plank-Institue for Plasma Physics, 85748 Garching, Germany
7National Fusion Research Institute, Youseong 34133, Daejeon, Korea
Abstract
The impact of n=2 resonant magnetic perturbation (RMP) on the pedestal and peeling-ballooning mode (PBM) is investigated using the nonlinear 3D MHD code JOREK. It is based on the reduced MHD equations (viscos-resistive MHD), and the experimental parameters from the RMP-driven Edge localized mode (ELM) suppression discharge in KSTAR. In this study, n=2 kink-peeling mode was triggered through nonlinear coupling with RMP, and the pedestal is degraded by increased radial transport due to both tearing and kink-peeling response. The ELM mitigation and suppression are observed when RMP of sufficient amplitude is applied. ELM suppression was characterized by spatial locking of mode structure. In the simulation, the ELM suppression is not only due to the degraded pedestal but is also related to the mode coupling between the PBMs and the RMP-induced mode at the plasma edge. The role of PBM locking in mode suppression is suggested in terms of mode coupling.
I.
Introduction
High performance (H-mode) plasma configuration is one of the promising candidates for fusion plasma operations such as ITER. H-mode plasma is characterized by having an edge transport barrier, which is generally understood to be formed by E×B shearing rate [1-3] in the edge region. Because the edge transport barrier globally improves plasma confinement by forming the pedestal, it is important to utilize its advantage. However, the edge transport barrier raises the pressure gradient of the pedestal or plasma current density, and it can lead to instabilities so-called Edge Localized Modes (ELM). Peeling-ballooning mode (PBM) [4, 5], the MHD mode driven by current density (peeling) and pressure gradient (ballooning), is considered as the dominant instability resulting in ELM. ELMs induce the periodic collapse of the pedestal and form transient heat flux to the plasma-facing component, which can result in significant heat deposition to divertor target. In future devices such as ITER and DEMO, divertor
heat fluxes during ELMs are expected to exceed 1 GW/m [6, 7] which could cause severe damage on tungsten divertor tiles. Therefore, a reliable method to control or suppress the ELM is essential for the high-performance steady state operations based on the H-mode edge.
Resonant magnetic perturbation (RMP) with external magnetic coils is one of the effective methods to suppress ELMs. It was found that RMP can successfully mitigate ELMs in JET [8], and MAST [9]. Furthermore, there are reports of full ELM suppression with RMP in DIII-D [10], KSTAR [11], ASDEX-U [12], and EAST [13]. General understanding of RMP-driven ELM suppression is followed: When RMP of toroidal mode number n is applied, these field perturbations penetrate plasma and induce the field reconnection and magnetic island at the rational surface of q=m/n, where m is poloidal mode number. Because the rational surfaces are dense enough at the plasma edge, islands can overlap which produces the formation of the stochastic layer and increases the radial transport. As a result, the pedestal gradient is reduced, and ELMs are suppressed as pedestal gradient does not exceed the marginal stability limit. From this point of view, extensive studies have been conducted on the field penetration and the radial transport induced by RMP. Previous studies [14-20] revealed that perpendicular electron flow shields the RMP and suggested the importance of zero electron flow layer at the pedestal to improve the field penetration. Numerical studies found that RMP can drive the kink-peeling response, and it amplifies the field penetration [21-24]. Moreover, it has been reported that RMP can increase turbulence transport [25, 26] in the pedestal. These studies are trying to explain the RMP-driven ELM suppression with the pedestal degradation but have certain limitation in terms of the experimental observation where coherent PBM-like mode structures still remain during the ELM suppression phase. For understanding the experimental results, several studies focused on the direct coupling between RMP and ELM. They revealed that the property and stability of PBM change through 3D-field modulation from RMP [27, 28].
In this paper, the effect of RMP on the plasma response and the suppression of PBM has been studied. The RMP driven ELM suppression discharge in KSTAR is modelled with the 3D nonlinear MHD code JOREK [29]. The descriptions of the model and experimental observation are shown in Section II. In section III, “natural” PBM simulation without RMP is described. In the sections IV and V, the modelling results for the plasma response and the suppression of PBM that induced by RMP are presented, respectively. The possible mechanism of ELM suppression, including nonlinear interaction between RMP and PBM, is discussed in the following section. Last, the conclusion is provided in section VI.
II.
Configuration of the simulation
II-1. Simulation model
In this work, we used the 3D non-linear MHD code, JOREK including X-point and the SOL. The reduced MHD model has four field equations which includes the Ohm’s law, the continuity equation, the momentum equation, and the energy equation. The momentum equation is separated into the parallel and the perpendicular components. Realistic toroidal flow, two-fluid diamagnetic effect, and neoclassical viscosity are implemented in the model to include the effect of plasma flow on the ballooning modes.
In the JOREK code, the magnetic field is represented by , where is the toroidal angle, is the poloidal magnetic flux, and . is the magnetic axis and is the amplitude of the toroidal field at . In our reduced MHD model, is set to be constant in time.
The plasma fluid velocity is expressed as Eq. (1)
where || is the velocity parallel to the magnetic field and / is drift velocity. The electric field is expressed as where is electrostatic potential. ∗
! /" #
⁄ is the ion diamagnetic velocity which reflects the two-fluid diamagnetic effect where , ! , " and " %# are the scalar pressure, charge, mass and mass density of ion, respectively. The density of ion and electron is assumed to be the same % % %&. We also set ' '& '/2 and & /2 for the simplicity where ' and are the sums of the ion and electron temperature and scalar pressure, respectively. Then, the normalized set of equations based on these models are given as follow
1 ) )* ∙ , -./ 0 1 ∙ ,1 2 340 (2) 5 || ∗, (1) ) )* ∙ 7 8 ∙ 92 2 # :; (3) ∙ < 7)= ∙ 8 > '# ? ∙ ΠAB&C :D :; E2 F 0 (4) ∙ < 7)= ∙ 8 || '# ? ∙ ΠA,HIJ :D :; E|| F 0
(5) ) '#
)* 7 > ||8 ∙ '# K ' ∙ 7 > ||8 ∙ 7L2 2' L|| ||'8
1 K#:M :;/2
, which is the equations also used in Ref [19]. The detailed descriptions of these variables are the following: NO⁄ ,NO and * *NO⁄PQ ,NO, where SI denotes SI unit value, Q 4 10ST and
,NO is mass density at the magnetic axis. Other variables are normalized as U Q UNO , ' Q ,NO ! "⁄ #'V. , 3 Q 3NO , and NOPQ / ,NO where 3 is the plasma current density. Normalization of the flow depends on direction where || ||,NOPQ and W ∙ !̂W
W,NO/PQ are satisfied. Here, poloidal unit vector !̂W is defined as
A Spitzer-like resistivity 1 1 ,NOP ,NO⁄ 7'Q &⁄'&, 8SY/ , temperature-dependent perpendicular viscosity E2 E2 ,NOP ,NO⁄ 7'Q &⁄'&, 8SY/ , and constant parallel viscosity E|| E||,NOP ,NO⁄ Q are used in the modeling where 1 ,NO, E2 ,NO and '&,C are the resistivity, perpendicular viscosity and electron temperature at the magnetic axis, respectively. Braginskii parallel conductivity L|| L|| ,NOPQ 7'&⁄'&, 8Z/ and adiabatic index γ 5/3 are applied. For the perpendicular diffusion, particle diffusion coefficient 92 92NOP ,NOQ and thermal diffusion coefficient L2 L2NOP ,NOQ are used to sustain the initial density and temperature profile. Their typical values at the magnetic axis are 92 ,NO5 1m /s and L2 ,NO5 1kg/ m ∙ s# . 92 and L2 are vary radially. Their radial profiles are proportional to 92 ∝ |b |Sc and L2∝ |b'|Sc of initial profile. In addition, the current source 3d , the particle source :; , the heat source :M and the toroidal momentum source :D are applied to reproduce the realistic equilibrium profile. All source profiles do not change in time.
The neoclassical poloidal friction has the heuristic form [30] as
where W ∙ !W , e,HIJ f -./ 2 ∙ 2'#/ W , Q,B&C Q,B&C,NOPQ / , and -./ " 72! PQ 8⁄ . The neoclassical coefficients Q,B&C and f are calculated from Ref [31]. With these models, the plasma flows evolve self-consistently towards an equilibrium and a plasma with flows and electric field satisfying the radial force balance is obtained eventually. The radial electric field can be written as
In JOREK [32], 2D cubic Bezier finite elements are used to construct the 2D grid in the poloidal cross-section, and the toroidal direction is decomposed in Fourier series. The finite element grids are aligned to equilibrium flux surfaces, and they contain the core, the SOL and the private region. The boundary
!̂W b #. (7)
∙ ΠA,HIJ Q,B&C
W7 W W,B&C8!W,
(8)
of the computational domain is limited by the flux surfaces and divertor target plates. For the boundary condition of the computational domain, Dirichlet conditions are used for all the variables except for the divertor targets. On the divertor targets, Bohm sheath boundary conditions are set, and the temperature and density have free outflow. Finally, the implicit Crank–Nicolson scheme is used for the time stepping, and generalized minimal residual solver (GMRES) is applied.
II-2. Input configuration
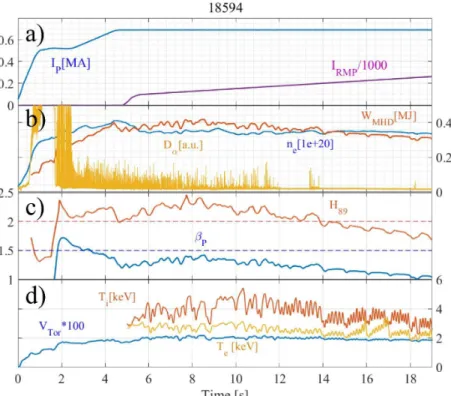
In this work, we use the data from KSTAR #18594 [33] discharge of n=2 RMP driven ELM suppression in the simulation. The summary of discharge is shown in Figure 1. Main parameters of the discharge have major radius ( 1.8m), toroidal field ( 1.8T), plasma current (lm 0.66MA), q profile (q ~1, qsZ~4), global poloidal beta (tm~1), and line average density (%u&~3.3 10csmSY). In this discharge, the currents in the three rows of versatile IVCC with two turns in low field side [34] were set such that the magnetic perturbation of n=2 was applied. Small sideband modes of n=4,6,8,.. were also induced due to the geometry of IVCC but they are neglected in this work as their amplitudes are much smaller than that of n=2 component. The phase difference between rows is ΔΦ 180° which is the standard n=2 field coil configuration for the ELM suppression in KSTAR. When the stationary state was achieved (~4.9 s), RMP of coil current lyz{ 2kA was applied from 5.0 s to 5.5 s, and then it gradually increased with rate of ~0.2kA/s . ELM suppression was achieved at 12.0 s where
lyz{~3.7kA. Then, ELMs were fully suppressed until the end of the discharge. In the simulation, the
equilibrium at t 6.45 s , the earliest time slice where ECEI measurement was available and the profile variation and ELM mitigation due to RMP have not yet appeared, is selected as a reference. With this equilibrium, we reproduced ELMy plasma with JOREK and compared the simulation results with ECEI measurement.
We used the equilibrium reconstruction with EFIT [35] (EQDSK file), and initial temperature and density profile are fitted from charge exchange spectroscopy (CES) and Thomson scattering (TS) diagnostic data considering error bars. The resulting q, %&, '&, ' , and toroidal rotation ~ profile
are given in Figure 2. Electron density and temperature profile of pedestal region in this discharge has considerable uncertainty because of low spatial resolution and large error of TS measurement at the plasma edge. For these reasons, %& and '& pedestal profile are adjusted to improve the profile quality in the simulation. Profiles are changed within the error bars in order to make an equilibrium linearly unstable to PBM and to make mode properties consistent with ECEI measurement. For this purpose, the changes in PBM linear stability and most dominant mode n were calculated by changing the width and height of %& and '& pedestal at the same time as in Ref [36]. Modified Sauter model [37] is applied to calculate the edge bootstrap current in this scan. The result is shown in Figure 3. In the figure,
the orange star represents the reference pedestal, the pink line is marginal PBM stability limit, and the red line corresponds to the pedestal whose dominant PBM mode n 12 is agreement with results from ECEI measurement. Linear growth rate (γ) increases with the increasing height and the decreasing width while dominant mode n decreases when γ increases. Therefore, we increase %& and '& pedestal heights by 10%. After constructing the static equilibrium with %& , ' , and ~ in JOREK, neoclassical coefficients from Ref [31] are calculated and results are shown in Figure 4(a). h satisfying Eq. (9) is found by evolving only n=0 component for * 2000-€. The poloidal flow profiles from the resulting h and the distribution of || are given in Figure. 4(b) and (c), respectively. Through this process, a self-consistent kinetic equilibrium with plasma flow based on experimental data is reproduced. The modeling of PBM and RMP application in this work is based on this kinetic equilibrium.
We used normalized parameters based on the experimental data; L|| 2 10Y, E2 2 10ST, and
E|| 2 10S•. Here, for numerical reasons, 40 times larger resistivity (1 2 10ST) and two times
smaller -O‚ 3 10SY# are used, which is the main limitation of this study.
III.
PBM simulation without RMP effect
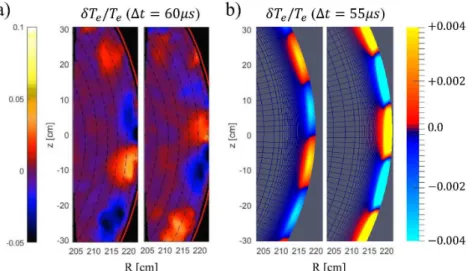
In order to study the ELM suppression by RMP, it is essential to obtain PBM without RMP effect in the simulation which is consistent with the experimental data. For this purpose, the linear PBM stability of the initial phase is checked. In our reference time slice (6.45s) where the effect of RMP was minimal or has not yet appeared, the most unstable mode n of PBM in the linear phase from ECEI diagnostics was
n 12. The temperature fluctuations δ'I for the n = 12 PBM inside separatrix during Δ*~60μs
120τ€# are presented in Figure 5 (a). In the measurement, the mode structure was poloidally rotating in the ion-diamagnetic direction (-z direction at LFS) with e,†J‡I,Iˆ‰~2.9km/s in the lab frame. To calculate the linear behavior of PBM, a single harmonic mode n=12 is launched on the kinetic equilibrium with a small amplitude at the numerical noise level (~10– T). Then, the linear phase of PBM is modeled. Its linear growth rate is K-d~0.054. The resulting δ'I for n=12 PBM at LFS in the lab frame correspond to Figure 5 (b). Here, δ'I is taken near the end of the linear phase with
Δ*~55μs 110-€#. In the figure, the n=12 mode structure rotates in the ion-diamagnetic direction at about e,†J‡I~3.2km/s , which shows good agreement with ECEI measurement (~2.9km/s ). Notice that, e,†J‡I is similar to e, (~2.8km/s) at the mode location. In our case, poloidal E B velocity e, !W∙ > at the pedestal is ion-diamagnetic direction due to large [32], and therefore modes rotate in the clockwise direction. This similarity of e,†J‡I and e, is also consistent with the
previous studies [32, 33].
ELM is a nonlinear MHD phenomenon, and mode coupling should be included in the modeling. Therefore, nonlinear simulation including multi harmonics is conducted for the next step. Although n=12 is the most unstable mode, harmonics of n=2, 4, 6, 8, 10, 12 and 14 are considered due to limits in the computational resources. The results for the perturbed kinetic energy Ž• H • | 2 | ‘ /2 of PBM in nonlinear phase are shown in Figure 6. Here, n=12 is the fastest growing mode, and it enters the nonlinear phase first. Then, other modes including n=10 are driven by mode coupling in the nonlinear phase, and they result in bursty MHD behavior with mode crashes. For example, amplitude of n=10 mode increases during n=12 mode crash. The n=10 mode starts to crash 700-€ after the crash of the n=12 mode. In the mode crash, nonlinear Maxwell stress induces strong shear of the plasma filaments. As a consequence, heat and particle are expelled from the separatrix, resulting in PBM crashes with large heat flux at SOL [32, 38]. Figure 6(b) shows the change of density and temperature pedestal from the simulation. Both pedestals are collapsed as PBM crashes occur. For example, heights of density and temperature pedestal decreased by 26% and 21%, respectively. The stored energy also decreased by ΔW ’z,N †5 7.1kJ in the same time which is closed to the experimental value
ΔW ’z, ˆ‰ 5 7 ±2#kJ . Since the magnitude of the crash increases with mode amplitude in the
nonlinear phase, the ELM size also increases with Ž• B. Therefore, largest perturbed kinetic energy during the nonlinear phase, Ž• B,–—˜ is used to estimate the size of PBMs or ELMs in the later sections. From these results, we have produced PBMs in the linear and nonlinear phase which is relevant to the experimental conditions. Unfortunately, further comparison between simulation and experiment is difficult in this study because of the limits in the measurement and the simulation. The comparison between PBM simulation and experimental data in KSTAR is left as future work.
IV.
Effects of RMP on the plasma equilibrium
IV-1. Kink-tearing plasma response under RMP
We examined the response of plasma equilibrium (n=0 component) under RMP application. RMP in the JOREK simulation is treated by a similar approach as in Ref [19]. The vacuum RMP field for a given configuration is calculated with the ERGOS [34]. The computed boundary and vacuum flux for the n=2,
lyz{ 4kA, and odd RMP configuration in our modeling is presented in Figure 7. This field is applied as the boundary conditions on the computational domain for the perturbation. Here, the vacuum approximation is used because the boundary of the computational domain is far away from the separatrix. The perturbed boundary condition is gradually established with during 300-d. In this way, the penetration of the magnetic perturbation into plasma is produced in the self-consistent process.
Because, plasma response after RMP application is investigated in this section, only n=0 (equilibrium) and n=2 (RMP) harmonics are included in the modeling. The simulation shows nonlinear plasma response including change of both n=0 and n=2 components When RMP is established, the plasma perturbations are observed. The perturbed poloidal flux (Figure 8(a)), density (Figure 8(b)) and temperature (Figure 8(c)) are presented. As RMP penetrates the plasma, n=2 perturbations with m=9~14 occur in the edge region. The larger perturbations of temperature and density are observed at the X-point. In order to identify this response, the linear displacement ξš H is calculated from Ref [23], and this mode has an edge localized structure as shown in Figure 9 with kink-peeling mode (KPM) [22-24, 39] characteristics. Notice that, the n=2 mode is linearly stable in our case, and we can say that RMP nonlinearly drives the n=2 KPM. This result is consistent with the previous studies where peeling-like mode was observed in the response under RMP [40-42]. Interestingly, perturbed radial E B flow is generated at the edge region due to KPM. It results in n=0 conductive flux Γ œ in the radial direction. The distribution of Γ œ driven by KPM can be found in Figure 8(d). Large Γ œ layer exists at • 0.98~1.0 and is widely distributed over all poloidal angle. It has largest value at the X-point which agrees with the mode structure of KPM. This widely distributed Γ œ increases radial transport in the pedestal. The formation of convection flux is also consistent to similar numerical study [44, 44]. In addition to the KPM-like plasma response, the magnetic island can be formed due to RMP field penetration. However, the plasma shielding current that suppresses the field penetration can occur, and it reduces the island size. This shielding effect is the result of the plasma flow and the low resistivity of core plasma [14-20]. RMP cannot penetrate the plasma when plasma has zero resistivity or infinite rotation [45, 46]. The calculated field penetration is given in Figure 10. Fourier decomposed perturbed poloidal flux (Figure 10(a)), and plasma current (Figure 10(b)) is plotted on the poloidal mode number versus • space. The field penetration is almost blocked on the rational surface (red line) due to the formation of shielding current at each resonant surface. Therefore, only small islands remain in the core region. On the other hand, significant field penetration is observed in the edge region. Since plasma resistivity is relatively large in this region, the perturbed current cannot entirely shield the external field [17]. Also, zero-perpendicular electron flow 2,& 5 0 layer exists near the rational surface at • 0.95 which corresponds to the pedestal top in our case. Due to 2,& 5 0 layer, the external field can fully penetrate in this region [15, 18-20] and generate large magnetic islands. Furthermore, the magnetic perturbation is amplified by the poloidal coupling with kink component, and KPM enhances the field reconnection at the plasma boundary [24, 47]. Therefore, the large island can remain in the pedestal region and the stochastic layer occurs with islands overlap. This result can be confirmed in the Poincare plot (see Figure 11). Here, žŸIJ is defined as
žŸIJ tanSc¡¢ ¢†£Ÿ
where †£Ÿ and ¢†£Ÿ is the location of magnetic axis in (R, Z) coordinates. In the plot, large island structures at the resonant surfaces (q= 7/2 and 8/2) near the pedestal top are found while island size at the inner region (q=6/2) is much smaller. Secondary island structure at q=11/4 is also generated. For
0.95 ≤ • ≤ 1.0, the stochastic layer exists. This layer can increase the radial transport.
In summary, KPM and the magnetic islands occur as a plasma response under external field perturbation. These plasma responses generate the convection and stochastic layer in the pedestal region which can lead to increased radial transport.
IV-2. Mean profile variation with RMP
Increased radial transport due to kink-tearing response to RMP can lead to degradation of the mean (n=0) pedestal gradient and stabilization of edge MHD modes. To investigate the variation of mean profile under RMP, plasma responses to 0 ≤ lyz{≤ 4kA are calculated. Figure 12(a) shows the degradation of mean pedestal profiles of density and temperature. As the amplitude of the RMP field increases, the gradient of both %& and ' pedestal decreases. For example, %I and ' at the center of the pedestal ( • 0.98) decrease by 58% and 39%, respectively, as lyz{ 4kA is applied. Here, the yellow colored area and the green colored region corresponds to the stochastic layer and the location of convection (Γ œ) layer at the midplane of LFS, respectively. The overall degradation of %& and ' pedestal appears in the stochastic layer because of the increased radial transport. In the convection layer, on the other hand, the change in %& pedestal is significant, but that of ' pedestal is small. It shows that Γ œ which is driven by KPM has more significant effect on particle transport. In our case, 80% of total radial particle flux at the center of the pedestal is due to Γ œ. Experimental findings show that the density pump-out under RMP is highly correlated with X-point deformation [22, 48]. Since KPM makes large displacement at the X-point, it may play an important role in the density pump-out, which is consistent with the tendency of experimental findings [21, 39]. Figure 12(b) shows more clear correlation between pedestal degradation and radial transport. It shows, the radial heat and particle flux at • 0.98 of the LFS midplane start to increase with lyz{ while the gradients of both %& and ' pedestals decrease. Therefore, we conclude that n=0 mean pedestal profile is degraded by the plasma response induced by RMP.
To verify the modeling of RMP, the experimental data and simulation are compared. Because of the limitation in the diagnostics, only ' and V~ from CES measurement are mainly considered. The results are presented in Figure 13. Inverse gradient lengths of the temperature §ScM (Figure 13(a)) and the toroidal rotation §ScD (Figure 13(b)) at • 0.98 are plotted for different RMP coil currents. In CES measurement (blue circle), both ¨§ScM ¨ and ¨§ScD ¨ decrease with the external field strength. ¨§ScM ¨
and ¨§ScD ¨ decrease approximately by 30% and 38%, respectively, as lyz{ increases from 2kA to
4kA. In the simulation (orange triangle), §ScM shows similar behavior with the experiment. It varies
from -32 to -22 for the same change in lyz{. We note the simulation result does not include the effect of harmonics with high n (>10) and micro-instabilities on the RMP-driven transport. The assumption of ' 'I is also used. Therefore, only qualitative agreement between experiment and simulation can be confirmed. For the toroidal rotation, the discrepancy between the measurement and the simulation is found. The change in §ScD~ with lyz{ is small and does not follow the experimental trend where the
~ pedestal is degraded with increasing lyz{. Disagreement is also found in the line average density %u& and the stored energy Wz©ª . In the experiment %u& decreased by 2 10c«mSY from 3.55
10csmSY and W
z©ª is reduced by 8% as lyz{ increases from 2kA to 4kA . However, %u& and Wz©ª decrease by only 5 10cTmSY and 1% in the simulation, respectively.
The discrepancy between experimental and the numerical results can be related to several limitations of the simulation model. First, this study uses the simplified perpendicular diffusion profile and source models as already mentioned in Section II-2. Because the model cannot take into account the exact change of the core plasma transport, degradation of the plasma confinement with RMP can be smaller. Also, the profile stiffness has not been fully reflected in the simulation which is the crucial characteristic of the core transport. For the better result, accurate diffusion coefficient and the source profile based on the experimental data should be considered. Second, the edge transport induced by RMP is also underestimated. Previous numerical studies revealed that radial transport at the pedestal region could be increased because of the destabilized micro-instabilities [25, 26, 49] and edge localized ballooning modes [27, 28]. Neoclassical transport [50, 51] and magnetic flutter [52, 53] can be also induced by the perturbed magnetic field structure. Besides, we apply the Braginskii model in the stochastic layer, which can underestimate the radial heat flux [54]. Because these effects are not included in this work, the heat and particle flux may be undervalued. As a result, the pedestal degradation in the modeling can be smaller than that of the experimental measurement. Lastly, the fixed boundary model is used to calculate the RMP field penetration. This condition does not allow the modification of the magnetic perturbation at the boundary. Therefore, it may reduce the field amplification inside the plasma and modification of LCFS, which lessen the change of pedestal profile. In the future work, these limitations in the transport and fixed boundary model will be resolved with JOREK-STARWALL [55], which allows the variation of the perturbed field at the boundary.
V.
Effects of RMP on PBMs
V-1. Suppression of PBM under RMP
In this section, PBMs with n ≤ 14 are included in the simulation to study the effect of RMP induced plasma response on PBMs. Note that n > 14 modes are also linearly unstable, and the n 12 mode is most unstable mode. Since the growth rate of n 10 is similar to that of n 12 and low n modes are dominant in the nonlinear phase, it is decided to exclude n > 14 modes to meet the limit of our computing resource. Also, previous numerical modeling [56] revealed that the n = 2 structure induced by RMP suppresses the growth of odd modes and only even modes play dominant role in the nonlinear phase when RMP is applied. Therefore, n 2, 4, 6, 8,10,12 and 14 modes are considered in our study. Nevertheless, the main limitation of this study is that only a small number of modes are considered
To study the direct effect of RMP on PBMs, we first calculate the evolution of the n 0 and 2 modes under RMP for *~800-d with the same method described in Section IV. Then, n 4, 6, 8,10,12 and 14 are added with an initial amplitude imposed by the coupling with n = 2 to see how PBMs interact with RMP. The simulation results for the case with lyz{ of 1kA (Figure 14(a)), 2kA (Figure 14(b)), and 4kA (Figure 14(c)) are presented. The orange dotted line in the figure indicates the largest
Ž• H,†£ˆ in the natural PBM simulation. For lyz{ 1kA, PBMs of n=8 and 10 exponentially grow
in the linear phase and show bursty behaviors at nonlinear phase. When RMP of lyz{ 2kA is applied, overall mode amplitude during the nonlinear phase decreases by 30%. The dominant mode also changes to n=4-6. This is due to interactions between n=2 RMP driven mode and PBMs. It is consistent with the report that the modified field structure induced by RMP changes the dominant mode number to lower n [28]. However, there is still considerable mode crash in the nonlinear phase, and filaments are expelled similarly as in the natural PBM case, but with smaller amplitudes. Therefore, PBMs are mitigated in this case. In comparison, PBMs are suppressed with lyz{ 4kA. Most unstable mode changes to n=4 and shows only several tiny mode crashes. Then, all modes are saturated and remain at the same level without any bursty behavior. Their saturated value is similar to initial amplitude imposed by the coupling with n = 2. Note that ELMs are suppressed in the experiment with lyz{~3.7kA, which agrees fairly well with our modeling results.
The effect of RMP on the heat flux at the divertor during ELMs is also investigated. Figure 15 shows the modeling of instantaneous ELMy peak heat flux -†£ˆ on the lower-outer divertor plate during the mode crashes. In this comparison, the background flux is removed. When RMP of lyz{ 2kA is applied, -†£ˆ decreases by 28% from that of natural PBM case. For lyz{> 2kA, -†£ˆ starts to change drastically and eventually decreases by 90% at lyz{ 4kA where PBMs are suppressed. Because -†£ˆ for lyz{ 4kA is less than 25 % of the background heat flux, it is negligible in this context. Therefore, we can say that suppression of PBMs results in significant reduction in heat flux,
and this trend agrees with the experiments [57, 58].
The background heat flux increases by 50% from the reference at lyz{ 4 kA. It is mainly due to the increased radial transport from the core to SOL which is consistent to experimental trends [58-60]. Although it is not shown here, the striation pattern of divertor heat flux is not apparent in our case as tangle structures [19] are not large enough to affect the heat flux, which is induced by RMP. Detailed analysis on the effect of tangle structures in divertor heat flux of KSTAR will be included in the future study. Notice that, there is lack of diagnostics, and the KSTAR divertor configuration is not considered accurately in the modeling. As a consequence, direct comparison of simulation with measurement of divertor heat flux is difficult, and it should be also included in the future work.
In the experiments, the ELMy heat flux during the ELM mitigation usually smaller [61] than that of natural ELM which is consistent with above results. However, the simulation result shows the possibility of increased ELMy heat flux during the mitigation phase. It is related to the fact that divertor heat flux depends on not only amplitude of mode crash but also toroidal mode n of most unstable PBM. For example, peak ELMy divertor heat flux tends to increase as the dominant mode n becomes lower [62]. Since amplitude and mode n of PBMs decrease simultaneously in the ELM mitigation case, non-monotonic tendency of ELMy heat flux may be found in the mitigation case. Also, the stochastic field and tangle structure caused by RMP increase the divertor heat flux. However, they cannot be properly considered in this modeling because accurate source and diffusion profiles are not included. Further studies will be required for the improved modeling of divertor heat flux.
V-2. Effect of mode coupling on the ELM suppression
The crash of PBMs is significantly reduced when RMP of sufficient strength is applied. Suppression of PBM with the perturbed field can be related to the degraded mean pedestal which is the source of the instability. It can be also the result of increased mode coupling of PBMs (n>2) and RMP induced plasma response (n=2) which has been found in the previous studies [56, 63]. To find the main factor of mode suppression, PBM stability is investigated with degraded mean density and temperature profile while mode coupling of PBMs and RMP is excluded. This is done as the simulation with a pressure gradient and current density modified to the same level as in the ELM suppression case (lyz{ 4kA ), but without applying RMPs. As shown in Figure 16(a), the linear growth rate of PBM decreases more than 60% for all mode n as compared to the case without pedestal degradation. However, PBM is still nonlinearly unstable, and significant mode crash occurs despite small growth rates. In Figure 16(b), mode saturation is possible only when mode coupling is included. It shows that mode coupling has dominant effect on the ELM suppression of our case rather than reduced destabilizing source with pedestal degradation.
Evidence of strong mode coupling between PBMs (n>2) and RMP (n=2) during the mode suppression can be found in Figure 14(c). In the early phase, n=4 mode rapidly grows and reaches Ž• H 5 2
10S«. Then, n=2 mode induced by RMP starts to increase, and it is followed by a decrease of n=4 mode.
After that, n=2 mode decreases while n=6 mode starts to grow, and similar patterns are repeated. There can be an energy exchanges between PBMs and n=2 mode. Here, n=2 mode helps PBMs to share energies among themselves by extracting the energy of the rapidly growing mode and by spreading it to others. Because the energies of PBMs are evenly distributed to harmonics, a single mode cannot grow too large to crash. Therefore, RMP acts to increase the couplings between different mode numbers of PBMs and results in states with saturated or suppressed modes. In this point of view, our result is consistent with the previous study that bursty mode crash disappears when mode couplings between PBMs are numerically reinforced [64].
V-3. Locking of PBM with RMP
We found that there is a large change in the rotation of the mode when ELM suppression is achieved in the modeling. Figure 17(a) presents the poloidal rotation of the most unstable mode (n>2) for different RMP coil current. e,†J‡I is the poloidal rotation at the midplane of LFS, and it is derived from the simulation (in Lab frame) during the nonlinear phase. In the natural PBM case, mode shows very oscillatory behavior as the result of nonlinear interaction. The oscillation of e,†J‡I decreased overall for lyz{ 2kA. For lyz{ 4kA case, modes are initially rotating, but they start to slow down until they stop rotating at *~1300-d . They remain nearly static. Unlike e,†J‡I , the poloidal E B rotation e, continues to increase. Although it is not shown here, e, at the center of pedestal ( ®
0.98) changes from 3km/s to -10km/s (ion-diamagnetic direction) as lyz{ increases to 4kA. It shows that RMP brakes PBMs and this is a prominent feature that distinguishes ELM suppression from mitigation. The sudden braking of edge localized mode after a transition from ELM mitigation to suppression was also observed in the experiments [65, 66] and numerical study [56]. These modeling and experimental results may indicate that the ELM suppression regime consists of static saturated PBMs while they are of rotating in natural or mitigated ELMs. Unfortunately, the mechanism of the mode braking is unclear. Previous numerical studies [56] try to explain the mode braking with RMP induced electromagnetic torque [14]. The reduction of perpendicular electron flow is also observed in our modeling which is consistent with these studies. However, there is no direct evidence and quantitative explanations for mode braking with RMP induced torque yet. Further study on the PBM locking will be needed.
To understand the role of mode braking in the ELM suppression, we investigate the effect of e,†J‡I on the mode coupling. In our modeling, a single harmonic is described as
In Eq. (11), ¯B , ¢# and cosine term catch the poloidal and toroidal variation of mode, respectively. The mode coupling is affected by their relative spatial position, and it is related to the relative phase difference Δ° °B °B±#. In the previous section, we concluded the suppression of PBM may be the result of energy exchange of n=2 RMP induced mode and PBMs (n>2). Steady energy transfer between modes is vital in this respect. However, if Δ° keeps changing, energy transfer will be suppressed. For example, when we consider the momentum equation, nonlinear terms in )= H depends on cos´°Bc °B µ where % %c % . Since ∂·Ž• H for mode n is proportional to H)= H, it is also affected by Δ° °Bc °B # . In addition, the time scale of Δ° is ~100-€ comparable to that of mode fluctuations. Therefore, Δ° should remain constant to maintain consistent energy exchange between modes. It is equivalent to keeping the spatial overlapping of mode structures. Because the RMP induced n=2 mode is static in space, and Δ° only depends on e,†J‡I of PBMs. To keep Δ° constant, very small e,†J‡I is needed, and mode locking can be advantageous to ELM suppression. In Figure 17(b), the phase difference (Δ°) between n=2 (RMP) and the largest harmonic of PBMs at the midplane of LFS is presented. During the nonlinear phase, it clearly shows how e,†J‡I affect Δ° . When lyz{ 1kA or 2kA. Δ° shows considerable variation because of the oscillatory e,†J‡I as already shown in Figure 17(a). For lyz{ 4kA (ELM suppression case), however, Δ° remains almost constant (~ 0.8) with locking of PBMs. Therefore, it can be suggested that PBM locking by RMP may increase the coupling of RMP and PBMs, resulting in mode suppression.
In the nonlinear phase, W,†J‡I can be expressed as
where W,®’ is the poloidal mode rotation that is generated by nonlinear interactions including RMP. Note that when W, increases, more lyz{ will be needed to drive W,®’ to make W,†J‡I vanish. In other words, locking the PBMs with RMP becomes more difficult with larger W, . For our suggestion to be valid, large W, will be disadvantageous to ELM suppression. To test this hypothesis, the effect of RMP on PBMs with increased W, is investigated. In this simulation, the n=0 component of W, at the center of the pedestal is increased from 3km/s to 15km/s while other conditions are fixed. The modified radial profile of W, at the edge region is shown in Figure 18(a). The maximum Ž• H,†£ˆ of PBMs in the nonlinear phase with corresponding lyz{ is presented in Figure 18(b). For the case of modified W, , mode amplitude remains almost unchanged for the natural and mitigated PBM cases. At lyz{ 4kA, the suppression of mode is not achieved and locking of PBM
¯H , ¢, # ¯B , ¢# cos´% °B , ¢#µ. (11)
does not occur either. While the pressure gradient at the center of pedestal decreases by 35%, it decreases by 28% in the case with modified W, profile. When W, is modified, 2,I 0 layer is pushed outward from ® 0.95 to 0.97, and the radial width of a stochastic layer is reduced. Thus, the degradation of the pedestal is relatively small. Our results showed that mode coupling plays a more critical role in ELM suppression than the decrease in the pedestal gradient. Therefore, this result may show that locking of PBM ( W,†J‡I → 0) is the main factor for the ELM suppression. Furthermore, small W, 5 0# in the pedestal region will be advantageous in terms of PBM locking, and it might be related to the importance of W, 5 0 in ELM suppression in experiments [67].
Ž• H of n=2 plasma response for applied RMP increases with modified ¨ W, ¨. It is possibly due to increased radial shear of Ve, which can destabilize the n=2 KPM. As it gets closer to the stability limit, RMP can induce larger plasma response. Similar phenomenon was found in the numerical study on QH-mode [68, 69], where KPM (or EHO) was destabilized by large E×B shearing rate. Therefore, W, can also affect the ELM suppression in terms of the plasma response induced by RMP.
VI.
Conclusion
With nonlinear modeling, we investigated the effect of n=2 RMP on the plasma equilibrium and PBMs in KSTAR. As RMP penetrated plasma, it induced kink-tearing response including KPM and magnetic islands on the plasma equilibrium. The plasma deformation and radial E B convection flow occurred at the pedestal. When RMP is applied, most of the external field was shielded in the plasma core, but considerable field penetration was observed at the plasma edge as finite plasma resistivity in this region reduced the shielding effect. Also, V2,I 0 at pedestal top ( • 0.95 ) strengthened the field penetration at the rational surface near the pedestal. As a consequence, the stochastic layer has been formed in • 0.95 1.0. Radial heat and particle flux increased with these plasma responses and resulted in the reduced pedestal gradient. Degradation of temperature pedestal showed good qualitative agreement between the modeling and experimental results. However, changes in the toroidal rotation and density pedestal were underestimated in the simulation. More accurate diffusion and source model will be needed to resolve these discrepancies.
In the modeling of PBMs with RMP showed that sufficient RMP could suppress PBMs. RMP of
lyz{ 2kA mitigated the bursty mode crashes, while the mode suppression was achieved at lyz{ 4kA. ELMs were suppressed with lyz{5 3.7kA in the experiment which agrees well with modeling
result. It turned out that the mode coupling between PBMs and n=2 mode induced by RMP is more important in mode suppression than the mean (n=0) pedestal degradation. RMP acts to enhance the
coupling between the harmonics of PBM and prevents a single mode from overgrowing. It allows saturation of modes rather than a mode crash.
The locking of PBM was observed during the mode suppression. It was the major difference between mitigation and suppression cases. Similar results were also found in the experiments and the numerical study, where the ELM suppression regime may have static saturated PBMs. We propose a model to explain the positive effect of PBM locking on the mode coupling and suppression. In our explanation, small W,†J‡I or W, at the pedestal is advantageous to ELM suppression as they can enhance the couplings between PBMs and RMP. It might be related to the experimental finding where W, 5 0 plays a significant role in ELM suppression. Further work will aim at producing more relevant RMP modeling to understand the mechanism of ELM suppression which will propose a reliable ELM-suppression criterion for ITER.
Acknowledgements
The first author would like to express the deepest gratitude to the Fusion and Plasma Application Laboratory (FUSMA) Team at Seoul National University for their kind support and fruitful discussions for this paper. This work was supported by the National R&D Program through the National Research Foundation of Korea (NRF), funded by the Ministry of Science, ICT & Future Planning (No. 2014-M1A7A1A03045368) and the R&D Program through the National Fusion Research Institute of Korea (NFRI) funded by the Government funds. The opinions included herein do not reflect those of the National Research Foundation of Korea.
References
[1] H. Biglari, P.H. Diamond and P.W. Terry, Phys. Fluids B 2 (1990) 1 [2] T. S. Hahm and K.H. Burrell, Phys. Plasmas 2 (1995) 1648
[3] K.H. Burrell, Phys. Plasmas 4 (1997) 1499 [4] J. W. Connor et al., Phys. Plasmas 5 (1998) 2687 [5] P. B. Snyder et al., Nucl. Fusion 44 (2004) 320
[6] A. Loarte et al, Plasma Phys. Controlled Fusion 45, 1549 (2002) [7] G. T. A Huysmans et al, Nucl. Fusion 53, 123023 (2013) [8] Y. Liang et al., PRL 98 (2007), 265004
[9] A. Kirk et al., PRL 108 (2012), 255003 [10] T. E. Evans et al., PRL 92 (2004), 235003 [11] Y. M. Jeon et al., PRL 109 (2012), 035004
[12] W. Suttrop et al., Plasma Phys. Control. Fusion 59 (2017), 014049 [13] Y. Sun et al., PRL 105 (2010), 145002
[14] R. Fitzpatrick et al., Phys. Plasmas 5 (1998), 3325 [15] M. Heyn et al., Nucl. Fusion 54 (2014), 064005 [16] E. Nardon et al., Nucl . Fusion 50 (2010) 034002 [17] M. Becoulet et al., Nucl. Fusion 52 (2012), 054003 [18] N. M. Ferraro et al., Phys. Plasmas 19 (2012), 056105 [19] F. Orain et al., Phys. Plasmas 20 (2013), 102510 [20] R. Nazikian et al., PRL 114 (2015), 105002 [21] C. Paz-Soldan et al., PRL 114 (2015), 105001 [22] Y. Liu et al., Nucl. Fusion 58 (2016), 114005 [23] N. M. Ferraro et al., Nucl. Fusion 53 (2013), 073042 [24] F. Orain et al., Nucl. Fusion 57 (2017), 022013 [25] T. M. Bird et al., Nucl. Fusion 53 (2013), 013004 [26] I. Holod et al., Nucl. Fusion 57 (2017), 016005 [27] M. Willensdorfer et al., PRL 119 (2017), 085002 [28] M. L. Mou et al., Physics of Plasma 25 (2018), 082518
[29] G. T. A Huysmans et al., Plasma, Phys. Control. Fusion 51 (2009) 124012 [30] T.A.Gianakon et al., Phys. Plasams 9 (2002), 536
[31] C.E.Kessel et al., Nucl. Fusion 34 (1994), 1221 [32] M. Becoulet et al., Nucl. Fusion 57 (2017) 116059 [33] J. Lee et al., Nucl. Fusion (2018), 066033
[34] Y. M. Jeon et al., PRL 109 (2012), 035004 [35] L. L. Lao et al., Nucl. Fusion 25 (1985), 1611 [36] Kim M. et al., Nucl. Fusion 54 (2014) 093004
[37] R. Hager and C. S. Chang, Phys. Plasmas 23 (2016), 042503 [38] S. Pamela et al., Plasma Phys. Control. Fusion 58 (2016) 014026 [39] P.B. Snyder, et al., Nucl. Fusion 49, 961 (2007)
[40] R. A. Moyer et al., Nucl. Fusion 52 (2012), 123019 [41] Daisuke Shiraki et al., Phys. Plasmas 20 (2013), 102503 [42] C. Paz-Soldan et al., Nucl. Fusion 56 (2016), 056001 [43] E. Nardon et al., Phys. Plasmas 14 (2007), 092501
[44] M. Leconte and J.-H. Kim et al., Phys. Plasmas 22 (2015), 082301 [45] Y. Liu et al., Phys. Plasmas 17 (2010), 122502
[46] S. R. Haskey et al., Plasma Phys. Control. Fusion 57 (2015) 025015 [47] G. T. A. Huysmans et al., Plasmas Phys. Control. Fusion 47 (2005) 2107 [48] Y. Liu et al., Nucl. Fusion 51 (2011) 083002
[49] G.J, Choi and T.S. Hahm., Nucl. Fusion 58 (2018) 026001 [50] W. Zhu et al., PRL 96 (2006) 225002
[51] J.-K. Park et al., Phys. Plasmas 16 (2009), 056115 [52] F. L. Waelbroeck et al., Nucl. Fusion 52 (2012) 074004 [53] J.D. Callen et al., Nucl. Fusion 53 (2013), 113015
[54] T. Rhee et al., Nucl. Fusion 55 (2015) 032004
[55] M Hölzl et al., Journal. Phys: Conf. Series 401 (2012) 012010 [56] F. Orain et al., Phys. Plasmas 26 (2019) 042503
[57] T. E. Evans et al., Journal of Nucl. Materials 337-339 (2005), 691 [58] M. W. Jakubowsku et al., Nucl. Fusion 49 (2009) 095013 [59] A. J. Thornton et al., Nucl. Fusion 54 (2014) 064011 [60] Y. In et al., Nucl. Fusion 57 (2017) 116054
[61] A. J. Thornton et al., Journal of Nucl. Materials 438 (2013), S199 [62] J.-W. Ahn et al., Nucl. Fusion 54 (2014) 122004
[63] M. Becoulet et al., PRL 113 (2014) 115001 [64] P. W. Xi, et al., PRL 112, 085001 (2014) [65]J. Lee et al., PRL 117 (2016) 075001
[66]J. Lee et al., “Bifurcation of perpendicular rotation and field penetration at the transition to RMP induced ELM crash suppression,” in 27th IAEA International Conference on Fusion Energy (Ahmedabad, India, 2018), p.EX/P7-13
[67]C. Paz-Soldan et al., Nucl. Fusion 59 (2019) 056012 [68] G.S. Xu et al., Nucl. Fusion 57 (2017) 086047 [69] F. Liu et al., Nucl. Fusion 60 (2018) 014039
Figure 1. Time evolution of (a) plasma current l‰, RMP coil current lyz{, (b) 9¹ signal, line average density %uI, stored energy Žz©ª, (c) Hs«, poloidal beta t‰, (d) core temperature of ion ' , electron 'I, and core toroidal plasma rotation ·J» of KSTAR discharge #18594 are presented.
Figure 2. Radial profile of (a) safety factor q (blue line) and position of rational surface (red dot) with n=2. (b) Radial profile electron temperature '& (red line), density %I (blue line) taken in modeling, with a comparison to the experimental measurements of '& (red dot), density %I (green dot). (c) Radial profile ion temperature ' (red line), toroidal rotation velocity ~ (blue line) taken in modeling, with a comparison to the experimental measurements of ' (red dot), density ~ (green dot).
Figure 3. Linear growth rate of PBM of most unstable mode in pedestal height and width space. The mode n of most unstable mode is also shown. Pink line and red line correspond to the pedestal height and width weight who has PBM of marginal stability and n=12 dominant mode, respectively. Yellow star and pink stars represent the reference point and the newly fitted pedestal which is used in the modeling, respectively.
Figure 4. Radial profile of (a) neoclassical coefficients f (red line) and Q,HIJ (blue line). (b) Radial profile of poloidal velocity e at the midplane of LFS with E B (green line), ion diamagnetic ∗ (red line), parallel ∥W (blue line), and neoclassical HIJ (orange line) components. (c) Poloidal distribution of toroidal plasma rotation velocity V||~ in R-Z space.
Figure 5. (a) 2D measurement of electron temperature fluctuation in R-Z space from ECEI diagnostics. It shows LFS region at consecutive times slices of Δt 60μs . (b) Simulation result of electron temperature fluctuation in R-Z space at two difference time slices with Δt 55μs near the onset of mode crash.
Figure 6. Time evolution of the toroidal harmonics of the kinetic energy n=2-10. It shows the nonlinear phase of natural PBMs without RMP.
Figure 7. Vacuum magnetic flux perturbation calculated with the ERGOS code. Position of the boundary of calculation domain is presented with blue dotted line.
Figure 8. Poloidal distribution of (a) n=2 magnetic flux ‰Jš , (b) electron density %I , and (c) temperature ' perturbation induced by RMP. (d) n=0 E B radial flux Γ2, œ which is driven by the RMP induced plasma response.
Figure 9. Radial mode structure of the plasma displacement ½2,¾¿À induced as response to RMP. The mode structure is highly localized at the plasma edge, which is the typical structure of KPM.
Figure 10. n=2 perturbation of the (a) poloidal magnetic flux δ ‰Jš and (b) current δ3~ as a function of the poloidal mode number m and the normalized flux •. In each figure, resonant surfaces are plotted with the red line and circles.
Figure 11. Poincare plot of the perturbed magnetic structure in ® and poloidal žŸIJ coordinate. The stochastic layer is formed at 0.95 ≤ ®≤ 1.0.
Figure 12. (a) n=0 profile degradation of electron density %I and temperature ' pedestal which is induced by RMP. The yellow and green colored region highlight the radial width of stochastic layer and E B convection layer, respectively. (b) Radial gradient of %I (red dotted line) and ' (blue dotted line) at the center of pedestal ( • 0.98) with varying lyz{. The conductive heat flux ΓÁJH‡ and convective particle flux ΓÁJHÂ at the same location are also presented as a comparison.
Figure 13. Experimental measurement of inverse gradient length of (a) ion temperature §ScM and (b) toroidal plasma rotation §DSc with increasing lyz{ are presented (blue dot). The red line corresponds to the trend line. Simulation results are plotted as orange triangles in each figure.
Figure 14. Time evolution of the toroidal harmonics of the kinetic energy n=2-10. Each figure corresponds to the case of PBM with lÃÄÅ equals to (a) 1kA, (b) 2kA, and (c) 4kA. Units are arbitrary but the normalization is the same in all cases. Here, n=2 mode is the RMP induced modes while all other modes are intrinsic component.
Figure 15. Time evolution of the ELMy heat flux at the lower divertor of the LFS. It shows that heat flux decreases with increasing lyz{.
Figure 16. (a) Spectrum of the linear growth rate. Red line and blue line are correspond to growth rate of PBM for reference equilibrium and for that with degraded pedestal (RMP induced), respectively. (b) Nonlinear evolution of W• H of n=10 component for the natural PBM (red line), for PBM with degraded pedestal (blue line), and for PBM with mode coupling including RMP (orange line).
Figure 17. a) Time evolution of the poloidal mode rotation e,†J‡I during the nonlinear phase. It shows
the e,†J‡I of the natural PBM (n=12, green line), PBM with RMP of lyz{ 2kA (n=6, blue line)
and lyz{ 4kA (n=4, red line). (b) Time evolution of the phase difference Δδ between n=2 RMP induced mode and most unstable harmonic component of PBMs for lyz{ of 1kA (n=6, green line), 2kA (n=6, blue line), and 4kA (n=4, red line).
Figure 18. a) Radial profile of E B poloidal rotation profile at the midplane of LFS. Profile of reference case (blue line) and modified case (red line) are presented. Here, the orange dotted line corresponds to position of the pedestal center, and ion-diamagnetic flow is in (-) direction. (b) Largest kinetic energy of PBMs during its nonlinear phase for various lyz{. The blue dotted line and red stars are corresponds to the reference and modified case, respectively.