HAL Id: hal-01292830
https://hal-brgm.archives-ouvertes.fr/hal-01292830
Submitted on 23 Mar 2016HAL is a multi-disciplinary open access archive for the deposit and dissemination of sci-entific research documents, whether they are pub-lished or not. The documents may come from teaching and research institutions in France or abroad, or from public or private research centers.
L’archive ouverte pluridisciplinaire HAL, est destinée au dépôt et à la diffusion de documents scientifiques de niveau recherche, publiés ou non, émanant des établissements d’enseignement et de recherche français ou étrangers, des laboratoires publics ou privés.
SEM techniques for the bio- and organo-mineral
interface characterisation in environmental science
Guillaume Wille, Caroline Michel, Jennifer Hellal, Annie Richard, A Burel,
Pierrick Ollivier, Louis Joly
To cite this version:
Guillaume Wille, Caroline Michel, Jennifer Hellal, Annie Richard, A Burel, et al.. SEM techniques for the bio- and organo-mineral interface characterisation in environmental science . EMAS 2016, European Microbeam Analysis Society, May 2016, Marcoule, France. �hal-01292830�
SEM TECHNIQUES FOR BIO- AND ORGANO-MINERAL INTERFACE CHARACTERIZATION IN THE
ENVIRONMENT
G. Wille*1, C. Michel1, J. Hellal1, A. Richard2, A. Burel3, P. Ollivier andL. Joly 1 BRGM, 3 avenue Claude Guillemin, BP 36009, 45060 Orleans Cedex 2 2 CME, University of Orleans,
3 University of Rennes Campus, 2 avenue du Pr Léon Bernard - CS 34317, 35043 RENNES Cedex
* e-mail: g.wille@brgm.fr
Introduction
Bacteria, both as planktonic cells or biofilms (group of microorganisms embedded in an exopolymeric matrix in which cells interactwitheach other) are involved in numerous processesinteracting with geological materials, i.e. rocks, soils, minerals… This has led scientists to focus on the effectsof such interactions on soils, rocks (for example, biomineralizationi.e. synthesis of a mineral by micro-organisms),and their potential applicationsfor industry or environment such as biolixiviationor bioremediation.
An example of bio-mineral interactions is biolixiviation. Biolixiviation is a natural process involving the attack of minerals by bacteria that can be exploited in the mining industry as an extraction method of metals from ore. The first example of natural biolixiviation was demonstrated by Arthur R. Colmer andM. E. Hinkle in 1947[1]. While studying the pollution of the river Ohio (U.S) by drainage water of coal mines, they noted evidence of a massive amount of sulphuric acid. This can be partially explained by the atmospheric oxidation of pyrite (FeS2), a
mineral species often present in coal but also by the presence of bacteria such asAcidithiobacillus
ferrooxidans orThiobacillus ferrooxidans, capable of oxidizing Iron (Fe2+) or sulphur (S2-). . Since then, several studies have been conducted on the use of biolixiviation for the extraction of metals of strong economic or technological interest such as gold, cobalt, uranium, zinc or copper from ores. These studies have led to the development and exploitation of biolixiviation in industrial processes [2,3,4,5].
Microbial-mineral interactions are also now strongly involved in bio-remediation processes. Bioremediation is the decontamination of polluted environments by techniques involving biochemical activity or properties of living organisms.As an example, the ability of biofilms to interact with pollutants or to catch them in their spatial structurecan be used for remediation. But in some cases, biofilms can have a negative impact on the bioremediation process (mainly biofouling that inhibitswater purification [6]). In this context, part of this work is the evaluation of the interactions of multi-species biofilms with metals (presently iron nanoparticles) and sand, and its impact on depollution processes.
The microbial-mineral interface usually requires micrometric or nanometric scale observations; electron microscopy is thus an observation and analysis technique perfectly suited for that.However electron microscopy applied to living samples is faced by numerous technical challenges includingthe hydrated state of the initial sample, degradation of the sample during drying, freezing... and finally a high sensitivity to electron beam. Thus specific techniques are
required for maintaining water or removing it with adapted protocols. The first experiments on STEM in “wet” environmental cells (with water or gas) were reported by M. Von Ardenne at the late 30s [7]. In 1970, the first SEM images of a hydrated sample were reported by W. C. Lane [8], using a specimen stub with a water reservoirwhich ejected a vapor jet to maintain a humid gas layer over the specimen, with no othermodification made to the microscope. Since then the interest of scientists concerned by life science for electron microscopy has grown continuously. We applied conventional, low vacuum and cryo-SEM, STEM-in SEM and TEM techniques for the observation of biofilms involved in bio-remediation processes in interaction with mineral and metallic materials.For this, appropriate procedures and protocols were applied or adapted to address the different problems caused by these specific samples made of a mixture of “soft” hydrated biological samples and “high hardness” mineral particles. These observations enabledto understand the behavior and the internal structure of biofilms in contact with mineral or metallic particles, and the ability of biofilms to fix iron nanoparticles or to bind to sand particles.
I – Materials and methods
The first challenge for good quality SEM/TEM observations of bio-mineral interfaces is sample preparation.
For biologicalsamples alone, several preparation and observation methods have been developed and evaluated in the last years [9,10].
Conventional SEM
Conventional SEM observation of biological samples, especially biofilms, is limited by the requirement of sampledehydration during preparation. As biofilms consist mainly of water, dehydrationmight alter its structure and morphology.Conventional SEM requires a complex and multi-step preparation which involves fixation, dehydration, drying, and coating with metal or carbon. All these steps may incur damage to samples and morphological information can be altered. For instance, hydrated biofilm is subjected to glutaraldehyde fixation and postfixation (osmium tetroxide), followed by ethanol or acetone dehydration, critical-point drying (CPD), and metal coating. The fixation with crosslinking agents (i.e. glutaraldehyde fixation) is used to stabilize the network structure of the biofilm. This step, together with the post-fixation, is designed to prevent breakdown of biological structures. But in some case,swelling or shrinkage at the same time is reported by some authors [9]. The last step of this preparation is coating, which can createdistortion due to the energy dispersed by carbon evaporation or plasma, depending on the type of coating and the performances of the coating system. This step can be deleted by using a low vacuum SEM (LV-SEM), but the small size of bacteria embedded in the biofilm requires high resolution imaging, for which a field emission low vacuum SEM (FE-LV-SEM) is required. On the other hand, the use of low vacuum conditions is known to cause more or less significant reduction in image resolution.
Desiccation followed by high/low vacuum SEM can collapse EPS matrices which, in turn,deform biofilm appearance. Alternatively, “wet” Environmental Scanning Electron Microscopy (ESEM) can be performed without biofilm drying.In ESEM, specimens are imaged at a moderate vacuumwithout conductive coating and in a water vaporatmosphere which better preserves the biofilm structure. This approach was not evaluated in this study.
Cryo-SEM
Cryo-SEM is widely used for the observation of biological samples. The sample is frozen in a suitable device in order to maintain water in the sample for SEM observations. Due to the high volume of solid crystalline water (ice)compared to liquid water, the sample has to be cooled as fast as possible otherwise the sample can be deformed by ice crystallization. The goal is to obtain amorphous or nano-crystalline water. The sample is frozen by plunging in a convenient medium, such as liquid ethane (or propane) cooled at liquid nitrogen temperature (-210°C) or sub-cooled nitrogen (nitrogen slush). Some other technical solutions can be used, such as cooling between 2 copper plates, projection on a copper plate cooled at liquid nitrogen temperature. The sample is then transferred on the cold stage of the SEM. Fracturation of the sample and/or sputter coating (gold, platinum) can also be performed if necessary in the cryo-SEM preparation chamber. Two different SEM options were used for our study. The first solution for cryo-SEM is the use of a “conventional vacuum” FE-SEM (Hitachi S4500 cold-FEG SEM equipped with a Quorum Technology Polaron LT 7400 – fig. 1-a). The sample is frozen in nitrogen slush at -210°C, and then transferred in the preparation chamber. Cryo-fracturation (if necessary) is processed in the preparation chamber at -180°C to prevent sublimation of water contained in the sample. Then, SEM observations were performed at -108°C under low voltage (1 kV) using a SE detector. A pre-observation step at -70°C is applied to remove the ice layer formed during the transfer on the surface of the sample. These conditions give good quality SE images, but are problematic to perform BSE images and EDS analysis.
Fig. 1: (a) Cryo-chamber on a Hitachi S4500 (CME - Univ. Orleans) (b) Peltier stage on a Tescan Mira3XMU (BRGM Orleans)
(c) Water phase diagram and area of use of the Peltier stage under LV conditions
The second solution is the use of a Peltier stage (up to -50°C) in a low vacuum SEM (Tescan Mira3XMU equipped with Edax Team EDS system – see fig. 1-b). The sample is frozen then transferred on the cooled stage under low vacuum conditions. Due to the temperature / pressure
stability diagram of water, solid water can be keep at higher temperatures than in the conventional vacuum SEM by using gas pressure in the SEM low vacuum chamber (typical conditions used are -40/-50°C and P = 80 Pa nitrogen). Any high voltage (HV) can be used to perform observations using the SE and BSE detectors of the SEM. EDS analysis is also available (taking into account limitations imposed by low vacuum conditions). However, this results in a loss of resolution due to the level of gas pressure in the SEM chamber. This can be detrimental to the observation, for example in the case of labeling by gold-conjugated aggregates.
STEM-in-SEM and (S)TEM
The STEM concept was described by von Ardenne in thelate 1930s[7].He performed a STEM modeexperiment in 1938, by adding scan coils to a transmissionelectron microscope.Using the transmission mode in a scanning electronmicroscope, both contrast and resolution are improved dueto the lower accelerating voltages, which increase the cross-sectionsand reduce the interaction volume of the incidentelectron beam [11,12]. High contrast results from the use of low voltages. On the other hand, highresolution is available thanks to limited interaction volume and low chromatic aberration[13].STEM implemented in a FE-SEM is an option now offered by mostSEM manufacturers. In addition to the flexibility of SEM for nanometric resolution imaging, ease of use (compared to TEM) allows to extend the usefulness and capabilities of the SEM. However, imaging resolution is limited by thespatial broadening of the electron probeat the exit surface of the sample [12].
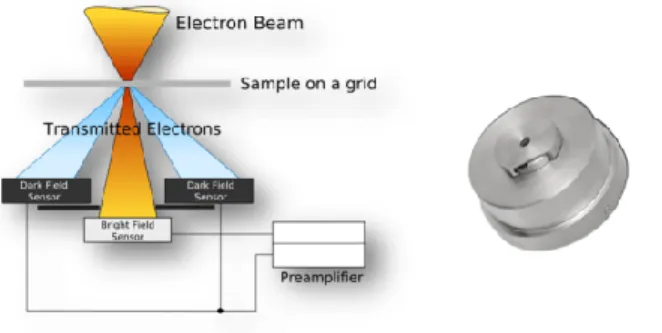
Due to a limited need for high resolution and, conversely, a significant need for contrast, STEM-in-SEM is well suited to the observation of low-Z samples [14,15,16], which is the case ofbiological samples. For this study, a STEM detector is used in a LV-FE-SEM (Tescan Mira3XMU equipped with Edax Team EDS system) using bright and dark field imaging in combination with SE and BSE detectors. A schematic view of the STEM detector is presented below (fig. 2). EDS punctual analysis is used to identify individualparticles, but mapping is not really possible, due to the non-optimized configuration of EDS systems in SEMs compared to TEM.
Fig. 2 : Schematic view of the STEM detector (doc. Tescan)
These observations were completed by TEM observations in combination with EDS and EELS analysis. These observations were performed on a Philips CM20 LaB6 and a Jeol ARM 200F
II – Application to the study of biofilm / mineral particles interface
Objectives and electron microscopy requirements
Managing soil and water contamination problems is faced with new methods for « in-situ remediation ». For this, the high reactivity and the large surface/volume ratio of materials with specific properties (active coal, nanoparticles) may offer benefits compared to existing solutions.
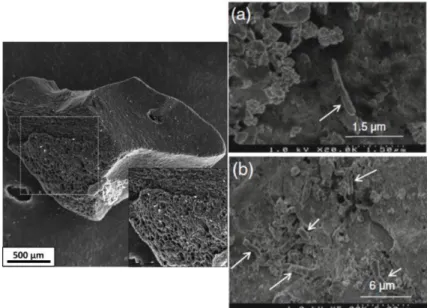
As an example, the high surface/volume ratio of an activated carbon grain is presented on fig. 3. The fixation and development of a biofilm on an activated carbon grain is presented on Fig. 3 (a) and (b). As illustrated by fig. 3 and detailed in Mercier et al. [17], grain surface is gradually covered by a biofilm. This occursin three steps: initial fixation of individual bacteria on the grain surface,increase in biomass and modification of bacterial diversity, and finally, development of the exopolymeric matrix [17]. In this particular case, we concluded that the development of the biofilm on activated carbon grains did not preventPolychlorinated Biphenyls (PCBs) adsorption on activated carbon in polluted aquatic sediments.
Zero-valent Iron nanoparticles (Fe0 NPs) have demonstrated in-vitro their efficiency in degrading problematic contaminants (nitrates,chlorinated solvents…). But in decontamination conditions, it has been evidenced that the efficiency of Fe0 NPs is dependent of their reactivity towards the contaminant as well as their accessibility to contaminants. Laboratory studies were conducted in order to observe interactions between Fe0 NPs and multi-species biofilms in the context of a European project (FP7 Nanorem) evaluating impact of biofilm on NP mobility and reactivity.In this framework,biofilm interactions with NPs were evaluated using various microscopic approaches. Biofilm growth, sampling, labelling and treatment strategies were developed for biofilm analysis for each type of microscopy to access the surface or inside of the biofilm, biofilm composition, and metal location.
The size of the bacteria and EPS filaments in the biofilm is on the order of a few microns at most. These dimensions are difficult or impossible to observe by optical microscopy. Several electron microscopy techniques available in the SEM were applied: cryo-SEM, STEM-in-SEM, TEM. Due to the specificity of the samples and the presence of mineral particles, specific preparation protocols are required.
Fig. 3 : Cryo-SEM observation of an active coal grain porosity and development of bacteria on activated coal grains after
(a) 2 days and (b) 30 days (bacteria location is indicated by white arrows) ([17])
Culture and sampling of biofilms
The growth of biofilms was conducted in PVC tubes (fig. 4). The main advantage of such support is the opportunity to easily and quickly obtain a large amount of biological material. In a first step, biofilms were growth during 2-3 weeks without NPs in order to adjust culture and sampling parameters. For this, PVC tubes were inoculated with aquifer water spiked with a nutritive solution to enhance denitrification [21]. In a second timenanoparticles were introduced. Tubes were placed in a temperature-controlled chamber at 20°C during biofilms culture.
Fig. 4: Biofilm culture in a PVC tube
Biofilm sampling can be achieved by scraping tubes with a sterile scalpel. But in many cases, this was not possible so a protocol based on the use of a gelatin / agarose gel was used[18]. This protocol enables to observe the internal face of the biofilm while the “scalpel” protocol is used for observing thebiofilm surface.
Depending on the observation objectives, labelling with lectins coupled to gold particles (15 nm) was applied to the sample before SEM observations according to Michel et al [19].Lectin-Au labelling is applied to locate exopolysaccharides. For this reason, the same lectines as those used for fluorescence microscopy were chosen(PNA and ConA – EY laboratories, USA), a gold aggregate is attached to the lectines instead of a fluorochrome [22].Other labelling may be considered, such as FISH probes coupled with gold [20] or heavy elements like Bromide or Iodine. Labelling is performed on the fresh biofilm after sampling. Biofilm is washed once using Phosphate Buffered Saline (PBS). Then the biofilm is covered with a solution of lectines coupled to gold clusters during 90 minutes in the dark. After removing the lectin-Au solution, the biofilm is washed 3 times using PBS buffer..For STEM, labelling was performed before glutaraldehyde fixation.For cryo-SEM observation, labelling was performed just before freezing on nitrogen slush.
For STEM-in-SEM and TEM observation, sample is fixed in glutaraldehyde (2.5%) in Cacodylate (Caco) Buffer 0.15 M at pH 7.2, postfixed in Osmium tetroxide (Caco buffer), then included in Agar-Agar and progressively dehydrated with acetone. The sample was finally included in Epon and cut on a Leica UC6 microtome at 80nm. For STEM-in-SEM observation, samples are coated with 2 nm Carbon in a Cressington 208C or 0.5 nm Pt/Pd in a Cressington 208HR. Indeed, non-coated cuts do not support the electron beam energy then a serious degradation, even the formation of a hole, is observed when increasing magnification.
Results and discussion - Cryo-SEM observation
Cryo-SEM was applied to observe biofilm development and location of lectins-Au labelling andFE0 NPs nanoparticles, and also to observe bacterial attachment on sand grains. For this, samples were frozen in nitrogen slush. Observations were performed on a cold-FEG SEM at low HV, and on a LV-FE-SEM at high HV for BSE and EDS. We established that a fresh biofilm frozen in nitrogen slush can be kept in liquid nitrogen for few days before observation. SEM observations were performed on bulk samples with or without fracturation in the preparation chamber. Secondary electrons enable to observe the organic moleculesand thus biofilm on its own, biofilm colonization of sand grainsand their interactions with NPs. In contrast, the location of lectin-Au labelsand iron NPs is more efficient using backscattered detector.
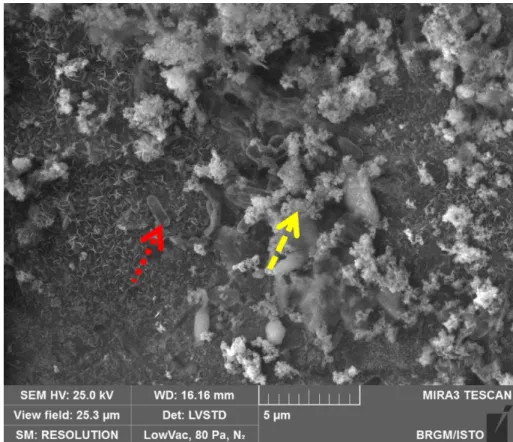
Biofilms in contact with iron NPs or lectin-Au labelling observed by cryo-SEM are presented on fig. 5. SE image (fig. 5) clearly shows the organization of the biofilm on the sand grain, and the iron NPs interaction with bacteria. It appears that NPs remain aggregated and do not disperse in the biofilm. This observation indicates that the biofilm / NP interactions are limited due to a low contact area.
Fig. 5: Biofilm growth on a sand grain in presence of iron nanoparticles (SE - -50°C / 80 Pa) - Dotted arrow: bacteria / Dashed arrow: NPs
However, few bacteria are visible on the cryo-SEM images. As shown on fig. 6, bacteria are visible, on sand grain surface (6-a). But surprisingly, a low number of bacteria are clearly visible. The biofilm mainly consisted of connected forms that englobe bacteria but without having the characteristics of distinguished single cells (6-b, 6-c). Fig. 6-d presents an accumulation of iron nanoparticles attached to the biofilm.
The main hypothesis is that these forms are bacteria embedded in an exopolysaccharide matrix, and cannot really be visible for this reason. Then cutting slices into the biofilm for TEM/STEM observation is the solution to conclude.
- STEM-in-SEM and TEM
STEM or TEM observation requires a specific sample preparation. But samples are very sensitive to preparation and conservation conditions before fixation. As an example, two images are presented on fig. 7. On fig. 7-a, a biofilm sampled a few days before fixation in glutaraldehyde is presented and compared to another sample (fig 7-b) prefixed just after sampling.
Fig. 7: STEM-in-SEM images of biofilms a/ sampling of the biofilm few days before fixation;
b/ sampling of the biofilm followed by fixation
On fig. 7-a, bacteria present an abnormal aspect, with distortions, degraded membranes, compared to bacteria on fig. 7-b, where the expected aspect is observed. These observations illustrate the need to pre-fix the biofilm with glutaraldehyde immediately after sampling. Samples were fixed with glutaraldehyde after lectin-gold labelling but without previously separating them from their support (PVC tube) although. It appeared that the biofilms then came off their support during the fixation process. However, this appeared to be an advantage for observations, since no manipulation had to be performed on fresh biofilm and therefore its structure has not been changed, and it was easier to make cross-sections on the fixed biofilm after its detachment from the growth support.
STEM observations were performed at various voltages. However, it appears that such biological samples are very sensitive to contamination at low voltage (10 kV or less), compared to higher voltage (20 – 30 kV) that were thus chosen for STEM imaging. Moreover, STEM resolution is strongly affected by HV value. Due to low mean Z of the biological sample (mainly composed of carbon, hydrogen, nitrogen, oxygen), the most of the electrons are transmitted with little or no energy loss at any HV, but the dispersion of the electrons trajectories increase strongly when lowering HV (fig. 8).
Fig. 8: Beam dispersion at 5, 15 and 25kV and BF/DF corresponding images
STEM in the SEM offers the ability to perform images using the STEM but also SE and BSE detectors. This combination of detectors is a great advantage for discrimination of contrasts in the STEM DF/BF images. An example is presented on fig. 9.
Fig. 9: Observation of a TEM preparation of a biofilm. Top-left: STEM bright field / Top – right: STEM dark field
On fig. 9, the same area is simultaneously imaged using STEM BF / DF, BSE and SE detectors. Some bright particles are clearly visible on BF or DF images (with reverse contrast on the other). Due to the origin of contrast in TEM images, these bright particles cannot be associated to a difference in composition. BSE images of these particles can be used to discriminate between strong diffraction contrast and high Z. On this image, bright particles observed on the BSE image together with DF images were analyzed by EDS and appeared to be composed of calcium and phosphorus (i.e. aggregates of hydroxyl-apatite, the major mineral in the human body, present for example in the composition of bone and dental tissues). This composition was confirmed by EDS mapping by TEM (fig. 10).This kind of map is very useful for the understanding of the internal structure of cells.
Fig. 10: EDS analysis and mapping on a bacteria (TEM)
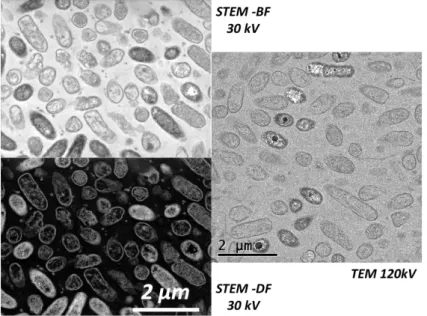
A comparison of TEM (CM 20 - 120kV) and STEM-in-SEM (30 kV) was performed. An example is presented on fig. 11.
According to fig. 11, the SEM resolution is clearly good enough for biological sample observation. Combined with other SEM detectors, it appears to be a great advantage for the study of microorganisms-mineral interfaces.
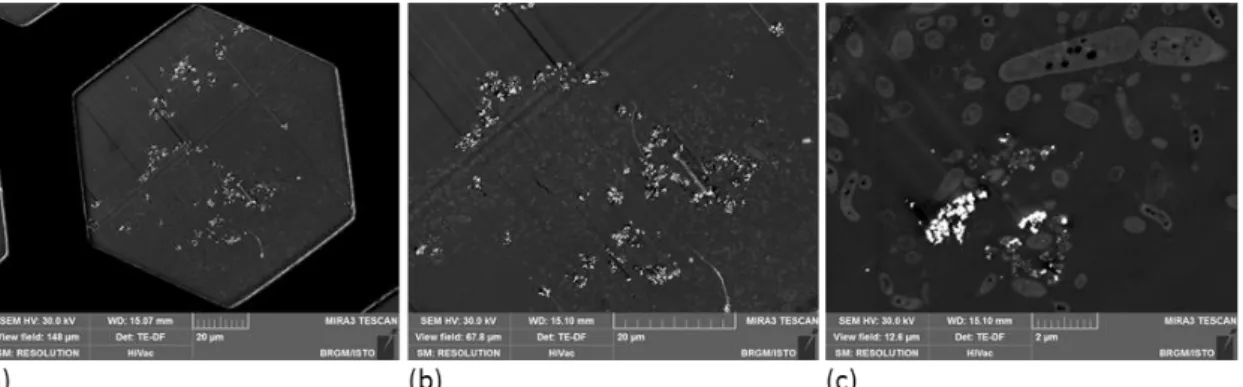
Another advantage of the use of STEM-in-SEM is the ability to access to very low magnification to search of regions of interest (fig. 12).
Fig. 12: Observation of the repartition of Iron nanoparticles in a biofilm (a) view field 148 µm (a complete grid hole) (b) 67.8 µm (c) 12.6µm
Biofilms put in contact with Fe0 NPs were prepared for (S)TEM imaging. A lectin-gold labelling was performed on the fresh biofilm to locate EPS matrix. A microtome section of the biofilm preparation is presented on fig. 12. The STEM-in-SEM enables to observe the biofilm section from the millimetric to the nanometric scale. STEM DF imaging shows that Fe0 NPs were present as aggregated particles in the biofilm, but no NPs were visible at more than 10-15 µm from the surface and NP penetration in the biofilm was limited to the surface area.
Observations at higher magnifications were used to precisely describe the connection between bacteria and NPs. Lectin-gold labelling was applied to the biofilms to highlight EPS in the biofilm. Some images are presented on fig. 13.
Fig. 13: Distribution of Iron nanoparticles and EPS (gold labelling) in a biofilm
Lectine-gold labelling and NPs are clearly distinguished on STEM-DF. It can be observed that:
Gold labelling appeared everywhere in the biofilm. No labelling was in contact with the membrane of the bacteria, but surrounded the cells at a distance of approximatively 0.2-0.5 µm. This suggested that the targeted EPS were capsular type EPS.
Fe0 NPs were only present on or close to the surface of the biofilm. Like gold labelling, no NPs were in direct contact with bacteria, which suggested that EPS formed a protective layer around them.
Using STEM-in-SEM imaging only, it was not possible to conclude – or exclude – to a co-location of Fe0 NPs and gold labelling – i.e. a connection – and an interaction - between Fe0 NPs and EPS
The third point can be evidenced using EDS analysis. In the SEM, EDS punctual analysis is possible using a long counting time (fig. 14).
Fig.14: EDS analysis (STEM-in-SEM) of a Fe0 NPs aggregate on EPS matrix.
But mapping appears to be difficult or impossible due to the EDS detector geometry in the SEM. Then EDS and/or EELS on TEM are required for such analyses.
Fig. 15: STEM (TEM) BF / DF and EDS mapping on Fe and Au
EDS mapping on Fe and Au on a Fe0 NPs aggregate is presented on fig. 15. The presence of gold labelling together with Fe NPs was confirmed by these elemental maps. This co-location Fe/Au suggests an interaction between NPs and EPS. No (or few) individual iron particles are detected. It also suggests that iron NPs were present in the biofilm as aggregates in contact with EPS, but not directly with bacteria. It also confirms that no direct interaction between iron NPs and micro-organisms can be considered, because of the presence of a thick layer of EPS surrounding the bacteria.
Conclusion
We applied cryo-SEM and STEM-in-SEM to the observation of the bio-mineral interface. Biofilms were grown on the surface of PVC tubes with a nutritive solution to enhance denitrification, or on sand, and then put in contact with zero-valent iron nanoparticles. Biofilms were studied for understanding the behavior of NPs in the presence of biofilms, using electron microscopy techniques cryo-SEM and STEM-in-SEM. Specific protocols were developed or adapted for these observations. Cryo-SEM samples exhibited a low number of bacteria visible in the biofilm but showed rather a network with forms whose shape and size are similar to that of bacteria. We suggest that these forms may be bacteria embedded in an exopolysaccharide network. This hypothesis was confirmed by STEM observations with lectin-gold labelling for EPS detection, which showed that the bacteria were encapsulated in a matrix of EPS. STEM analyses also showed Fe0 NPs aggregates on or near the surface (up to 10µm) of the biofilm, but not in direct contact with bacteria. Complementary TEM/EDS analysis also revealed that Fe0 NPs areconnected to the EPS matrix, as confirmed by EDS mapping of gold and iron which exhibit co-location of lectin-gold (EPS markers) with iron aggregates. Then, the combination of cryo-SEM and STEM-in-cryo-SEM, supplemented by TEM/EDS (or EELS) analysis appeared to be a performant tool for understanding the biofilm / mineral interface and interaction.
Acknowledgments
This work is in the project BIOMEB supported by BRGM research direction in collaboration with projects BIOSORP (PDR13D3E80) and NANOREM (FP7 2007-2013 Grand agreement No. 309517). Cryo-SEM and TEM (CM20) observations were performed at the Electron microscopy center (CME) at the university
of Orleans (France). TEM and STEM preparation were carried out by MRic TEM-Biosit electron microscopy platform at the university of Rennes (France).
TEM /EDS/EELS (Jeol ARM200F) analysis were performed at the Centre Raymond Castaing (Toulouse - France) and at the demonstration center of JEOL Ltd (Tokyo – Japan)
[ 1] Colmer A.R. andHinkle M. E., (1947) The Role of Microorganisms in Acid Mine Drainage:
A Preliminary ReportScience 19 253-256
[ 2] Morin D (1995a) biotechnologie dans la métallurgie extractivetechniques de l’ingenieur M2238
[ 3] Morin D (1995 b) bacterial leaching of refractory gold sulfide oresBioextraction and Biodeterioration of Metals ed. Scheiner BJ, Doyle FM, Kawatra SK, 25-62 (University press Cambridge UK)
[ 4] Barret J, Hugues MN, Karavaiko GI, Spencer PA (1993) metal extraction by bacterial oxidation of minerals Ellis Herwood series – Inorganic chemistry, p. 191 (ed. Simon &Schuter Int. Group)
[ 5] Battaglia-Brunet F. D’Hugues P., Cabral T., Cezac P. Garcia JL, Morin D (1998) the mutual effect of mixed thiobacilli and leptospirilli populations on pyrite bioleachingMinerals Engineerging11(2) 195-205
[ 6] Priester, J.H.; Horst, A.M.; Van De Werfhorst L.C.; Saleta, J.L.; Mertes L.A.K., Holden P.A. (2007) Enhanced visualization of microbial biofilms by staining and environmental
scanning electron microscopy Journal of Microbiological Methods 68(3) 577-587
[ 7] Von Ardenne M., Beischer D. (1940) Untersuchung von Metalloxyd-rauchenmitdem
universal-elektronmikroskopZeischriftfürelektrochemie und angewandtephysikalischechemie46 270-277
[ 8] Lane, W.C. (1970). The environmental control stage Scanning Electron Microscopy. Ed. O. Johari (IITRI, Chicago)
[ 9] Karcz, J., Bernas T., Nowak A., Talik E., Woznica A., (2012) Application of Lyophilization
to Prepare the Nitrifying Bacterial Biofilm for Imaging with Scanning Electron Microscopy
Scanning 34 26-36
[ 10] Alhede M., Qvortrup K., Liebrechts R., Høiby N., Givskov M., Bjarnsholt T. (2012) Combination of microscopic techniques reveals a comprehensive visual impression of biofilm structure and composition FEMS Immunol Med Microbiol65(2) 335-342
[ 11] Tracy, B., Alberi, K. (2004) Adopting low-voltage STEM and automated sampleprep to
perform IC failure analysisMicromagazine2004/07 87–93
[ 12] Golla-Schindler, U., (2004)STEM-Unit measurements in a scanning electron microscope Proceedings of the European Microscopy Congress (Antwerpen)
[ 13] BognerA., Jouneau P.-H., TholletG., BassetD., Gauthier C.(2007) A history of scanning
electron microscopy developments: Towards Wet-STEM imagingMicron 38390-401
[ 14] Guise O., Strom C., Preschilla N.,(2011) STEM-in-SEM method for morphology analysis of
polymer systemsPolymer 52 1278-1285
[ 15] BrownG.M.,Westwood A.D. (2003) Characterization of polymers and catalysts using
scanning transmission electron microscopy (STEM) in a field emission SEMMicroscopy&Microanalysis 9(2) 1020-1021
[ 16] Barkay Z., Rivkin I., Margalit R.(2009) Three-dimensional characterization of
[ 17] Mercier A., Wille, G; Michel C., Harris-Hellal J., Amalric L., Morlay C., Battaglia-Brunet F. (2013) Biofilm formation vs PCB adsorption on granular activated carbon in
PCB-contaminated aquatic sediment Journal of Soils and Sediments 13(4) 793-800
[ 18] Kämper M., Vetterking S., Berker R., Hoppert M. (2004). Methods for in situ detection and
characterization of extracellular polymers in biofilms by electron microscopy. J. Microbiol.
Methods 57: 55-64.
[ 19] Michel C., Garrido F., Roche E., ChallanBelval S., Dictor M.-C. (2011). Role of
exopolymeric substances (EPS) in the stability of the biofilm of Thiomonasarsenivorans grown on a porous mineral support J. Microbiol.Biotechnol.21 183-186
[ 20] Gerard E., Guyot F., Philippot P., Lopez-Garcia P.(2005)Fluorescence in situ hybridation
coupled to ultra smallimmunogold detection to identify prokaryotic cells using transmission and scanning electron microscopyJournal of Microbiological Methods6320– 28
[ 21] Hellal J., Jolly L., Michel C., Mouvet C., Wille G., Ollivier P. (2015) Interaction entre
biofilms bactériens et nanoparticules de fer réactives dans le cadre de procédés de nanoremediation7th National Biofilms network (RNB) symposium, Toulouse (France)
[ 22] Michel C., Wille G., Jolly L., Richard A., Burel A., Ollivier P., Mouvet C., Hellal J.(2016)Analysis of biofilm-nanoparticles interaction using microscopy (fluorescence,